
A small bounce continued as the hourly Elliott wave counts expected. Price remains within the channels.
Summary: Expect downwards movement now to continue at least for the short term. A short term target is at 1,261. This downwards swing may go as low as 1,170 to 1,158.
Use the channels drawn on the hourly charts (they are the same). Expect price to keep falling while it remains within the channel. If that channel is breached by upwards movement, expect a big bounce. The upper edge of the channel may be used to place trailing stops for shorts.
Always trade with stops and invest only 1-5% of equity on any one trade.
New updates to this analysis are in bold.
Last monthly charts for the main wave count are here, another monthly alternate is here, and video is here.
Grand SuperCycle analysis is here.
The wave counts will be labelled first and second. Classic technical analysis will be used to determine which wave count looks to be more likely.
FIRST ELLIOTT WAVE COUNT
WEEKLY CHART
Click chart to enlarge.
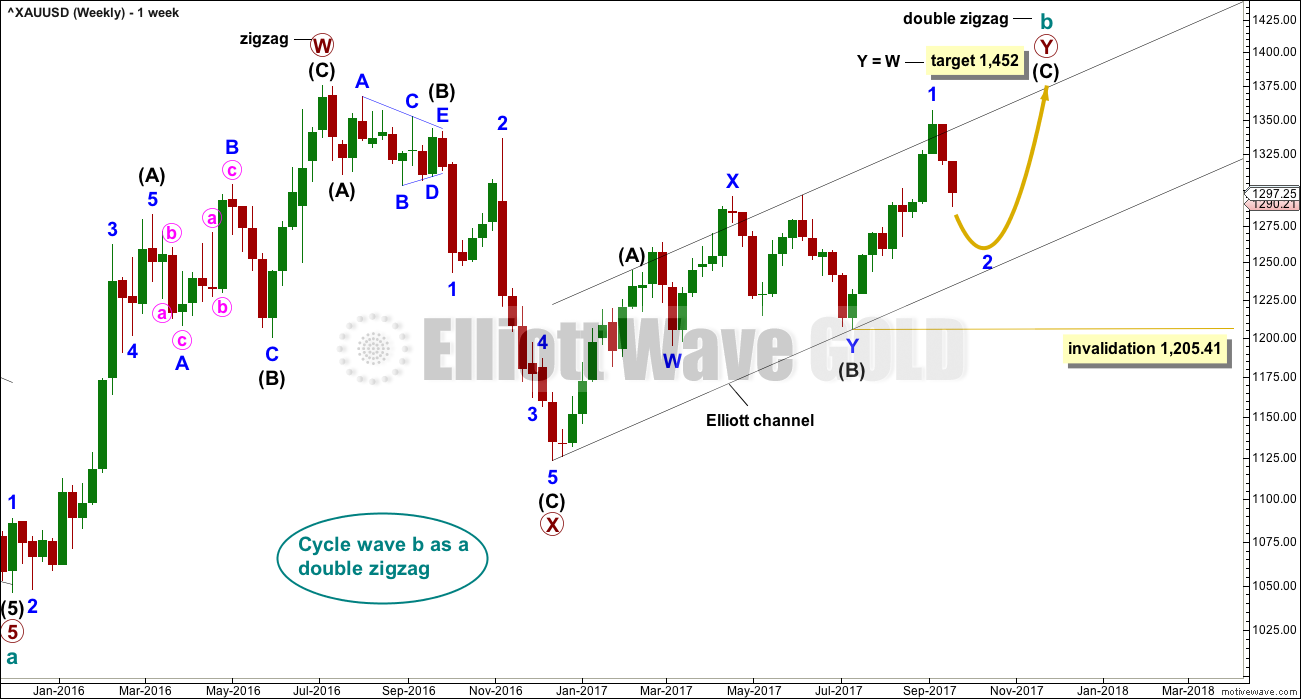
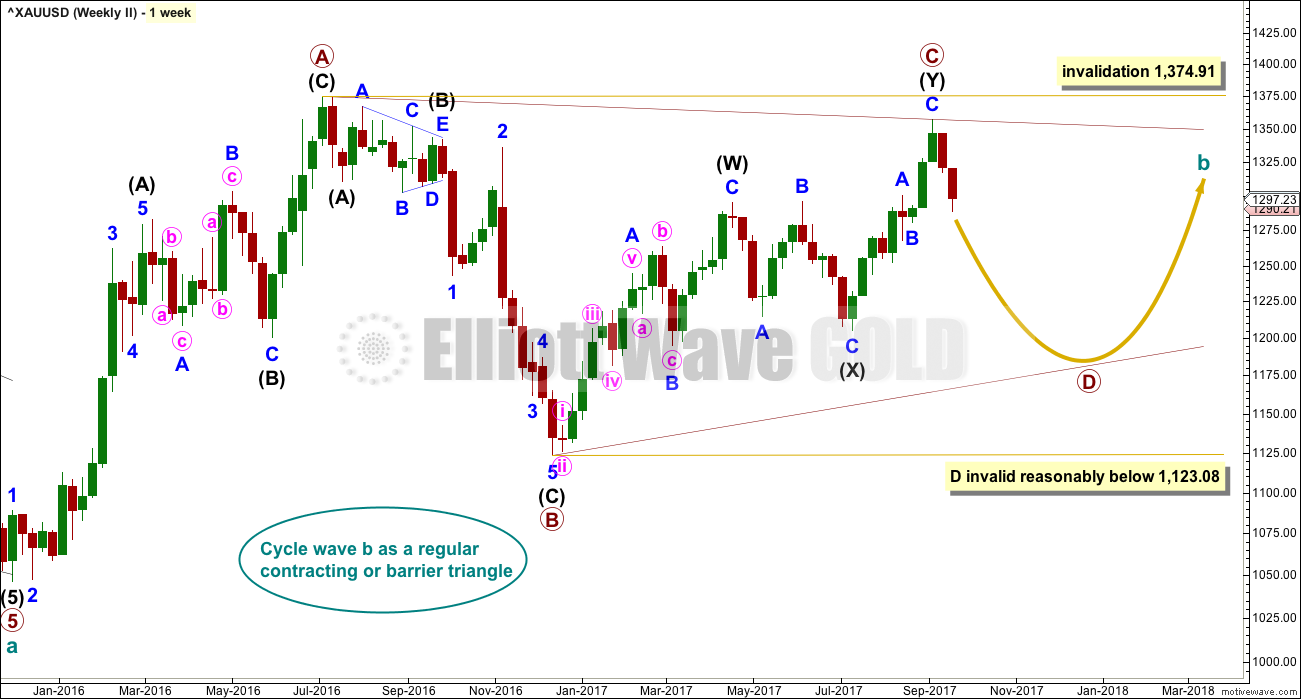
There are more than 23 possible corrective structures that B waves may take, and although cycle wave b still fits well at this stage as a triangle, it may still be another structure. This wave count looks at the possibility that it may be a double zigzag.
If cycle wave b is a double zigzag, then current upwards movement may be part of the second zigzag in the double, labelled primary wave Y.
The target remains the same.
Within intermediate wave (C), no second wave correction may move beyond the start of its first wave below 1,205.41. However, prior to invalidation, this wave count may be discarded if price breaks below the lower edge of the black Elliott channel. If this wave count is correct, then intermediate wave (C) should not break below the Elliott channel which contains the zigzag of primary wave Y upwards.
There are two problems with this wave count which reduce its probability in terms of Elliott wave:
1. Cycle wave b is a double zigzag, but primary wave X within the double is deep and time consuming. While this is possible, it is much more common for X waves within double zigzags to be brief and shallow.
2. Intermediate wave (B) within the zigzag of primary wave Y is a double flat correction. These are extremely rare, even rarer than running flats. The rarity of this structure must further reduce the probability of this wave count.
DAILY CHART
Click chart to enlarge.
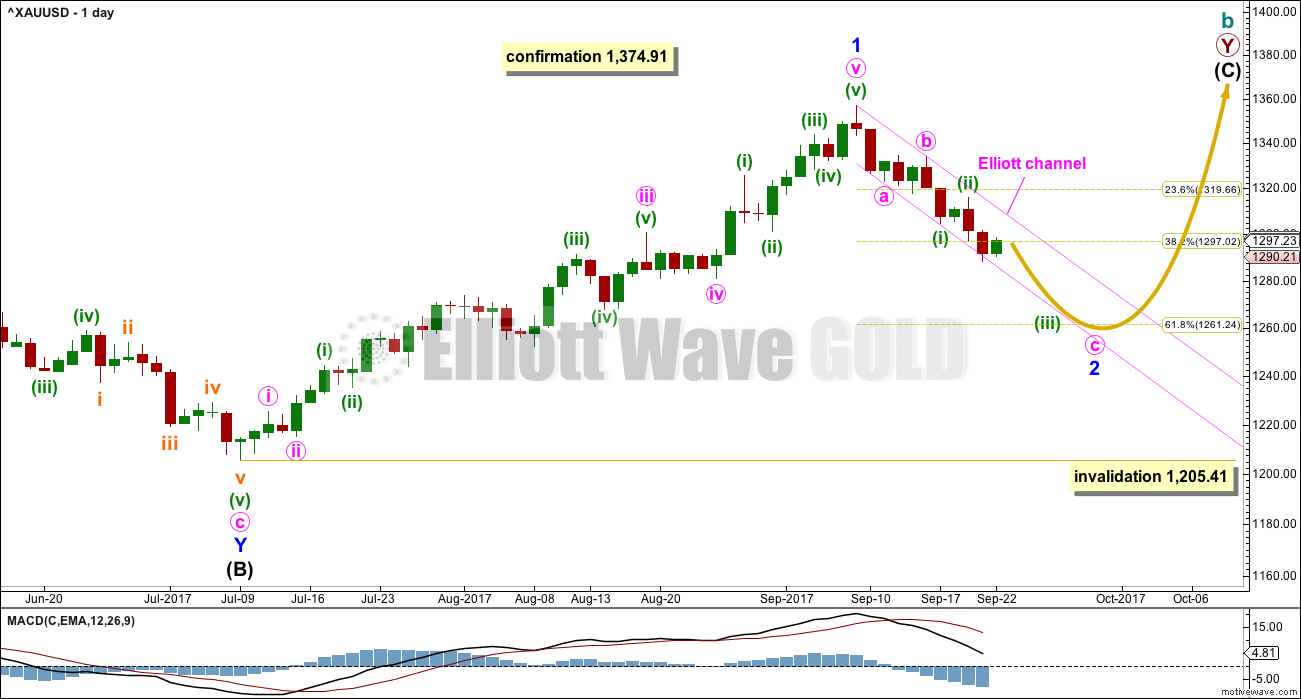
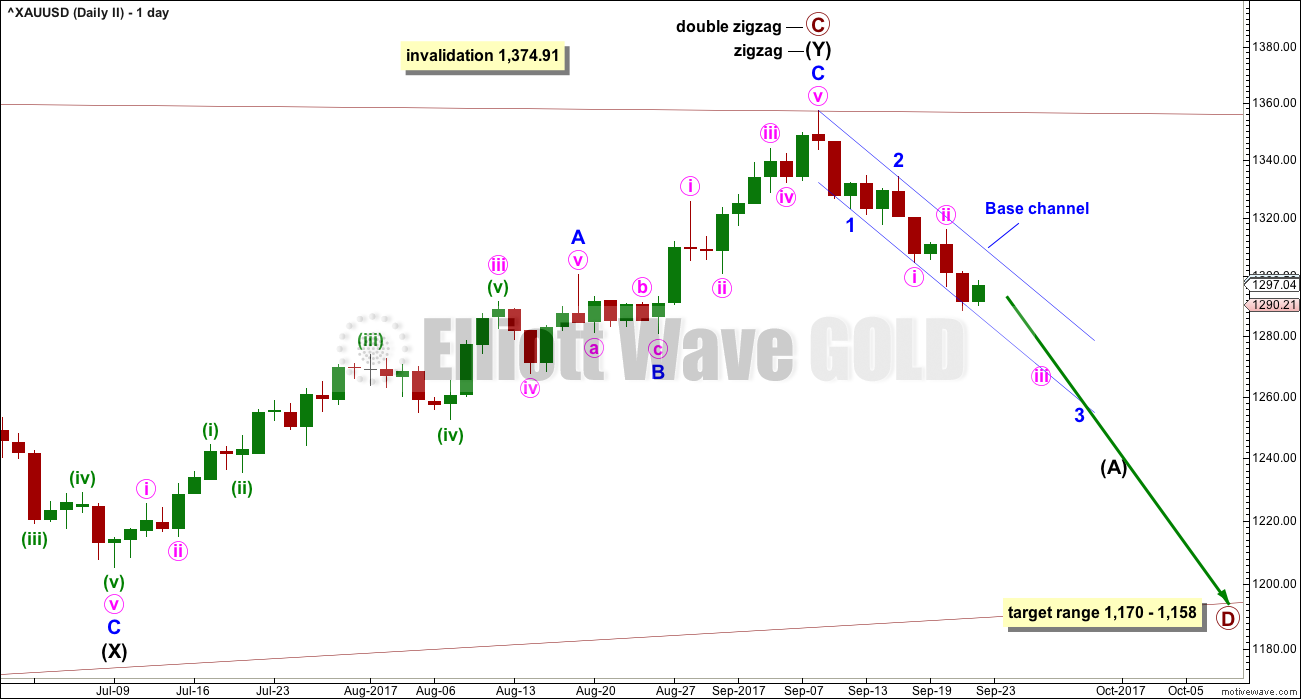
The analysis will focus on the structure of intermediate wave (C). To see details of all the bull movement for this year see daily charts here.
Intermediate wave (C) must be a five wave structure, either an impulse or an ending diagonal. It is unfolding as the more common impulse.
It is possible that minor wave 1 may have been over at the last high and the current pullback may be minor wave 2. Minor wave 2 may not move beyond the start of minor wave 1 below 1,205.41.
The target for minor wave 2 is at the 0.618 Fibonacci ratio of minor wave 1.
HOURLY CHART
Click chart to enlarge.
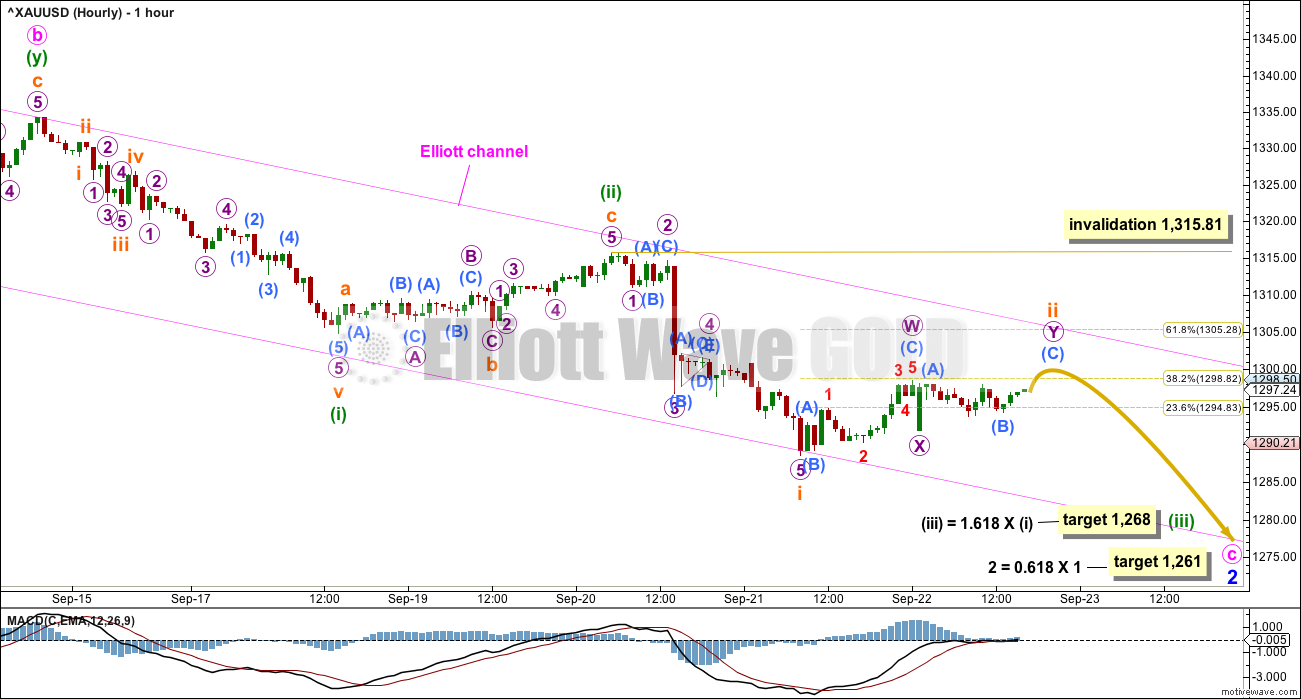
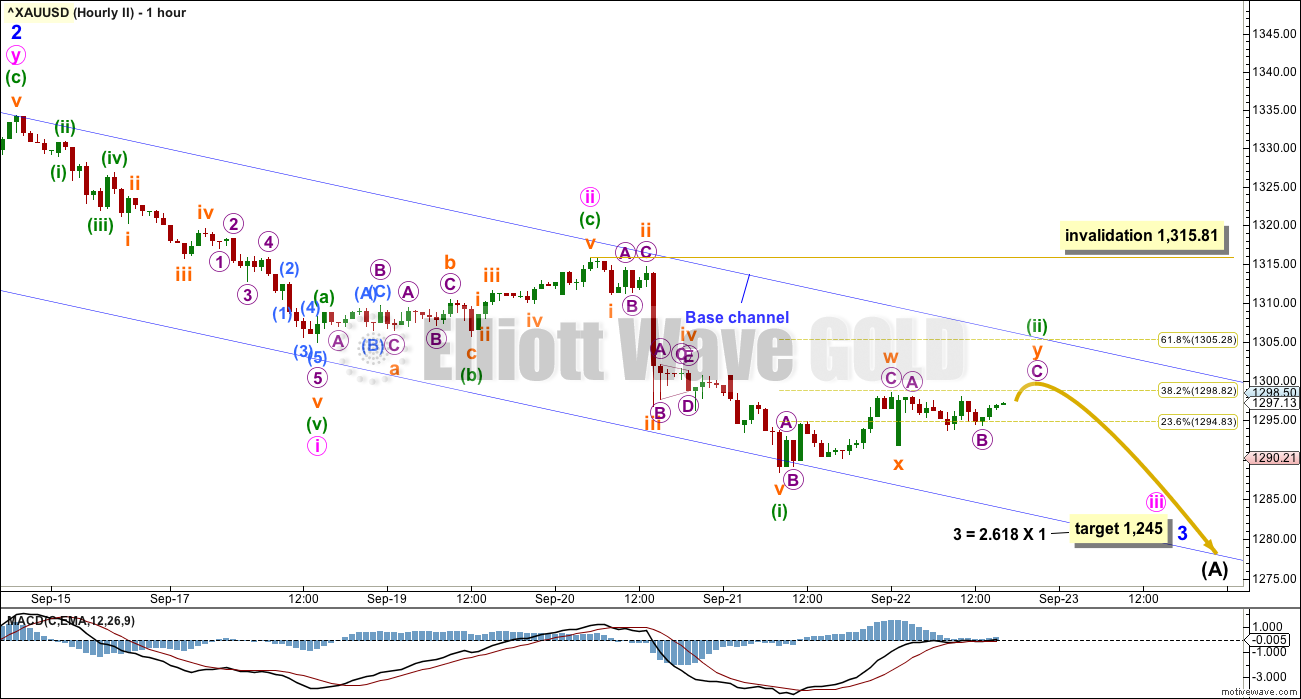
Minor wave 2 may be unfolding as a single zigzag, which is one of the most common structures for a second wave.
Zigzags subdivide 5-3-5. So far minute waves a and b look complete. Minute wave c must subdivide as a five wave structure and at this stage looks to be the more common impulse.
This hourly wave count follows on directly from labelling on the daily chart. For this wave count minute waves a, b and now c look to have good proportion at the daily chart level and the Elliott channel has a good fit. Minute wave c is expected to be extending.
So far, within minute wave c, minuette waves (i) and now (ii) look complete.
Minuette wave (iii) should exhibit an increase in downwards momentum; third waves are usually stronger than first waves. Minuette wave (iii) now does exhibit slightly stronger momentum than minuette wave (i). A further increase may be expected if this wave count is correct.
Minuette wave (iii) may only subdivide as an impulse. Subminuette wave i may now be complete. Subminuette wave ii may be a shallow double zigzag that may complete early in Monday’s session. Thereafter, a third wave down at two degrees would be expected by this hourly wave count.
If subminuette wave ii is deep, then it should find very strong resistance at the upper edge of the pink Elliott channel copied over from the daily chart.
Minor wave 1 lasted 44 days in total. So far minor wave 2 has only lasted 10 days. It should be expected to last longer than this for the wave count to have good proportions. A Fibonacci 13 is now a minimum expectation, which would see minor wave 2 end next Wednesday.
Price should remain with the Elliott channel while minor wave 2 continues. If this channel is breached by upwards movement, that shall be an early indicator that minor wave 2 may be over.
If this wave count is correct, then when this pullback is complete then a third wave up should unfold. That may now begin next Wednesday at the earliest.
ALTERNATE HOURLY CHART
Click chart to enlarge.
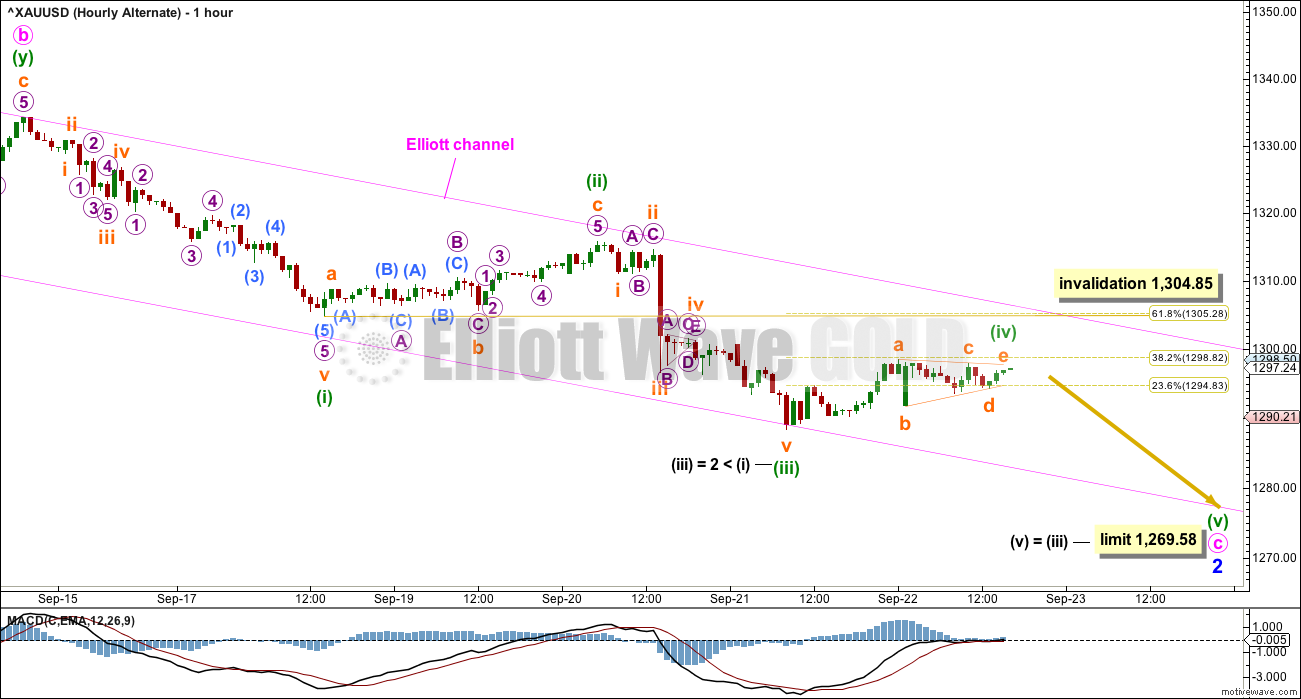
This wave count is identical to the main hourly wave count up to the high labelled minuette wave (ii).
Thereafter, this alternate moves the degree of labelling within minuette wave (iii) all up one degree; it is possible that it is complete.
The probability of this wave count is reduced slightly, which is why it is considered as an alternate, because minuette wave (iii) would be $2 shorter in length than minuette wave (i). Third waves do not have to be longer than first waves, but they most often are. When a third wave is shorter in length than the first wave, this limits the following fifth wave to no longer than equality in length with the first wave, so that the core rule stating a third wave may not be the shortest is met.
Minuette wave (iv) will subdivide so far as a regular contracting triangle. This would provide perfect alternation with the deeper zigzag of minuette wave (ii).
If minuette wave (iv) does not complete as a triangle and morphs into a combination, then it may not move into minuette wave (i) price territory above 1,304.85.
If minuette wave (iv) moves higher, then the limit for minuette wave (v) must also move correspondingly higher. It is limited to no longer than 27.39 in length.
This alternate hourly wave count still has a good look at the daily chart level. It could see minor wave 2 end very early next week, on Monday or Tuesday.
SECOND ELLIOTT WAVE COUNT
WEEKLY CHART
Click chart to enlarge.
It is still possible that cycle wave b is unfolding as a regular contracting triangle.
Within a triangle, one sub-wave should be a more complicated multiple, which may be primary wave C. This is the most common sub-wave of the triangle to subdivide into a multiple.
Intermediate wave (Y) now looks like a complete zigzag at the weekly chart level.
Primary wave D of a contracting triangle may not move beyond the end of primary wave B below 1,123.08. Contracting triangles are the most common variety.
Primary wave D of a barrier triangle should end about the same level as primary wave B at 1,123.08, so that the B-D trend line remains essentially flat. This involves some subjectivity; price may move slightly below 1,123.08 and the triangle wave count may remain valid. This is the only Elliott wave rule which is not black and white.
Finally, primary wave E of a contracting or barrier triangle may not move beyond the end of primary wave C above 1,295.65. Primary wave E would most likely fall short of the A-C trend line. But if it does not end there, then it can slightly overshoot that trend line.
Primary wave A lasted 31 weeks, primary wave B lasted 23 weeks, and primary wave C lasted 38 weeks.
The A-C trend line now has too weak a slope. At this stage, this is now a problem for this wave count, the upper A-C trend line no longer has such a typical look.
DAILY CHART
Click chart to enlarge.
This second wave count expects the new wave down may be deeper and longer lasting than the first wave count allows for.
The blue base channel on this second wave count is drawn in exactly the same way as the pink Elliott channel on the first daily chart. For this second wave count the middle of minor wave 3 should have the power to break below support at the lower edge of the base channel. If price does behave like this, it would offer support for this second wave count over the first wave count.
A common length for triangle sub-waves is from 0.8 to 0.85 the length of the prior wave. Primary wave D would reach this range from 1,170 to 1,158.
If primary wave C is correctly labelled as a double zigzag, then primary wave D must be a single zigzag.
HOURLY CHART
Click chart to enlarge.
1-2-3 of an unfolding impulse and a-b-c of a zigzag have exactly the same subdivisions: 5-3-5. Subdivisions of downwards movement are seen in the same way for both hourly wave counts.
Minor wave 3 may reach a common Fibonacci ratio to minor wave 1.
Minor wave 3 may only subdivide as an impulse. So far minute waves i and ii look complete. Minute wave iii also may only subdivide as an impulse. Within minute wave iii, minuette wave (i) may now be complete.
It is also possible that while price remains below 1,304.85 minute wave iii may be over at the low labelled minuette wave (i). However, this may have a reasonably low probability because the wave labelled minute wave i is 29.39 in length and the last wave to today’s low is 27.30 in length. Minute wave iii is more likely to be longer than minute wave i, not shorter.
Minuette wave (ii) may not move beyond the start of minuette wave (i) above 1,315.81.
Use the 0.382 Fibonacci ratio as a preferred target for minuette wave (ii). At this stage, within a third wave, corrections may begin to be more brief and shallow.
The base channel is exactly the same as the Elliott channel on the first wave count. If this second wave count is correct, then along the way down corrections should find resistance about the upper edge of the base channel.
A third wave should have the power to break below a base channel. If price does break below the lower trend line, that shall offer a little confidence in this wave count.
The target for minor wave 3 is today adjusted. This new target allows for the middle of minor wave 3 to be a stretched out extension.
TECHNICAL ANALYSIS
WEEKLY CHART
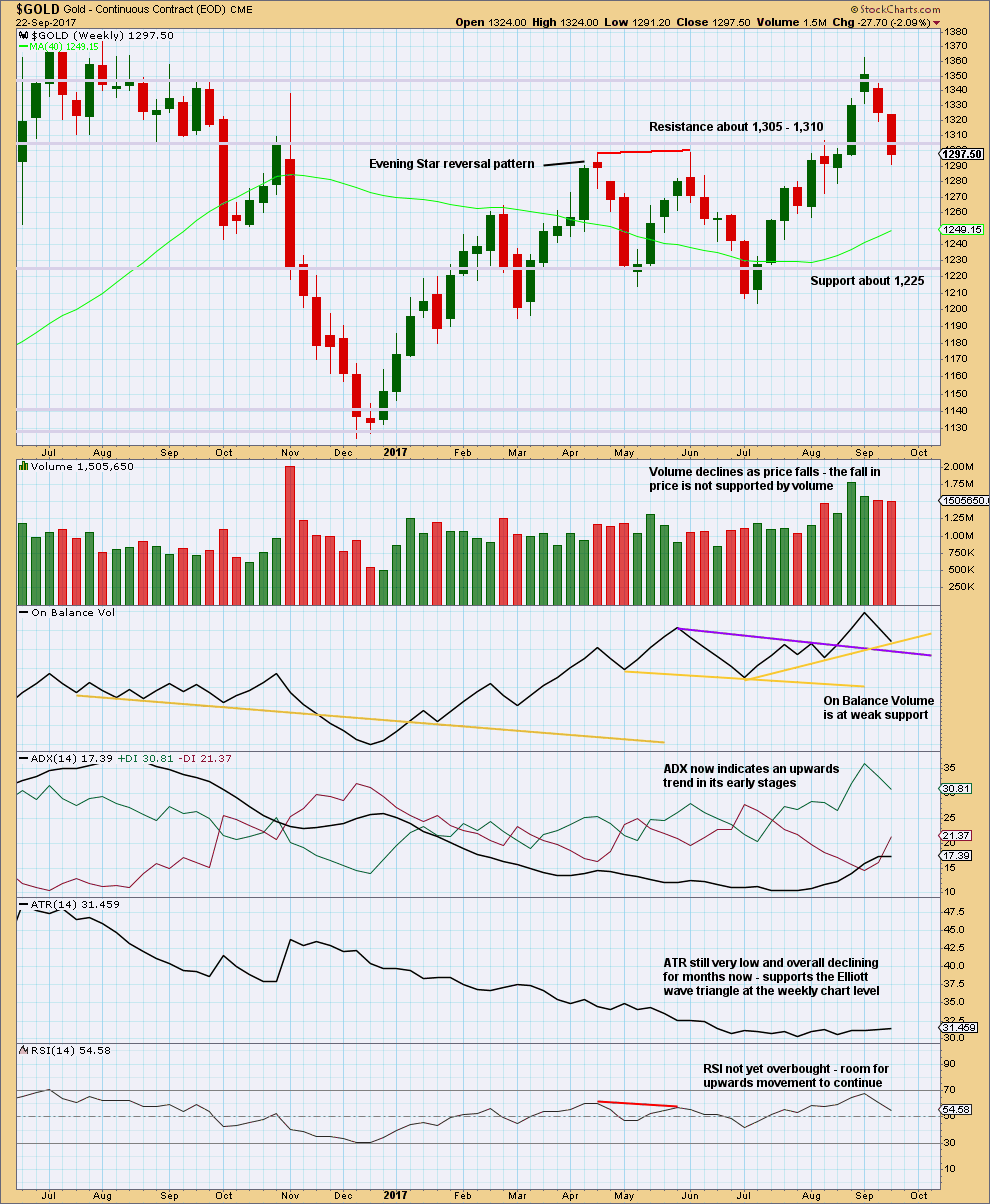
Click chart to enlarge. Chart courtesy of StockCharts.com.
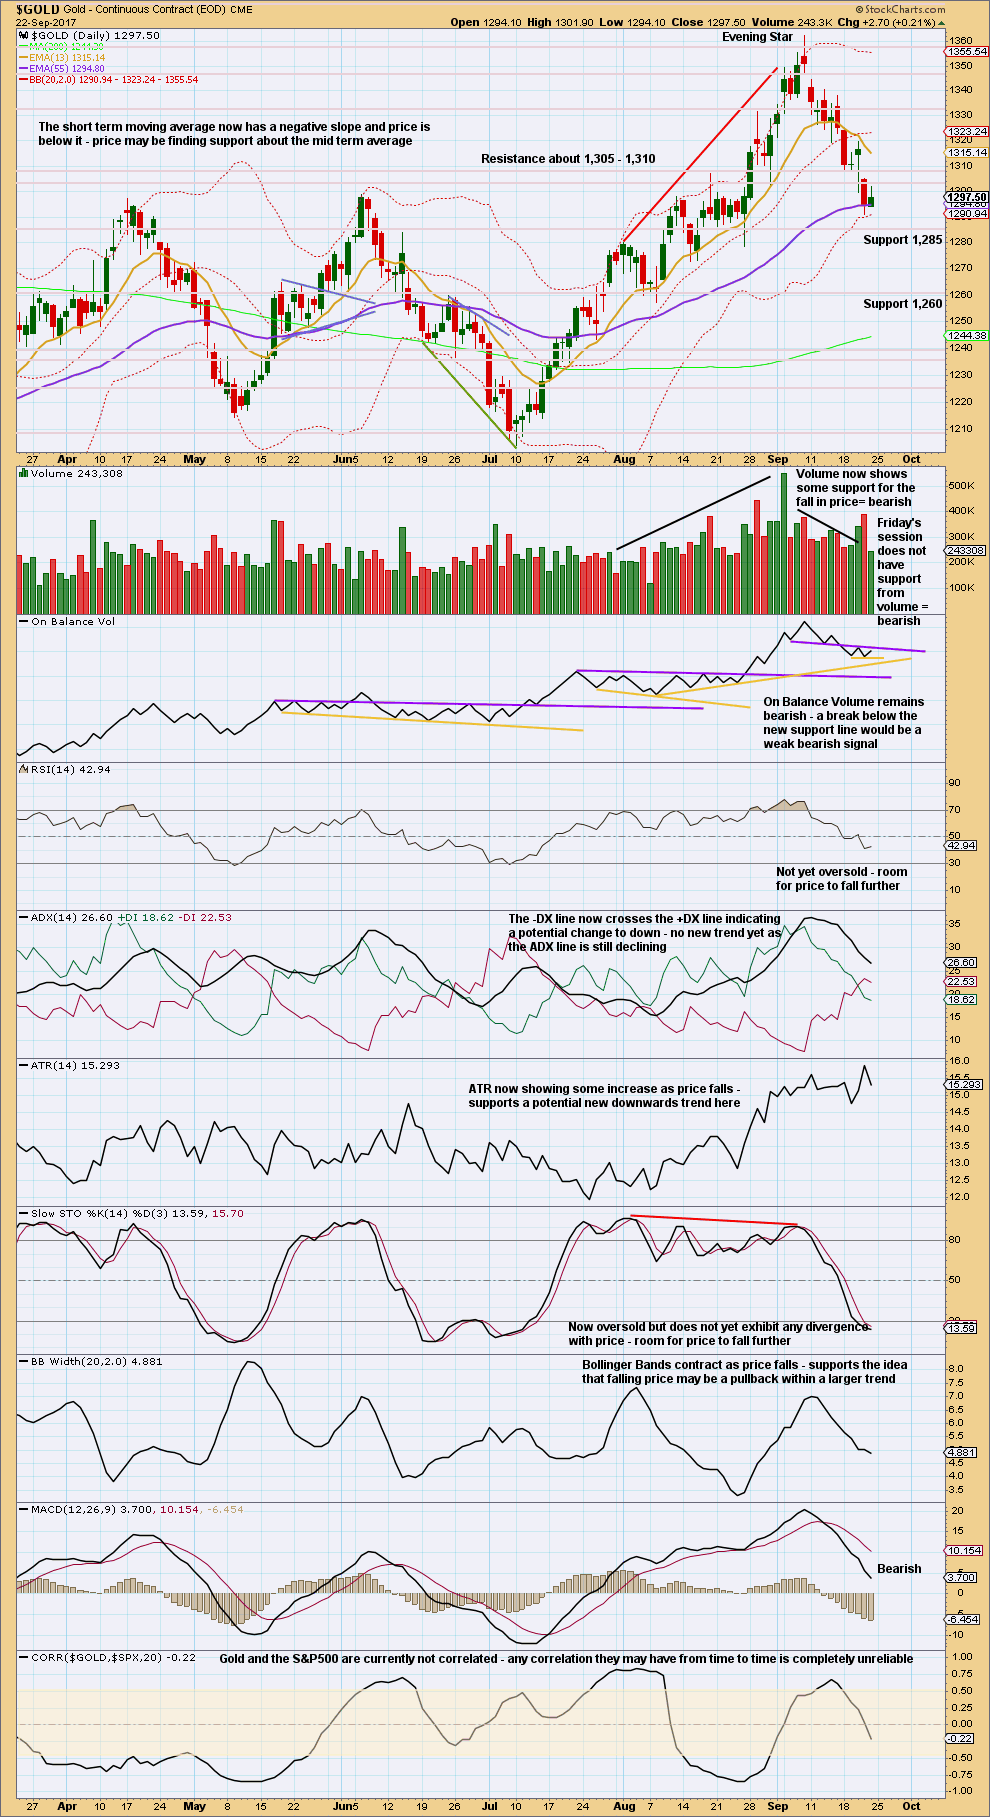
Weak support here from On Balance Volume may halt the fall in price or initiate a small bounce. If On Balance Volume breaks below the support line next week, that would be a weak bullish signal.
Overall, this chart remains mostly bullish. At this stage, with downwards movement not being well supported by volume, it should be assumed to be a pullback within a larger trend until shown otherwise.
DAILY CHART
Click chart to enlarge. Chart courtesy of StockCharts.com.
A small range inside day for Friday has a balance of volume upwards and closes green. Much lighter volume for this session strongly suggests it is another small correction within the short term downwards trend. The longer upper wick on the daily candlestick supports this view. It suggests a red daily candlestick for Monday.
GDX
DAILY CHART
Click chart to enlarge. Chart courtesy of StockCharts.com.
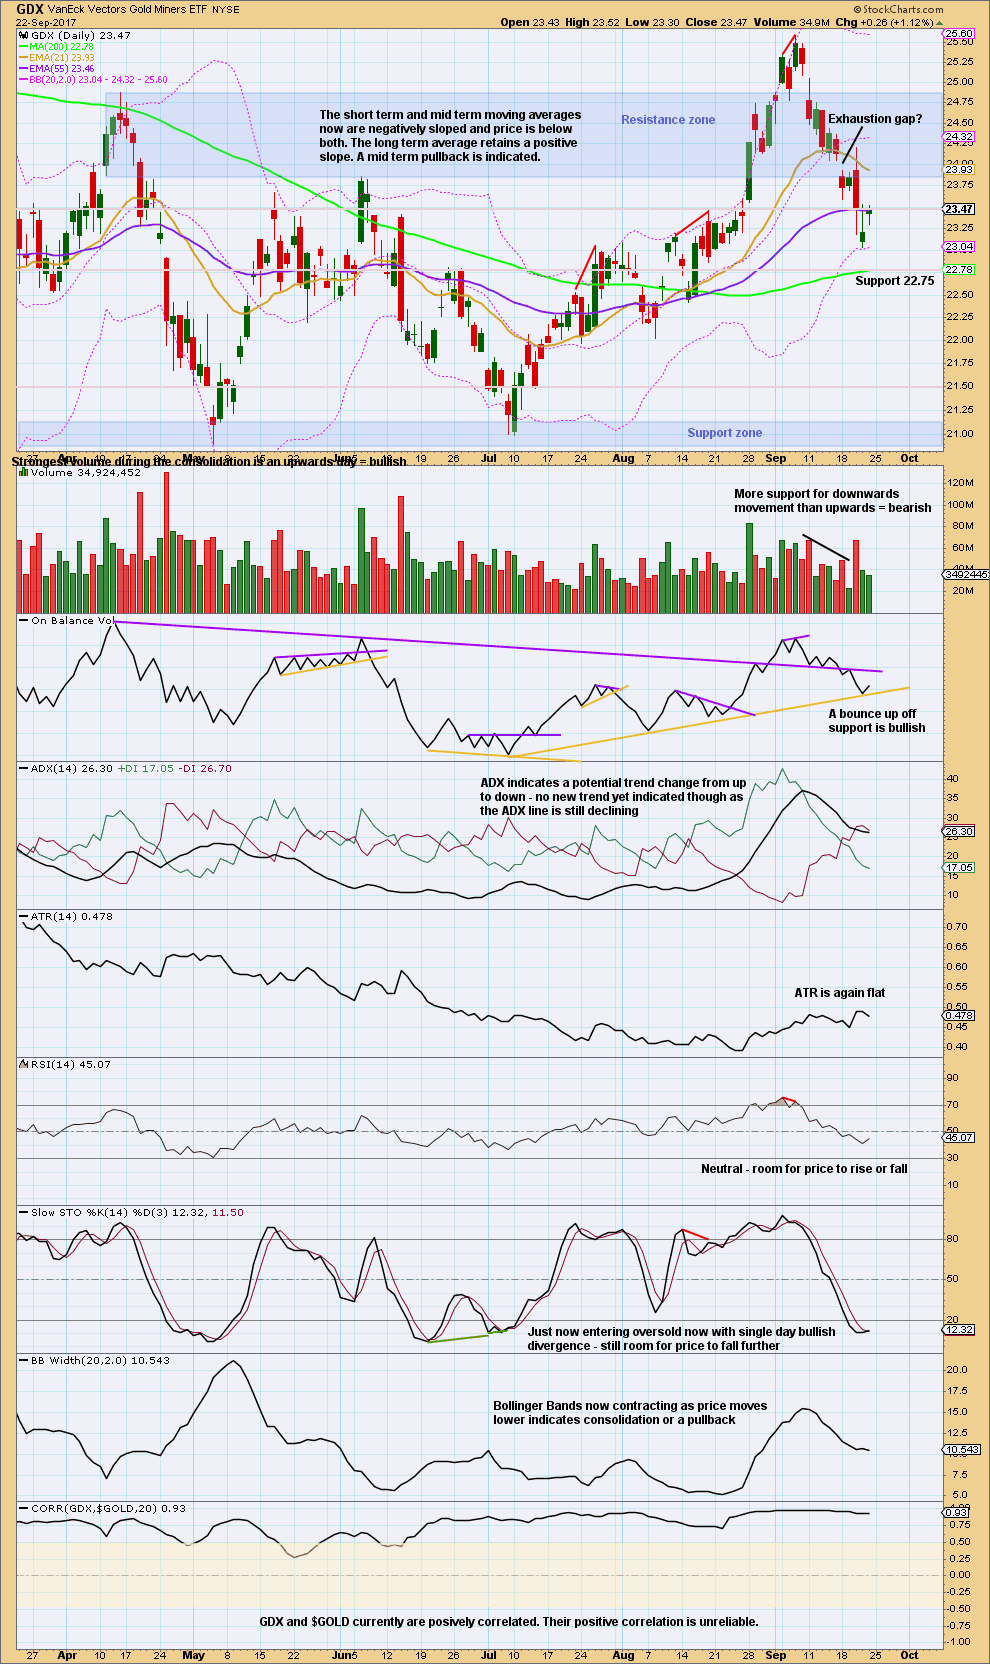
For the short term, lighter volume for Friday’s upwards day suggests upwards movement is a counter trend movement. This suggests a red candlestick on Monday.
But support here from On Balance Volume may halt any further fall in price. This support is strong.
If On Balance Volume breaks below support, that should be taken as a strong bearish signal.
Published @ 01:44 a.m. EST on 23rd September, 2017.
Imo short term rally (up move) in the making. Should look to target a take out of 10dma (1312) for 20dma (1320).
GDX hourly looking to break channel. Now is likely a good time to buy unless you prefer to wait for the full breakout and backtest.
https://www.tradingview.com/x/QJdyETyW/
Hourly chart updated:
It could be over, the channel about the wave down has been breached now in the last 3 hours. There could be a complete structure if minute b was over more quickly.
The proportions aren’t as good IMO as the charts published in the analysis which see minute b over at the next swing high, taking a bit more time, but it looks like price is telling us that is not correct.
I’ll now start to add more detail in the start of minor 3.
detail
when minute i up is complete then a backtest for minute ii may be deep.
thanks Lara
Bullish engulfing candle for GDX after tag of lower B band looks bullish!
Agree 🙂
So Gold is not making this easy for us. As Daniel stated, the downtrend channel has been broken and as Syed states, Lara’s invalidation is not hit yet. So where are we?
Several options unfortunately:
1) Minor 2 is complete, so up we go
2) Just the first leg down for Minor 2 is complete. It could morph into a Double Zig Zag, a Flat, or Combination
3) The more bearish alternate triangle count is still in play and this is just a bounce.
I don’t think we get any major movement balance of day now, so we can wait for more Lara guidance
Option 1 shown in this graph
https://www.tradingview.com/x/lZ6pK4PT/
Dreamer,
Thanks for chart idea seeing minor 2 done as different from Lara’s alternate count. However can you double check as I have beginning of ii of minute wave 1 of c being higher than start of b wave as labelled. Thanks.
Now that I see Lara’s updated chart, problem has been resolved.
Using Trading View data, it’s correct as shown. On Barchart, it’s the way you state. See Lara’s count above. It can work out either way. That’s the frustrating part of gold as there is no standard data feed.
Clearly we are having a bounce given breach of downtrend but as you stated this does not have to be end of minor 2 but just the first 3 waves down as we only reached just beyond .382 retracement. As well 50smda on gold was at 1291 so a bounce here was reasonable. So ? is, is minor 2 over or shall a test of 1260-1280 be in the cards. Minor 2 is also relatively brief compared to length minor 1.
My bet is that Minor 2 is over. When you look at GDX, for it to maintain the bullish DZZ count, it needed to turn up now. Looks like GDX will put in a very bullish engulfing candle on the daily.
Less likely would be that Minor 2 is not over, but the correction turns into a flat, so not much more downside after a 90% B wave up retrace.
K. Can use recent low on GDX of 23.04 as stop. Have a green cloud and upward rampage of cloud on Ichimoku as well on daily chart.
Yes, cloud looks bullish too. Good catch.
The move down did not take out previous low and move up of what is presumed a second wave correction has breached the downtrend line of first and second waves of 1 degree higher. So concerned about what would represent the best wave count.
Invalidation is still 1315.81. However imo Gold price should really now not be getting back below 1300 (1296 holding?) before it gets to 1330s. A pullback (drop) during the week to look out for though. Lets see how this closes.
In my opinion it looks like gold is giving us a big clue that alternate hourly is correct. A classic swift triangle breakdown appears to be in the making. Look for a quick 5 wave down to end above Lara’s invalidation of 1,269.58. Could be a great buying opportunity.
Sometimes the move out of a triangle is pretty quick. Watch for a 5 down on the hourly.
https://www.tradingview.com/x/0lSXT6Yp/
You are about to be right 🙂
Bull or Bear? Imo Gold price appears to be in a bottoming process since last Wednesday / Thursday and currently appears to be finding support at 1294-93. Went long on Thursday at 1289.xx with a Stop at 1287 seeking for Gold price to break above 1293-96 for 1302-05. So far so good and holding; have got the break above 1293-96 although Gold price is facing tough resistance at 1298 and 5dma a little further up duh… Imo a throwback to and break below 1287 will likely look for a break below 1280…. With an inside day, stochastic in oversold territory and Gold price having closed at around its pivot; expecting Gold price to rise past 1300 on Monday. Hard to tell yet if Gold price is playing out Micro Y for Minor 2 / Minute C. Just wondering why would Gold price break below the lower Bollinger band / 50dma which seemed to have curtailed the price drop so far? Downward pull of the middle of the third wave? Time will tell I guess.
Fascinating analysis by Lara as always and the comments/charts by some of the members. A lot to learn every time. Thanks!
Well said Syed
In any regards, looks like we all agree we are in a counter trend move with upside ahead
I really like Dreamers count below.
Myself, when in doubt stay out.
Let’s see what the week brings.
Hi. Gold price appears to be facing headwinds under 1298 and looking toppy. A breakdown below 1288 appears to be on the cards. Oh well, cant win them all!
Dreamer
Thanks for the reply
I appreciate the exchange
Re
Your point that not all the smaller 3rds are extended, I be always found that the 3rd of the 3rd are always the most powerful and also where the gap of recognition occurs
Your feedback is much appreciated
Lara, your thoughts would be interesting
Thanks
Dreamer September 23, 2017 at 6:51 pm
vbase, the target of 1,268 for Minuette 3 is calculated from Minuette 1.
Minuette 1 = 29.39, so Minuette 3 = 29.39 x 1.618 = 47.55
Minuette 2 top = 1,315.81- 47.55 = 1,268.26
As far as your other question, I don’t think all of the smaller 3rd waves within an impulse are extended. 1.618 is the most common length, so as Lara would say, that should be the highest probability.
I’ve made some comments below.
For Gold, typical of commodities, within it’s third waves it is commonly the fifth wave of the impulse which is extended.
For equities it’s usually the third of the third.
It took me a while to get the hang of that. Works for Silver too.
longterm gold gud to buy its is very gud. Dnt go short every dip gud to buy 1 to 2 years
im sure already fourth wave start from. last september 2016 its running present i have no graphs but i say my idea its my thinking n my idea
Lara
Assuming that wave ii ends at 1300 on Monday for arguments sake and we break below 1287, what would be the target for orange iii ?
The target for 2 to complete is ~1260
Seems like there are to many waves to complete in that small range ?
Thanks
While ii is incomplete then the start of iii is unknown.
If the start of iii is unknown, then the end of iii cannot be calculated with any reasonable accuracy.
I understand
My question is re the math
* if we assume ii ends at 1300, and Gold breaks below 1287 what would be the target for iii?
Thanks
Subminuette 1 (orange) is 27.39, so targets for subminuette 3 if subminuette 2 ends @1,300 are as follows:
If subminuette 3 = 1.618 x 1, target = 1,300-44.32=1,255.68 (too low for Lara’s minuette 3 target of 1,268)
If subminuette 3 = 1, target = 1,300-27.39=1,272.61 (this looks like it would fit)
Hope this helps.
Thank you Dreamer
That’s what I had as well
Question
Why in a third of a third decline, iii of (iii) should it expected that 3 would equal 1??
How / why is the target 1268 being derived
Thanks
vbase, the target of 1,268 for Minuette 3 is calculated from Minuette 1.
Minuette 1 = 29.39, so Minuette 3 = 29.39 x 1.618 = 47.55
Minuette 2 top = 1,315.81- 47.55 = 1,268.26
As far as your other question, I don’t think all of the smaller 3rd waves within an impulse are extended. 1.618 is the most common length, so as Lara would say, that should be the highest probability.
“Why in a third of a third decline, iii of (iii) should it expected that 3 would equal 1??”
Because that target fits with the lower target for minor 2 to reach 0.618 of minor 1 at 1,261.
“Assuming that wave ii ends at 1300 on Monday for arguments sake and we break below 1287, what would be the target for orange iii ?”
I don’t like to make any assumptions about where a wave may begin to calculate a target for it to end.
It’s hard enough calculating targets with a reasonable probability. Making assumptions about where they begin too… makes for a target with too little confidence and accuracy.
NZ is having an election today, although advance voting has been open for 2 weeks.
If Elliott wave theory is correct then we should have the incumbents re-elected. No change of the guard. Because the NZX is in a bull trend, and a strong one at that.
Social mood in action.
By the way, hope you enjoy your HK trip. Quite a change of scenery from the relaxed beach life! Hopefully gold will behave and start it’s next leg up while you’re on the road!
🙂 Thank you Dreamer
If you live in Paradise, as I do, and you want a change, then you go to a big city with a very different culture….
I have a good friend who is a HK native there so I’m sure I’ll have the best time ever.
So I am still in favor of the more bullish counts for Gold and GDX at this point.
Gold has retraced to the strong support zone of the April and June highs. A reversal up could be imminent. I like Lara’s new hourly option showing one more quick leg down from a triangle. We should know on Monday if this is probable or not.
The correction in GDX is getting deep and is very close to a strong support area. If the more bullish DZZ count is correct, GDX should bottom on Monday or Tuesday. If it goes below 22.53, I’ll probably switch my main view back to the more bearish triangle count.
The 50 and 200MA’s are still in bullish alignment for both Gold and GDX.
https://www.tradingview.com/x/mzhPir8h/
Maria, this detailed article about the Fed starting QT (quantitative tightening) looks like a pretty good answer to your question from the last sessions comments section. It’s a boring read, but I think it makes a lot of sense.
I don’t think you can say for sure what will happen to gold, but I think overall the Feds action will prove to be negative for the stock market and mostly positive for gold.
I think Lara is expecting the stock market to put in a major top sometime next year. For reference, I’ll repost a chart I posted here a long time ago showing the last major top in the SPX in 2007. Gold topped 5 months after the SPX topped. Will that repeat? Maybe.
http://www.zealllc.com/2017/fedqtsgi.htm
I’m expecting the final high for the stock market in one year minimum. It could even be longer, 2-3 years away.
Thank you Lara
thank you for your reply And also for your charts, Dreamer. They have been very helpful to me in my learning process.
🙂