
Price has moved strongly higher breaking out of the channel which contained prior downwards movement.
Summary: Gold has most likely had a trend change. The target for upwards movement is either about 1,330 (second wave count) or possibly as high as 1,440 (first wave count).
Always trade with stops and invest only 1-5% of equity on any one trade.
New updates to this analysis are in bold.
Last monthly charts for the main wave count are here, another monthly alternate is here, and video is here.
Grand SuperCycle analysis is here.
The wave counts will be labelled first and second. Classic technical analysis will be used to determine which wave count looks to be more likely.
FIRST ELLIOTT WAVE COUNT
WEEKLY CHART
Click chart to enlarge.
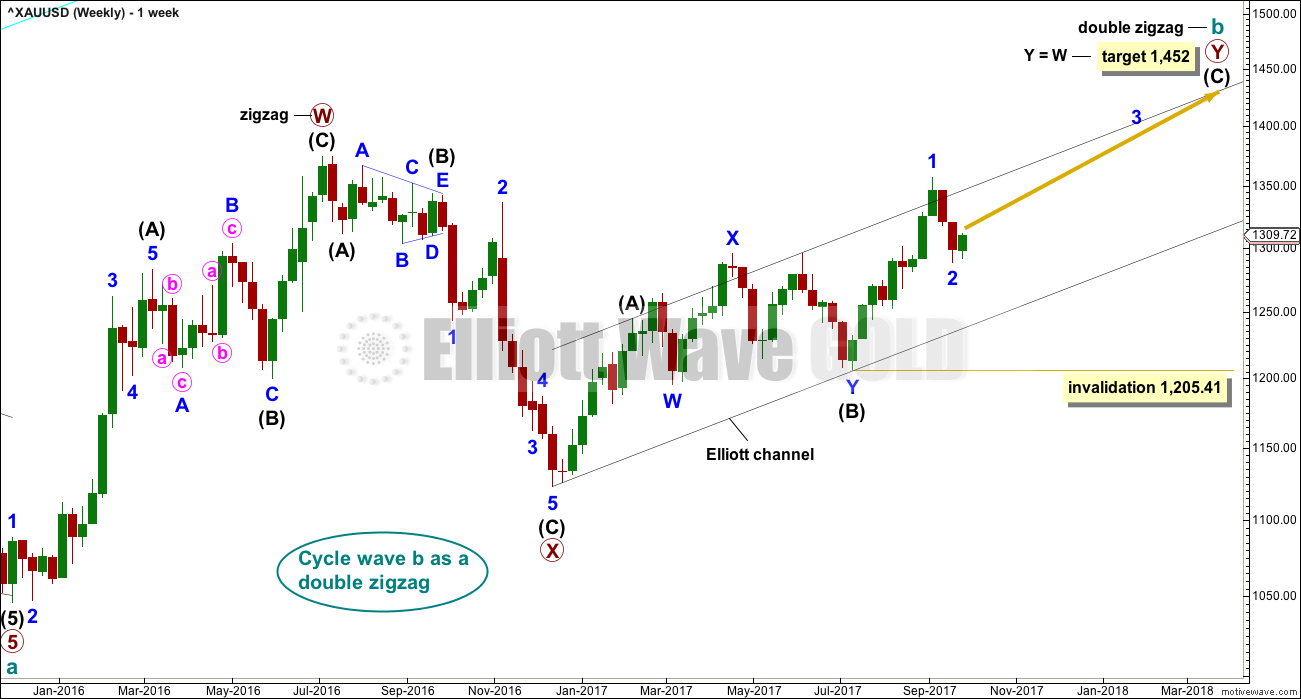
There are more than 23 possible corrective structures that B waves may take, and although cycle wave b still fits well at this stage as a triangle, it may still be another structure. This wave count looks at the possibility that it may be a double zigzag.
If cycle wave b is a double zigzag, then current upwards movement may be part of the second zigzag in the double, labelled primary wave Y.
The target remains the same.
Within intermediate wave (C), no second wave correction may move beyond the start of its first wave below 1,205.41. However, prior to invalidation, this wave count may be discarded if price breaks below the lower edge of the black Elliott channel. If this wave count is correct, then intermediate wave (C) should not break below the Elliott channel which contains the zigzag of primary wave Y upwards.
There are two problems with this wave count which reduce its probability in terms of Elliott wave:
1. Cycle wave b is a double zigzag, but primary wave X within the double is deep and time consuming. While this is possible, it is much more common for X waves within double zigzags to be brief and shallow.
2. Intermediate wave (B) within the zigzag of primary wave Y is a double flat correction. These are extremely rare, even rarer than running flats. The rarity of this structure must further reduce the probability of this wave count.
DAILY CHART
Click chart to enlarge.
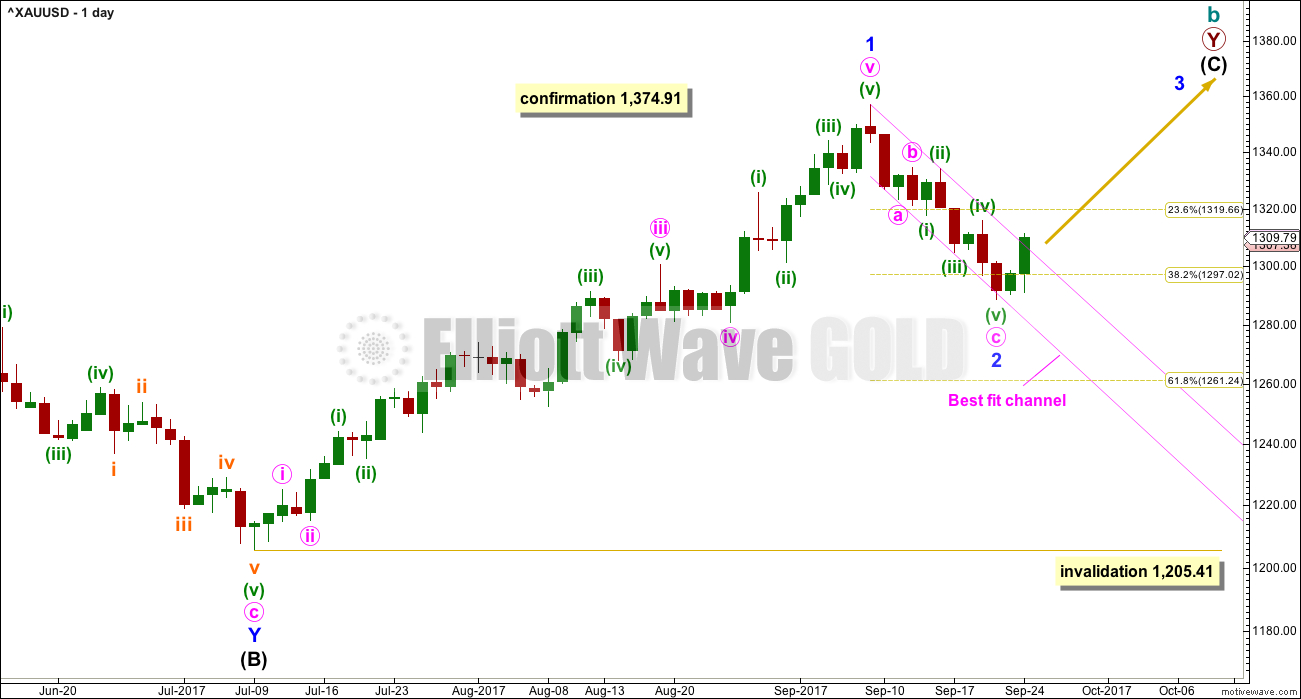
The analysis will focus on the structure of intermediate wave (C). To see details of all the bull movement for this year see daily charts here.
Intermediate wave (C) must be a five wave structure, either an impulse or an ending diagonal. It is unfolding as the more common impulse.
It is possible that minor wave 1 may have been over at the last high and the current pullback may be minor wave 2. Minor wave 2 may not move beyond the start of minor wave 1 below 1,205.41.
Today, with price closing above the upper edge of the channel which contains minor wave 2, it looks like minor wave 2 may be over. If tomorrow prints a full daily candlestick above and not touching the upper edge of the channel, then a trend change would be confirmed.
However, it is also possible to move the degree of labelling within minor wave 2 all down one degree. The zigzag downwards may be only minute wave a of a flat correction for minor wave 2, or the first zigzag in a double zigzag to move price lower.
If minor wave 2 is over, it would have lasted only 9 sessions to the 44 sessions of minor wave 1. The possibility that minor wave 2 could continue further must be acknowledged and this risk must be managed.
HOURLY CHART
Click chart to enlarge.
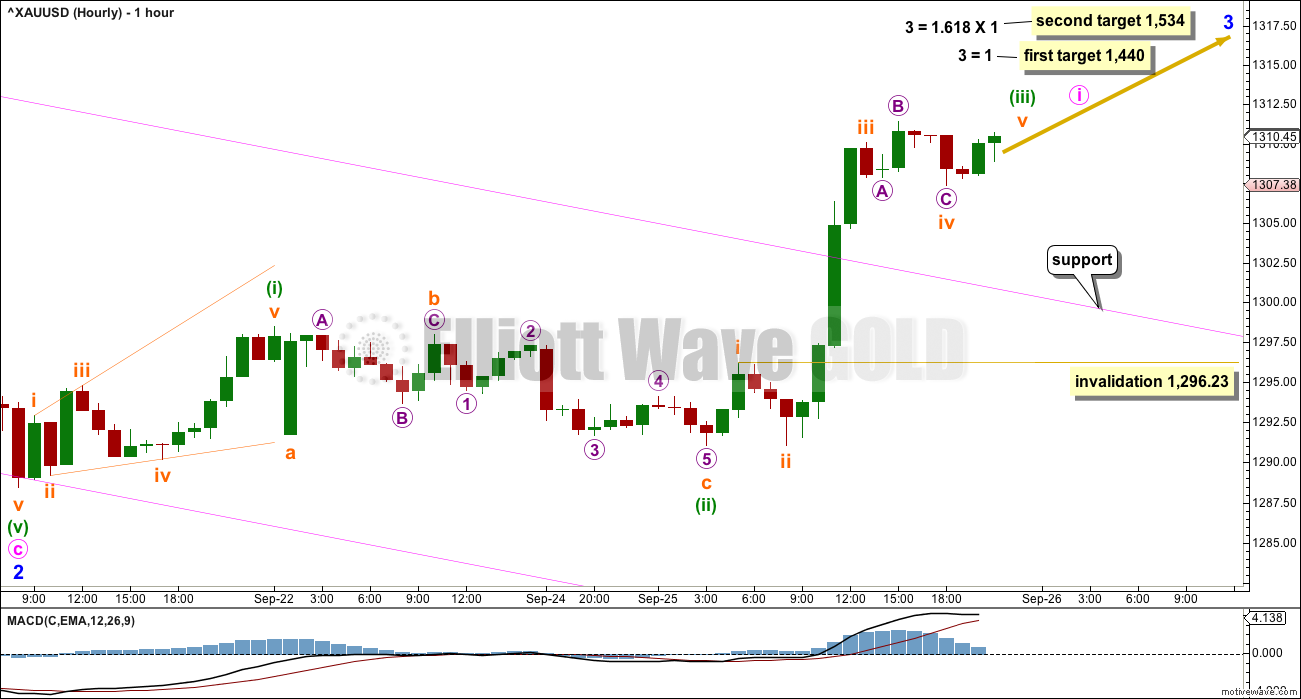
If minor wave 2 is over at the last low, then minor wave 3 upwards may have begun. Two possible targets are calculated.
Minor wave 3 must subdivide as an impulse. Minute wave i within that impulse may be incomplete.
Within minute wave i, minuette waves (i) through to (iii) may be almost complete.
Minuette wave (iii) must subdivide as an impulse. Within minuette wave (iii), subminuette wave iv may not move into subminuette wave i price territory below 1,286.23.
When minute wave i is a complete impulse, then minute wave ii may be expected to be deep; the first second wave of a new trend for Gold is often very deep, so minute wave ii may find support to back test the upper edge of the pink best fit channel.
ALTERNATE HOURLY CHART
Click chart to enlarge.
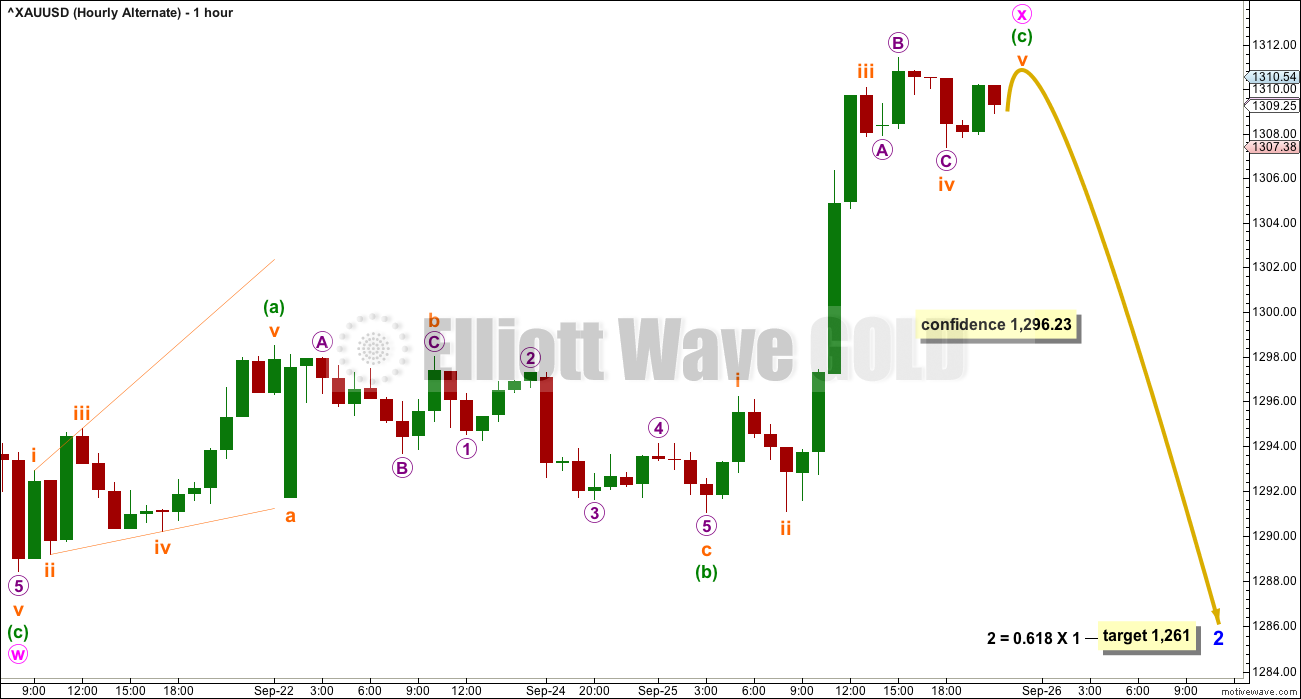
This wave count simply moves the degree of labelling within the last wave down one degree. The structure may have been only minute wave w as the first zigzag in a deeper double zigzag for minor wave 2.
This alternate wave count would expect minor wave 2 to now continue for another week or two.
When the first zigzag in a correction has not moved price deep enough, then a second zigzag should be considered. Here, the first zigzag of minute wave w is only a 0.45 length of minor wave 1. Second wave corrections are usually deeper than this.
Some confidence may be had in this wave count if price makes a new low below 1,296.23.
X waves within double zigzags are commonly brief and shallow.
SECOND ELLIOTT WAVE COUNT
WEEKLY CHART
Click chart to enlarge.
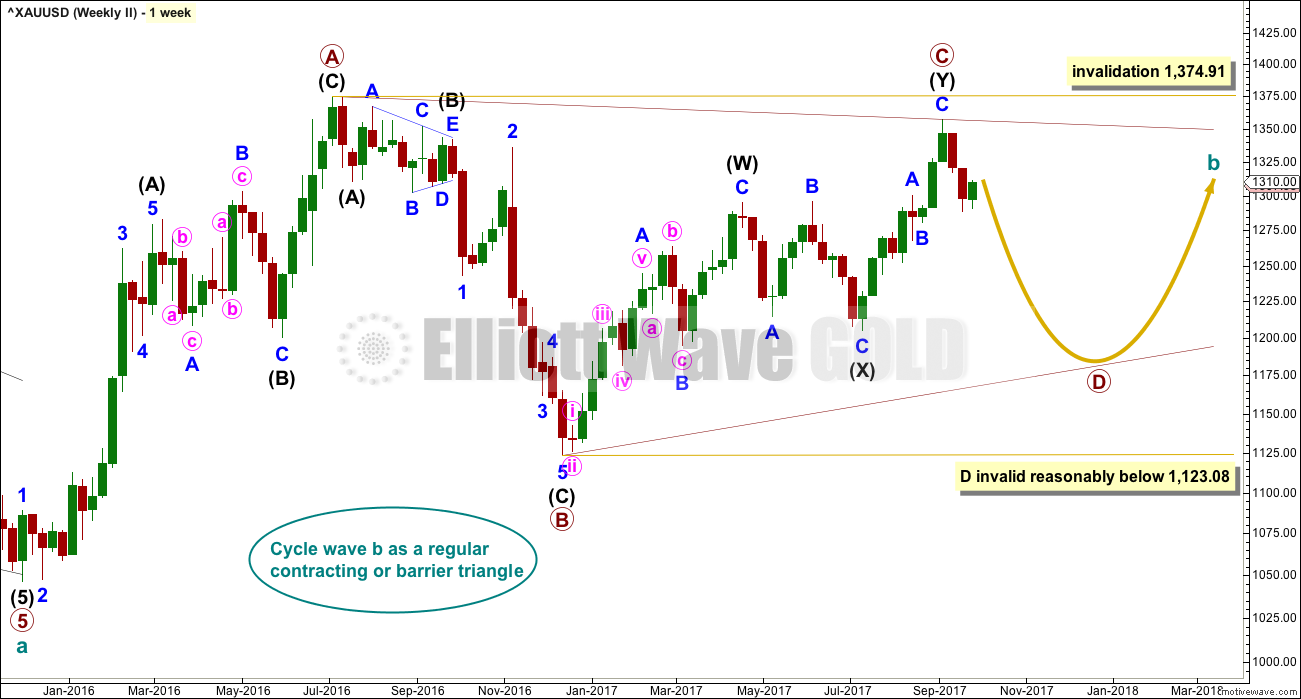
It is still possible that cycle wave b is unfolding as a regular contracting triangle.
Within a triangle, one sub-wave should be a more complicated multiple, which may be primary wave C. This is the most common sub-wave of the triangle to subdivide into a multiple.
Intermediate wave (Y) now looks like a complete zigzag at the weekly chart level.
Primary wave D of a contracting triangle may not move beyond the end of primary wave B below 1,123.08. Contracting triangles are the most common variety.
Primary wave D of a barrier triangle should end about the same level as primary wave B at 1,123.08, so that the B-D trend line remains essentially flat. This involves some subjectivity; price may move slightly below 1,123.08 and the triangle wave count may remain valid. This is the only Elliott wave rule which is not black and white.
Finally, primary wave E of a contracting or barrier triangle may not move beyond the end of primary wave C above 1,295.65. Primary wave E would most likely fall short of the A-C trend line. But if it does not end there, then it can slightly overshoot that trend line.
Primary wave A lasted 31 weeks, primary wave B lasted 23 weeks, and primary wave C lasted 38 weeks.
The A-C trend line now has too weak a slope. At this stage, this is now a problem for this wave count, the upper A-C trend line no longer has such a typical look.
DAILY CHART

Click chart to enlarge.
This second wave count expects the new wave down may be deeper and longer lasting than the first wave count allows for.
The blue base channel on this second wave count is drawn in exactly the same way as the pink Elliott channel on the first daily chart. For this second wave count the middle of minor wave 3 should have the power to break below support at the lower edge of the base channel. If price does behave like this, it would offer support for this second wave count over the first wave count.
A common length for triangle sub-waves is from 0.8 to 0.85 the length of the prior wave. Primary wave D would reach this range from 1,170 to 1,158.
If primary wave C is correctly labelled as a double zigzag, then primary wave D must be a single zigzag.
HOURLY CHART
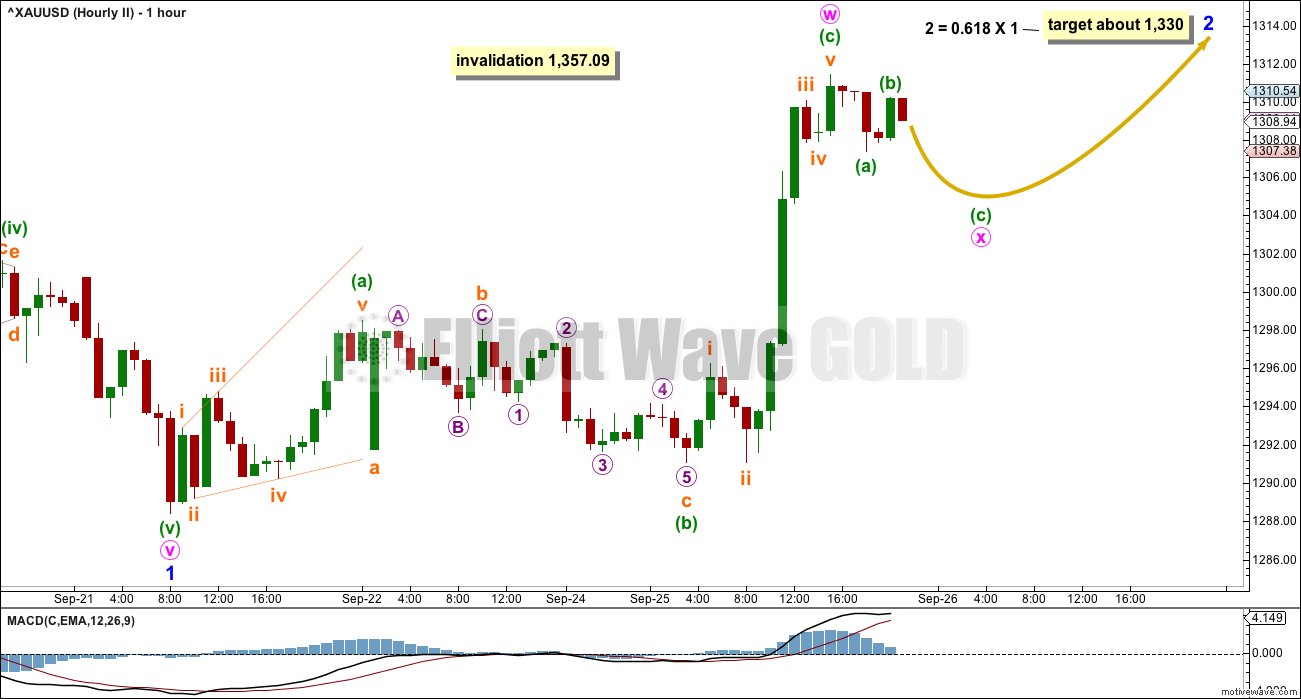
Click chart to enlarge.
This wave count now sees the last wave down differently to the first wave count. This wave count sees a possible five down complete. Subdivisions within it are labelled at the daily chart level.
If the trend is down, then a five down labelled minor wave 1 may be complete. Now a bounce may be unfolding as a three wave structure for minor wave 2.
Minor wave 2 would be too brief and shallow, for this wave count, if it was over at today’s high. That may be only minute wave w of a double zigzag for minor wave 2.
The target for this bounce to end is about 1,330.
TECHNICAL ANALYSIS
WEEKLY CHART
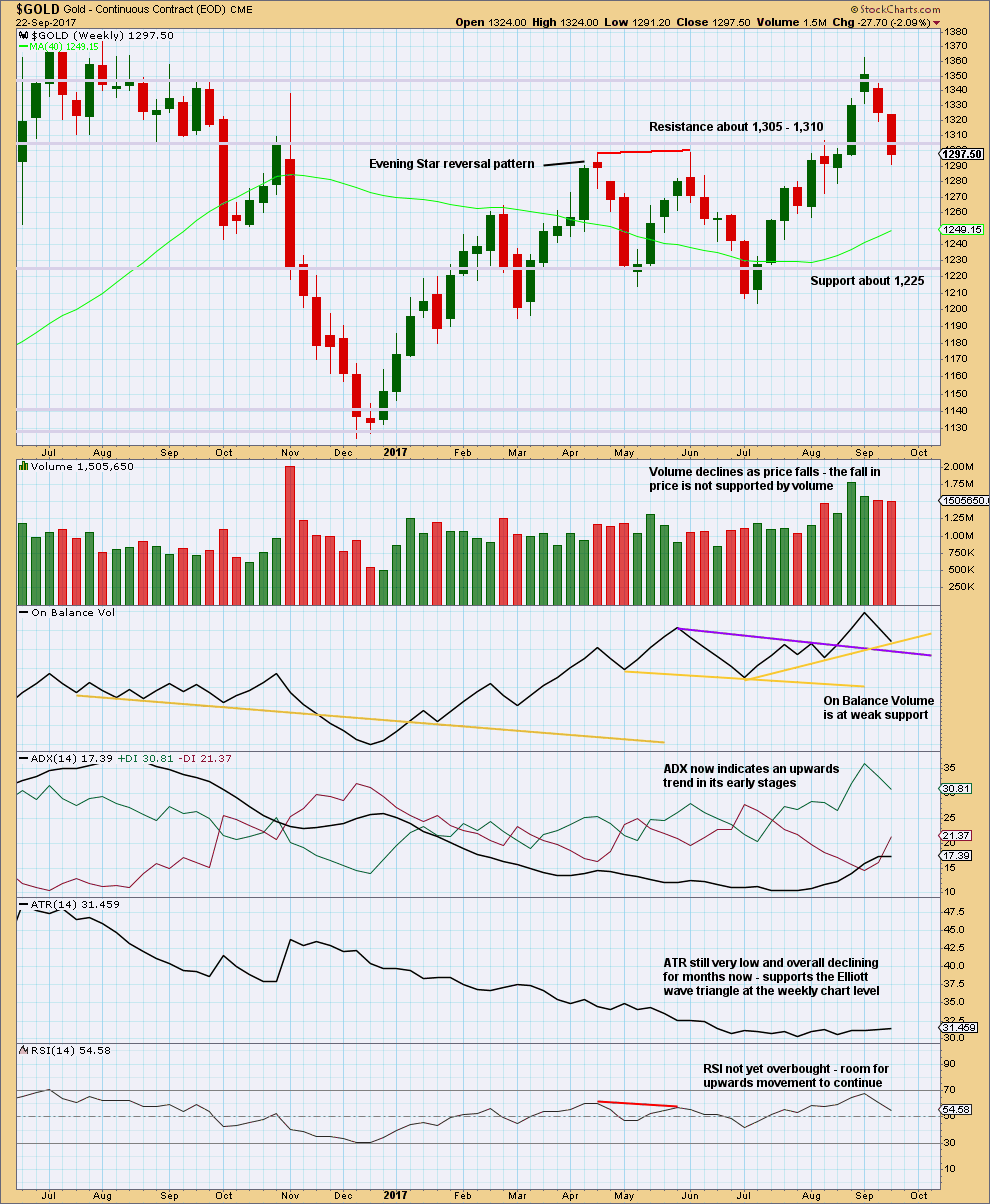
Click chart to enlarge. Chart courtesy of StockCharts.com.
Weak support here from On Balance Volume may halt the fall in price or initiate a small bounce. If On Balance Volume breaks below the support line this week, that would be a weak bullish signal.
Overall, this chart remains mostly bullish. At this stage, with downwards movement not being well supported by volume, it should be assumed to be a pullback within a larger trend until shown otherwise.
DAILY CHART
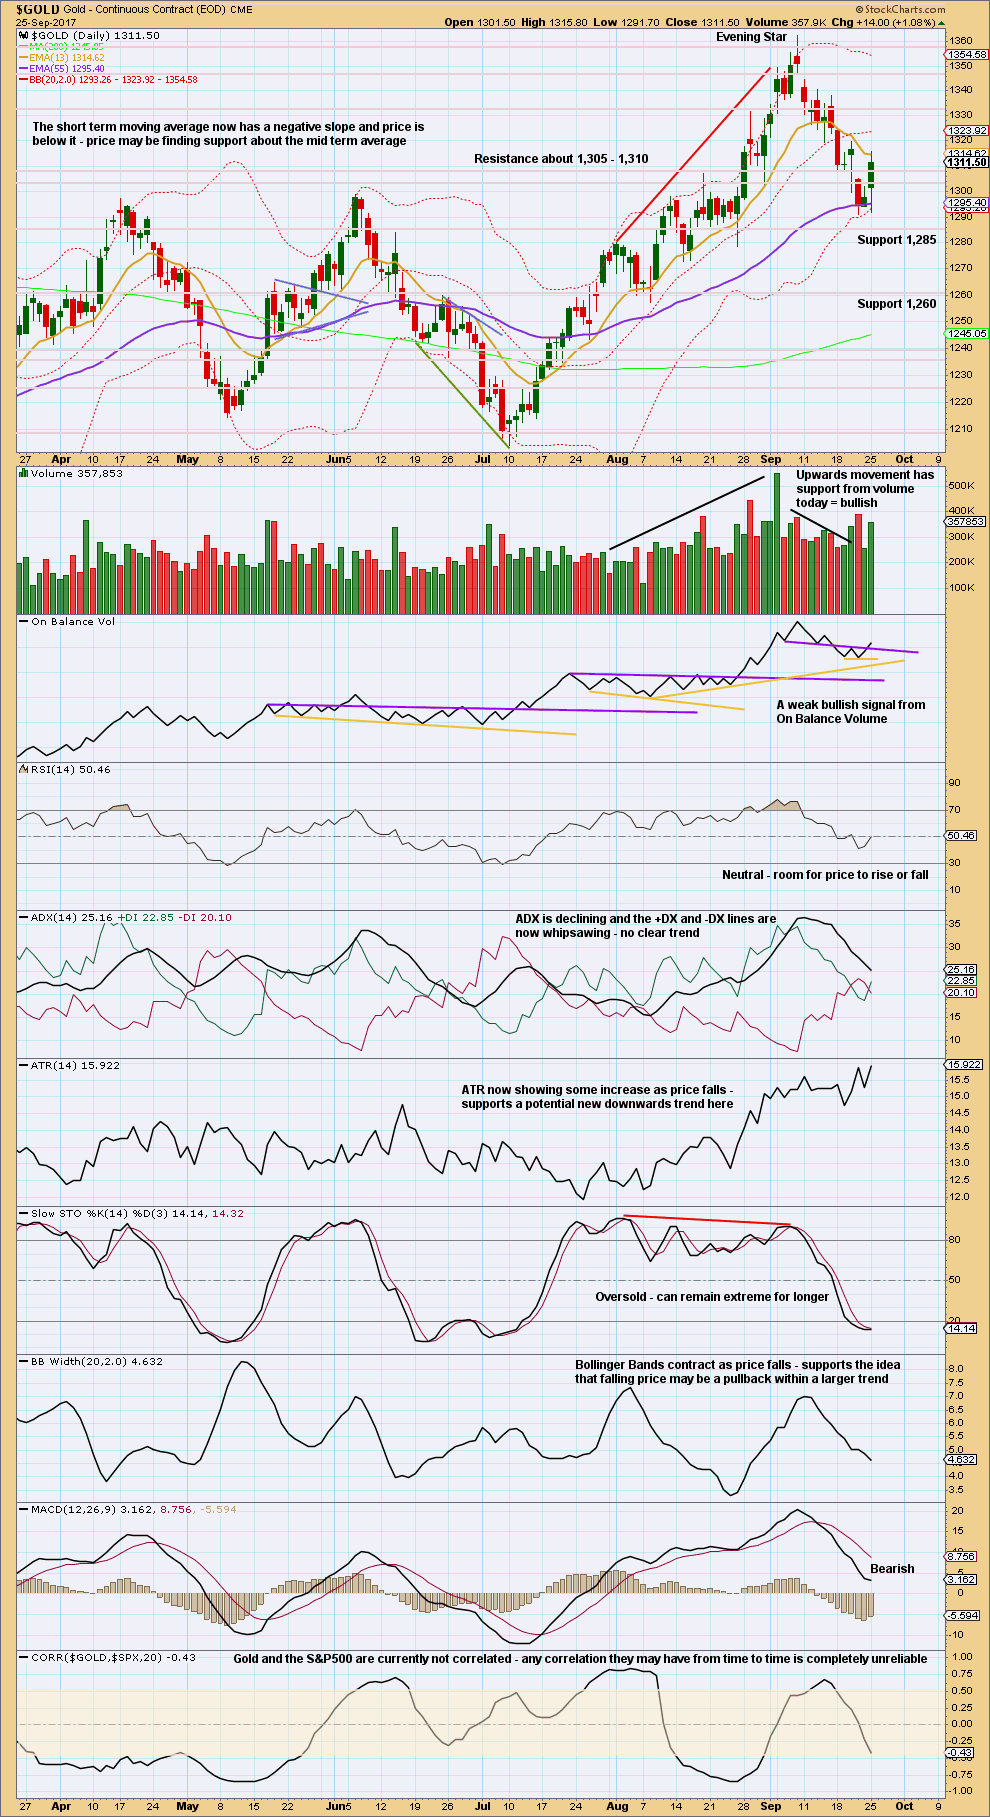
Click chart to enlarge. Chart courtesy of StockCharts.com.
A strong green daily candlestick has a long lower wick. This is bullish.
Give some reasonable weight to the bullish signal here from On Balance Volume. It supports the idea of more upwards movement here, but it can make now comment on how high price may go nor how long the trend may last.
Overall, this chart looks fairly bullish. Only MACD is bearish.
GDX
DAILY CHART
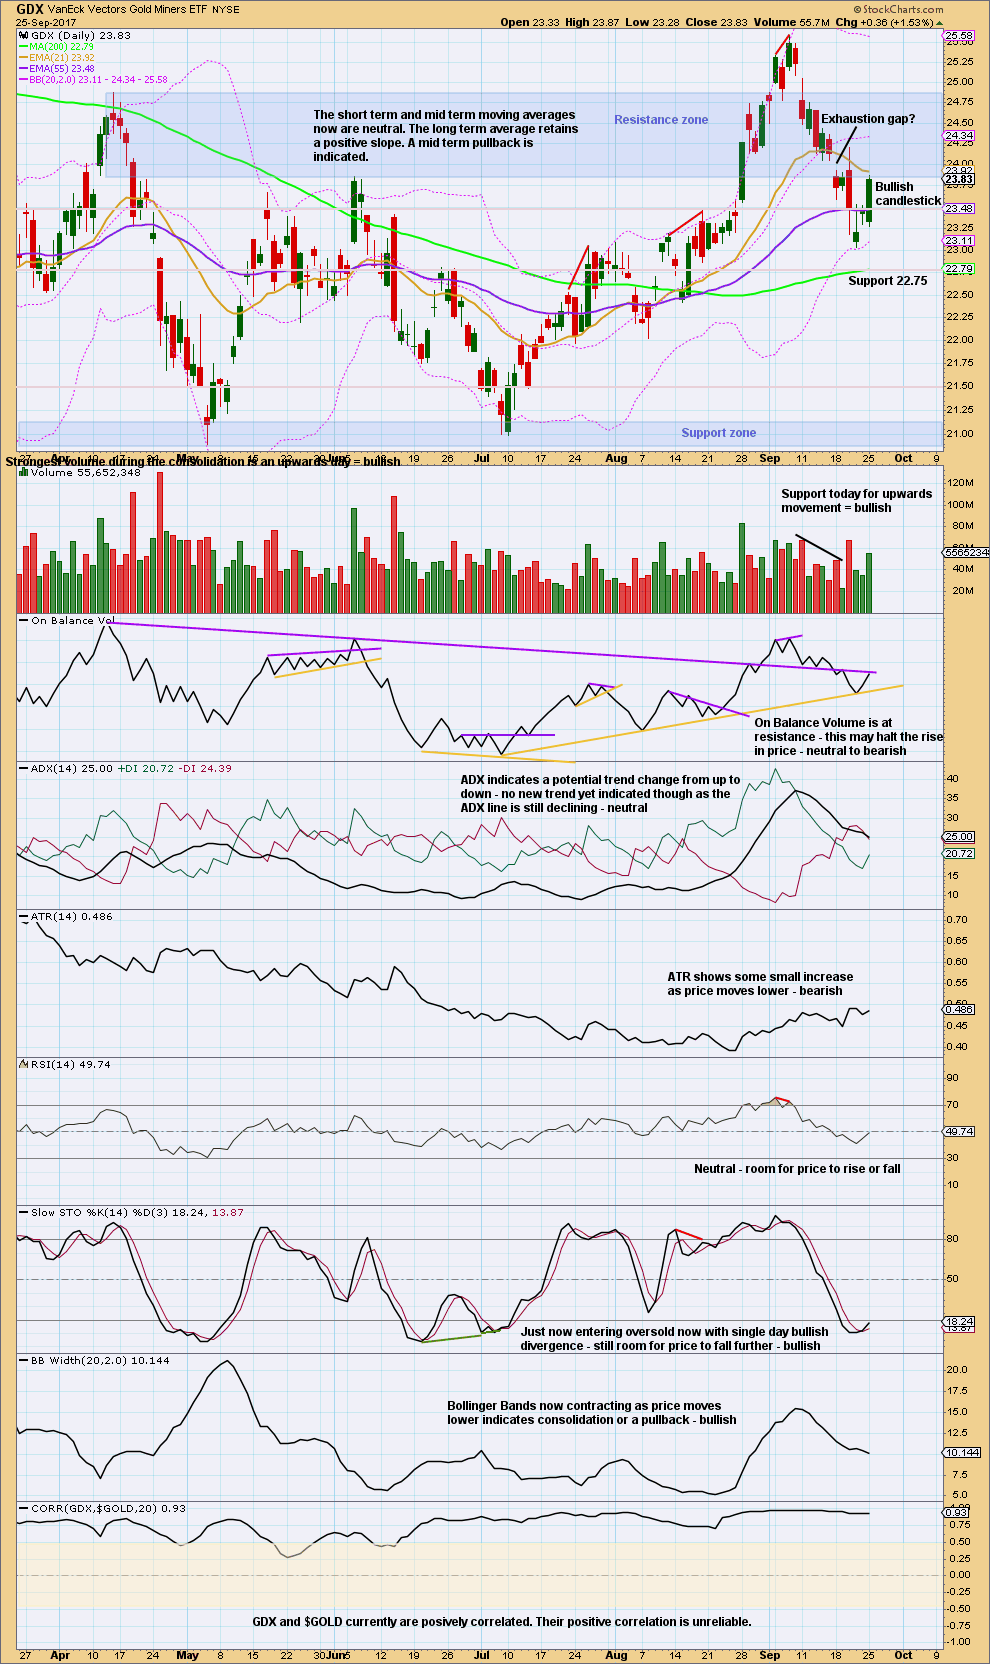
Click chart to enlarge. Chart courtesy of StockCharts.com.
A red candlestick was expected for Monday for GDX, mostly due to light volume for a small upwards day on Friday. But this is not what has happened. Now GDX has moved strongly higher.
With support from volume for upwards movement and a strong green candlestick, it looks now reasonable to expect some more upwards movement.
If On Balance Volume breaks above resistance tomorrow, that shall be a bullish signal. But first a reaction from resistance may be seen.
This chart is mixed, but it is more bullish than bearish.
Published @ 10:02 p.m. EST.
Updated alternate hourly chart, this will be the main wave count today.
From the last swing low on 21st September at 1,291.97 to yesterday’s high at 1,313.39, that upwards wave now looks like a completed three and not a continuing five.
With a five down and now a three up, the trend remains down.
Downwards movement in the last three hours has made a new low below 1,298.49. That’s the high I have labelled minuette (a) on this chart.
This means that downwards movement now can’t be a fourth wave correction of an ongoing impulse, because it’s now overlapping into what would be its counterpart first wave price territory.
Which means the upwards wave is a three and its complete.
Look for another 2 days or so down to the original target at 1,261.
Thanks for update. Provides clarity before market close.
You’re welcome Daniel 🙂
Updated daily chart:
A new low below 1,296.23 has invalidated the main hourly chart and confirmed the alternate. Minor 2 is not done and would most likely continue as a double zigzag to deepen the correction to a more normal 0.618 Fibonacci ratio.
My summary was wrong 🙁 The alternate is the correct count.
calculate with fourth wave u got gud result n gud support resistance levels lara mam my request please once try if it is fourth wave then wat the next thank u
I really have no idea what you are asking.
But I expect that the charts above may answer your questions.
I almost always come into comments in the afternoon of the NY session to answer questions and update charts.
lara once chek gold
3 wave correction off high testing 1300 level and down trendline recently breached. Also near .618 retracement. Should be up from here unless last top was x wave for double zig-zag. Would not like to see a new low below trendline for the bullish case.
Looks like minor 2 not done.
Trying to resolve downward movement since yesterday’s high. ? double zig-zag for very deep second wave correction. On hourly does not look like 5 wave down yet as what appears to be a third wave is shorter than first and fifth, so unless we are getting into extended third wave down, with now 3 successive 1 and second waves. So unless there is a significant pick up in momentum to downside, this may simply have been a deep correction of yesterday’s up move.
i think lara gold good to sell stop losss 1330 n go sell this is fourth wave please once chek
Stops for shorts can now be set just above yesterday’s high at 1,313.39.