
Upwards movement continues as the main Elliott wave count expects.
Price today bounced up perfectly from the upper edge of the base channel. This gives us an important clue as to what should happen next.
Summary: An upwards breakout has support from volume. Look out for very strong upwards movement in upcoming weeks to a target at 1,452. In the short term, corrections may now find support at the upper edge of the base channel.
Corrections are an opportunity to join the trend. Stops should always be used; set now just below prior support about 1,305 would allow the market room to move. Manage risk by investing only 1-5% of equity on any one trade.
New updates to this analysis are in bold.
Last monthly charts for the main wave count are here, another monthly alternate is here, and video is here.
Grand SuperCycle analysis is here.
MAIN ELLIOTT WAVE COUNT
WEEKLY CHART
Click chart to enlarge.
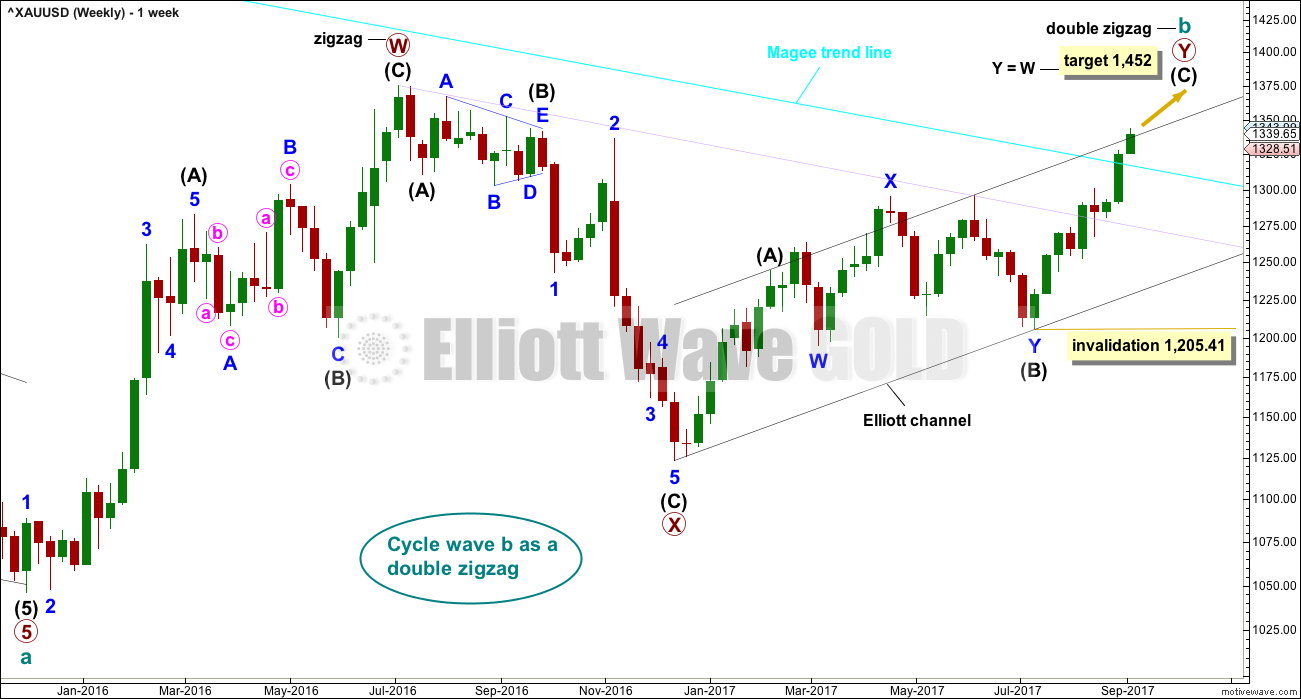
There is strong support from classic technical analysis for this wave count. Now that price has fully broken above the Magee trend line and has broken out above a consolidation zone, with support from volume, this wave count will now be the main wave count.
There are more than 23 possible corrective structures that B waves may take, and although cycle wave b still fits best at this stage as a triangle, it may still be another structure. This wave count looks at the possibility that it may be a double zigzag.
If cycle wave b is a double zigzag, then current upwards movement may be part of the second zigzag in the double, labelled primary wave Y.
The target remains the same.
Within intermediate wave (C), no second wave correction may move beyond the start of its first wave below 1,205.41.
There are two problems with this wave count which reduce its probability in terms of Elliott wave:
1. Cycle wave b is a double zigzag, but primary wave X within the double is deep and time consuming. While this is possible, it is much more common for X waves within double zigzags to be brief and shallow.
2. Intermediate wave (B) within the zigzag of primary wave Y is a double flat correction. These are extremely rare, even rarer than running flats. The rarity of this structure must further reduce the probability of this wave count.
Although this wave count still has these problems, technical analysis now points to it being more likely. The alternate will continue to be considered until price invalidates it.
DAILY CHART
Click chart to enlarge.
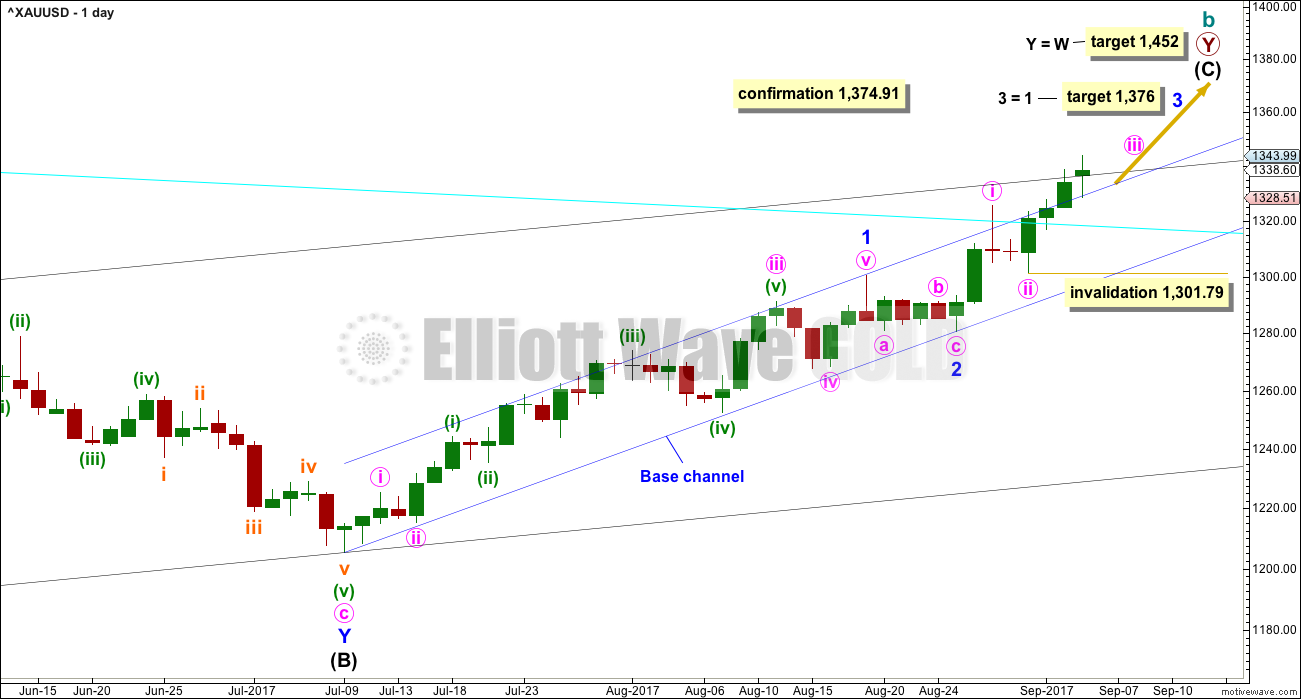
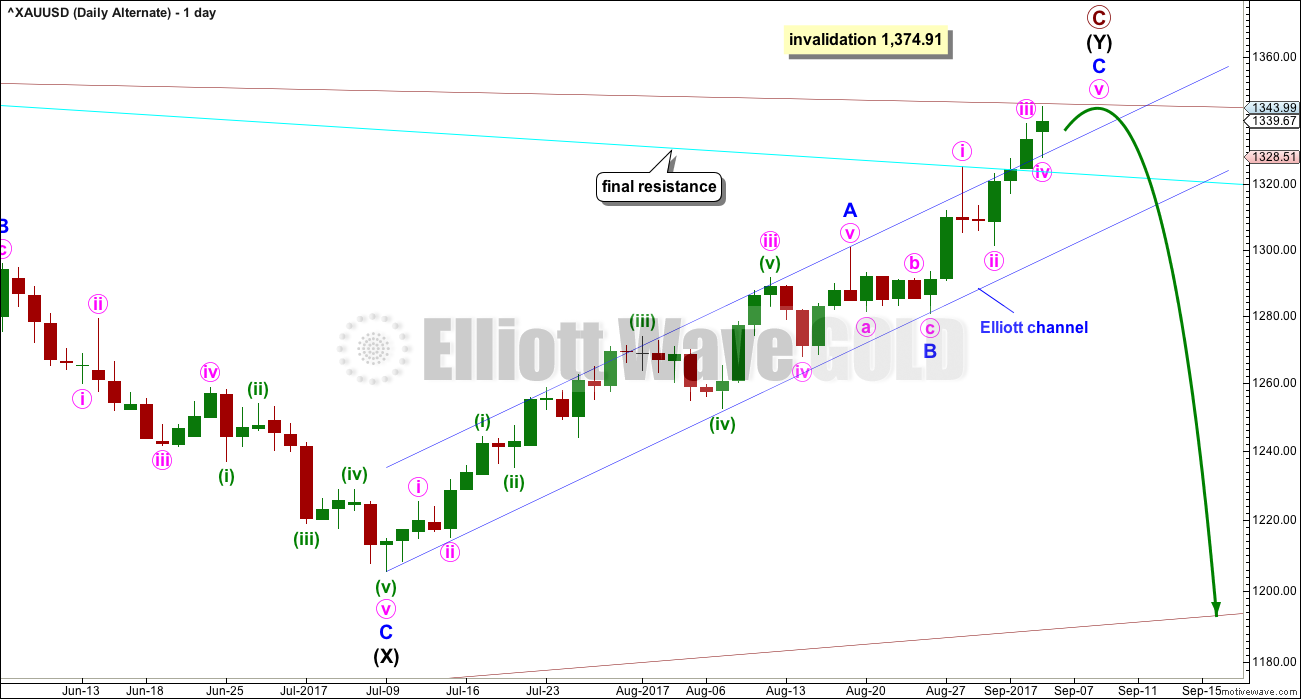
Intermediate wave (C) may be unfolding as an impulse.
Within the impulse, minor waves 1 and 2 would now be complete.
Minor wave 2 may have ended as a relatively brief shallow second wave. It is unusual for second wave corrections to be this shallow.
With minor wave 1 a very long extension, the Fibonacci ratio of equality is used for a target for minor wave 3 now.
Price has been doing some work here to overcome resistance. First resistance at the cyan Magee trend line, then resistance at the upper edge of the dark blue base channel, and resistance again now about the upper edge of the black Elliott channel copied over from the weekly chart. It may be that once this resistance is overcome the middle of this third wave may proceed with strength.
Today’s candlestick is above the base channel. This adds some confidence to a third wave. This is how third waves should behave.
Within minute wave iii, no second wave correction may move beyond its start below 1,301.79.
HOURLY CHART
Click chart to enlarge.
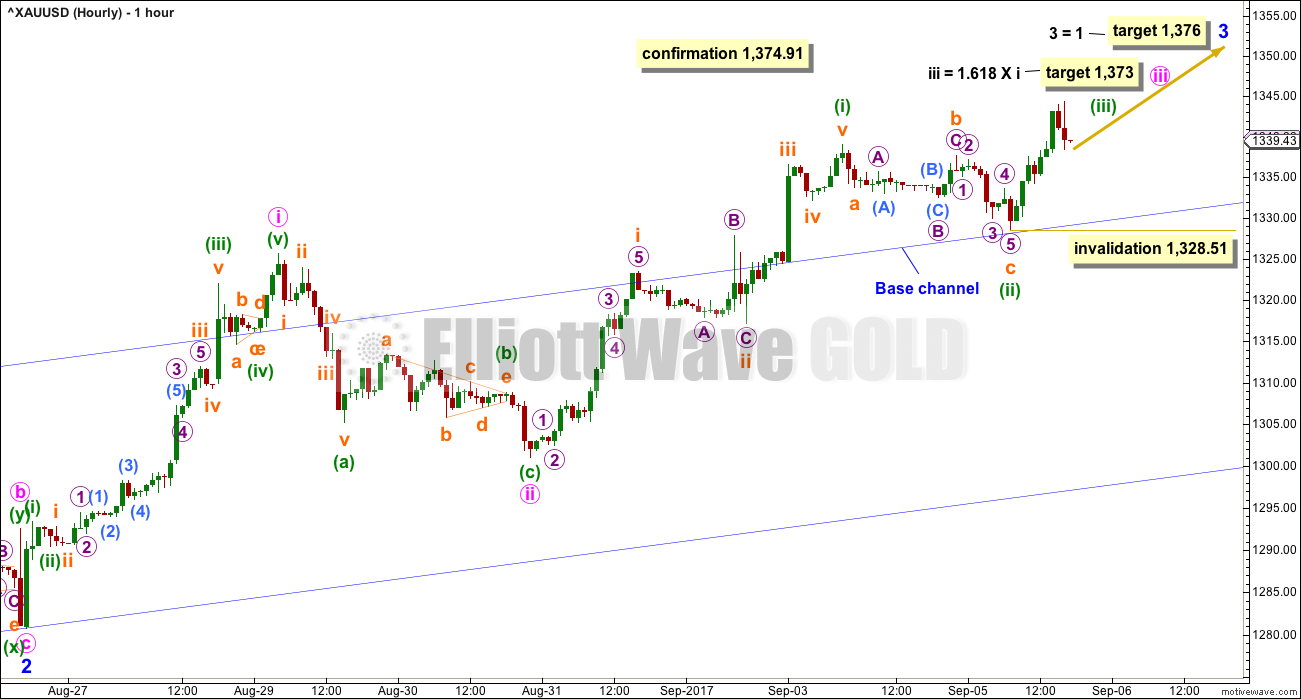
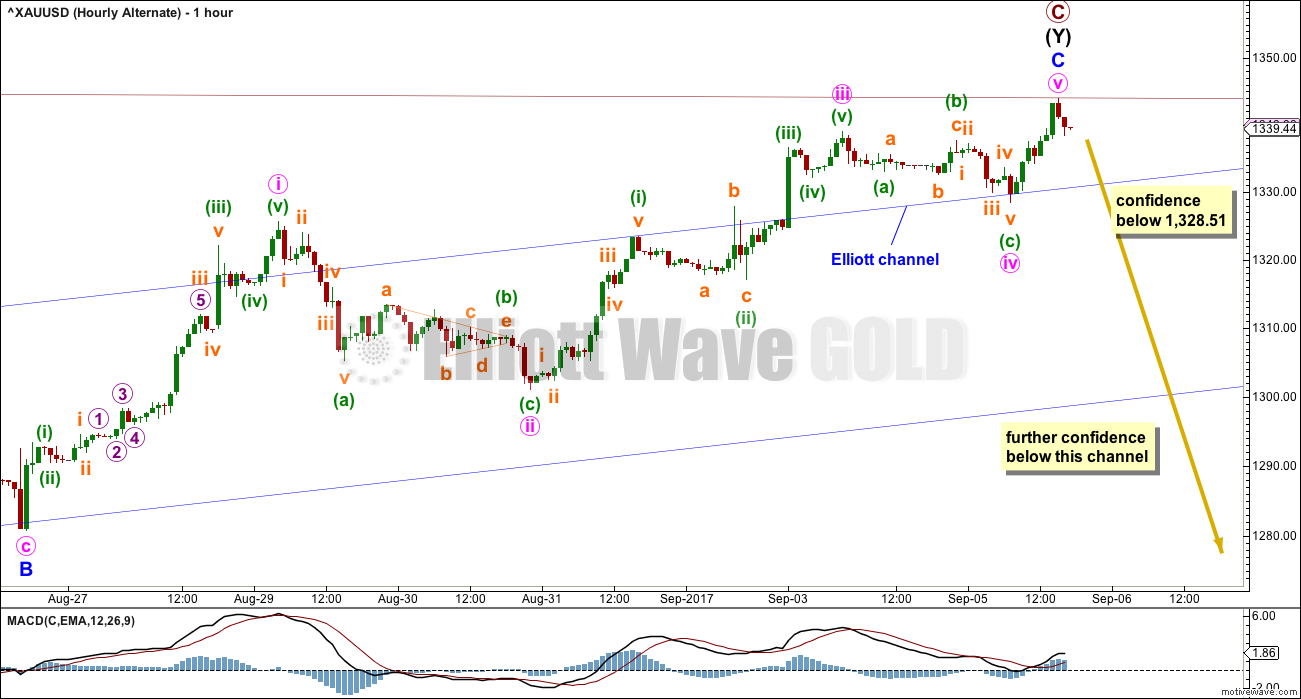
Today’s hourly chart will show all movement from the low labelled minor wave 2.
Price is now above the upper edge of the base channel; the upper edge of this channel perfectly showed where price found support during the last session. If this wave count is correct, and if a third wave up is unfolding, then further corrections should also find support at this trend line if they are deep.
However, if this wave count is correct, then corrections may now begin to be more brief and shallow, price may move strongly higher, and indicators may become more extreme.
Gold has a very common tendency to exhibit swift and strong fifth waves, typical of commodities. This tendency is especially prevalent for fifth waves to end its third wave impulses. Look out for a very strong fifth wave possibly for minute wave v to end minor wave 3.
So far intermediate wave (C) has lasted 41 sessions. If it exhibits a Fibonacci duration, it may now continue for a further 14 sessions to total a Fibonacci 55. Several of those sessions should be for a correction for minor wave 4, which may relieve overbought conditions. But first, minor wave 3 needs to complete. It is not yet complete. It may end in a few more days.
Within minuette wave (iii), no second wave correction may move beyond the start of its first wave below 1,328.51.
ALTERNATE ELLIOTT WAVE COUNT
WEEKLY CHART
Click chart to enlarge.
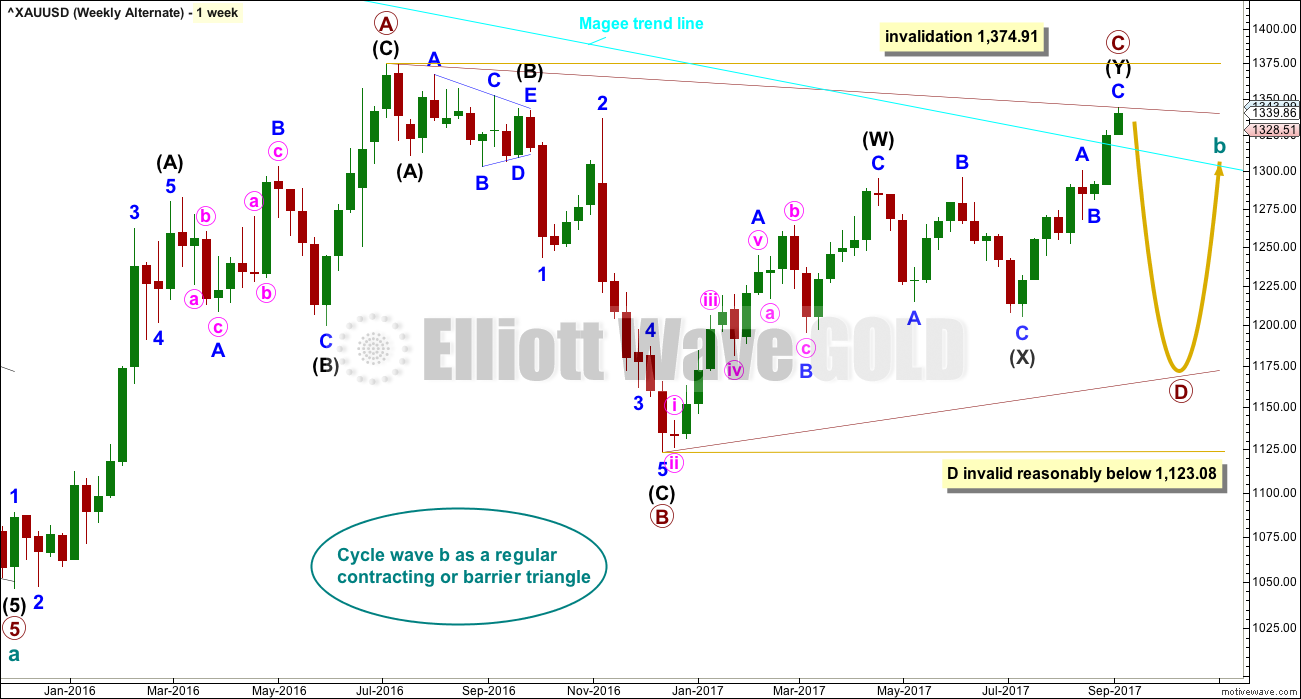
Price has breached the Magee trend line. This is now an alternate wave count. It remains valid, but classic technical analysis points to it now having a lower probability.
The Magee bear market trend line is drawn from the all time high for Gold on the 6th of September, 2011, to the first major swing high within the following bear market on the 5th of October, 2012.
To use this trend line in the way Magee describes, we should assume that price will find resistance at the line if it gets back up there. Now that the line is breached (by at least one or two full daily candlesticks above it), it is signalling a major trend change from bear to bull.
At this stage, a triangle still looks possible and has the best fit for cycle wave b. It has strong support from declining ATR and MACD hovering about zero at the weekly chart level.
Within a triangle, one sub-wave should be a more complicated multiple, which may be primary wave C. This is the most common sub-wave of the triangle to subdivide into a multiple.
Intermediate wave (Y) now looks like a developing zigzag at the weekly chart level, and minor wave B within it shows up with one red weekly candlestick.
Primary wave D of a contracting triangle may not move beyond the end of primary wave B below 1,123.08. Contracting triangles are the most common variety.
Primary wave D of a barrier triangle should end about the same level as primary wave B at 1,123.08, so that the B-D trend line remains essentially flat. This involves some subjectivity; price may move slightly below 1,123.08 and the triangle wave count may remain valid. This is the only Elliott wave rule which is not black and white.
Finally, primary wave E of a contracting or barrier triangle may not move beyond the end of primary wave C above 1,295.65. Primary wave E would most likely fall short of the A-C trend line. But if it does not end there, then it can slightly overshoot that trend line.
Primary wave A lasted 31 weeks, primary wave B lasted 23 weeks, and primary wave C started its 38th week. A double zigzag may be expected to be longer lasting than single zigzags within a triangle, and so this continuation of primary wave C is entirely acceptable and leaves the wave count with the right look at this time frame.
DAILY CHART
Click chart to enlarge.
The cyan Magee trend line has now been breached. This must reduce the probability of this wave count.
A breach of the blue Elliott channel by downwards movement would indicate a trend change.
The structure of minor wave C may now be close to completion. It could be over in just one more high.
HOURLY CHART
Click chart to enlarge.
This hourly chart shows the same piece of movement as the hourly chart for the main wave count.
It is now possible today that primary wave C could be over here or very soon.
For the short term, this wave count fits reasonably well with MACD. Minute wave iii is weaker than minute wave i, and minute wave v is the weakest. The strongest portion of the histogram is within the third wave.
If price moves lower and breaks back into the blue Elliott channel (which is exactly the same as the base channel on the main hourly chart), then this wave count should be considered. It would be possible a high is in place.
TECHNICAL ANALYSIS
WEEKLY CHART
Click chart to enlarge. Chart courtesy of StockCharts.com.
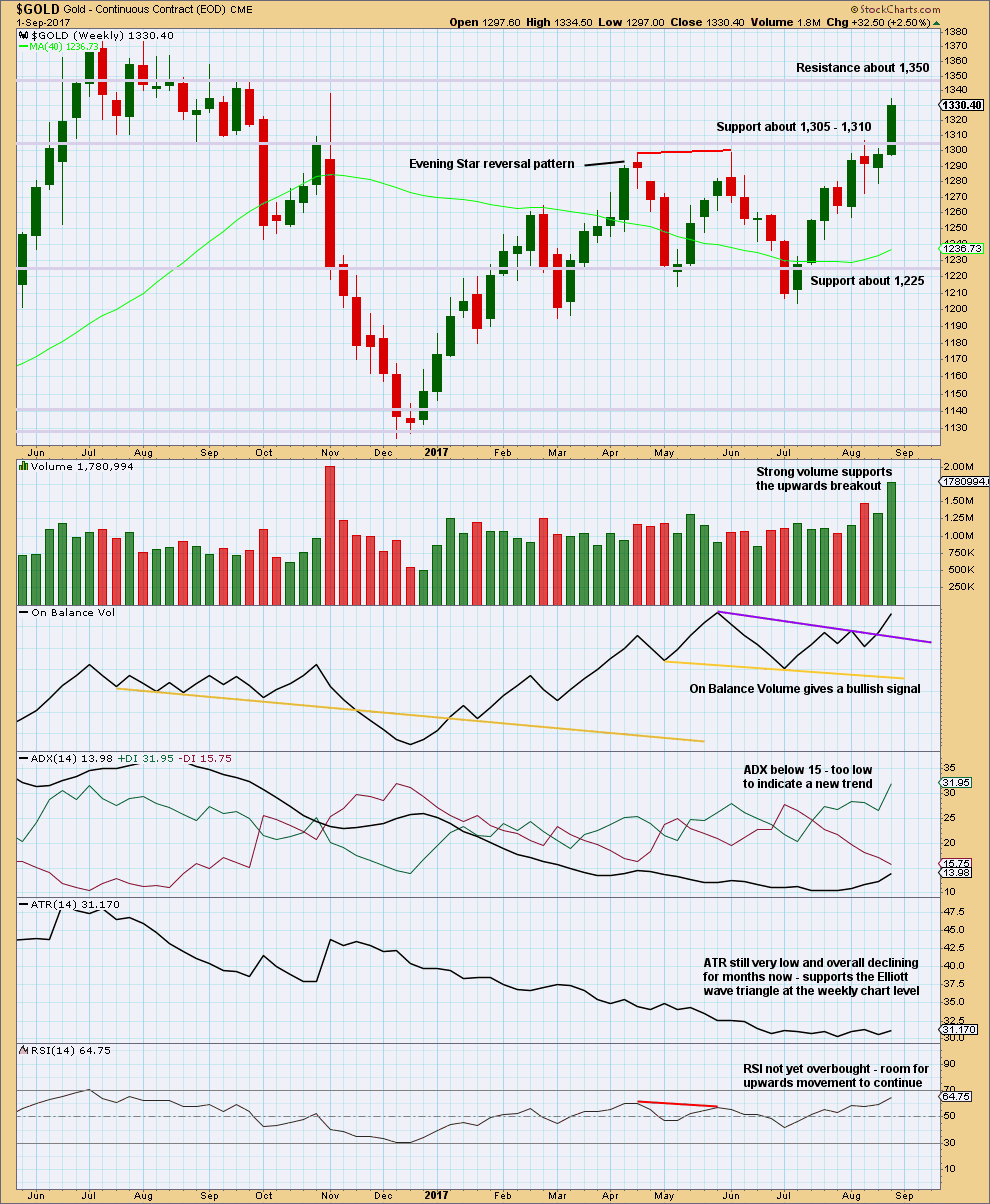
Price has closed last week above the consolidation zone, which began back in February this year. The close above resistance comes with a week of strong volume. This is a classic upwards breakout supported by volume.
It is very common after an upwards breakout to see price curve down to test support which was prior resistance. Look out for a pullback to find support now about 1,305 to 1,310. Thereafter, price should turn up and move strongly higher.
If price behaves like this, it would offer a good opportunity to join the trend at a good price. This does not always happen, but it happens much more often than it does not.
On Balance Volume gives a weak bullish signal. ADX continues to rise, but is not high enough yet to indicate an upwards trend. RSI indicates there is room still for price to rise.
DAILY CHART
Click chart to enlarge. Chart courtesy of StockCharts.com.
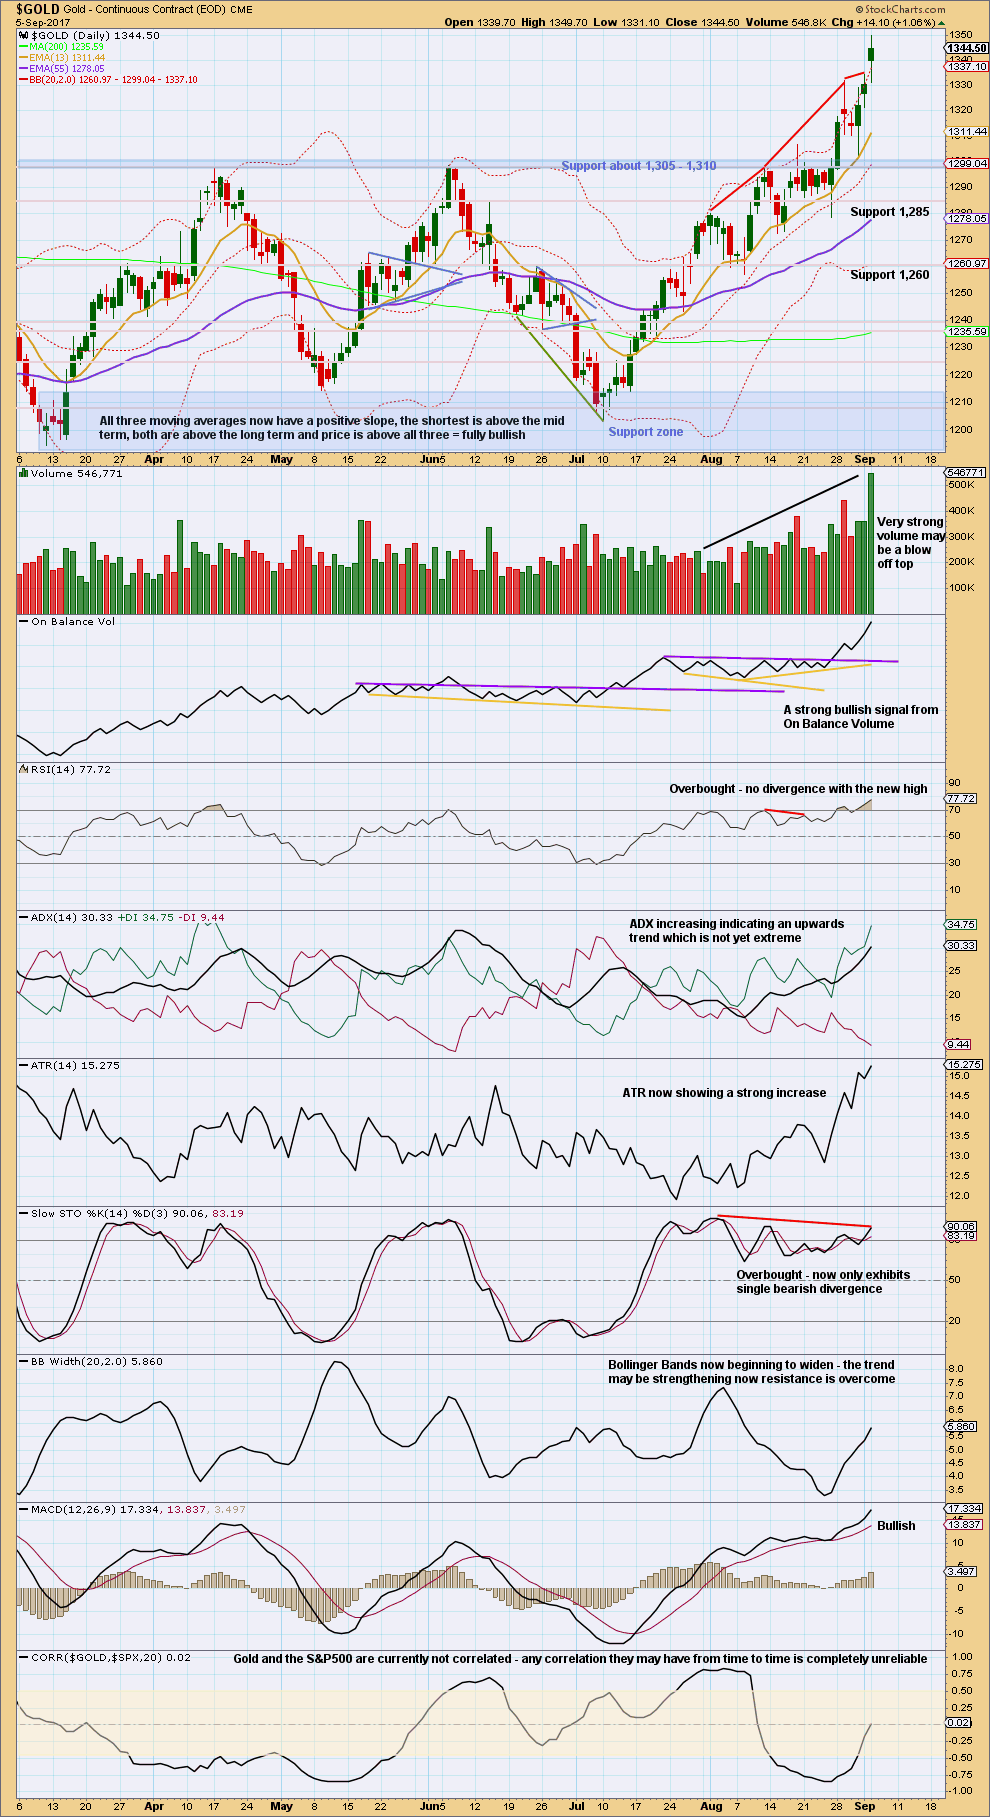
While very strong volume for this session supports a third wave, it also looks like it may be a blow off top because it is so strong. To find a day with stronger volume we have to go back to November 2016.
Look out for a small correction which may last a few days to possibly follow this session.
While RSI and Stochastics are overbought, they can remain so for a reasonable period of time when Gold has a third wave. Look at the example provided below. With no divergence between price and RSI at this time, we should expect that overall the upwards trend should continue.
GDX
DAILY CHART
Click chart to enlarge. Chart courtesy of StockCharts.com.
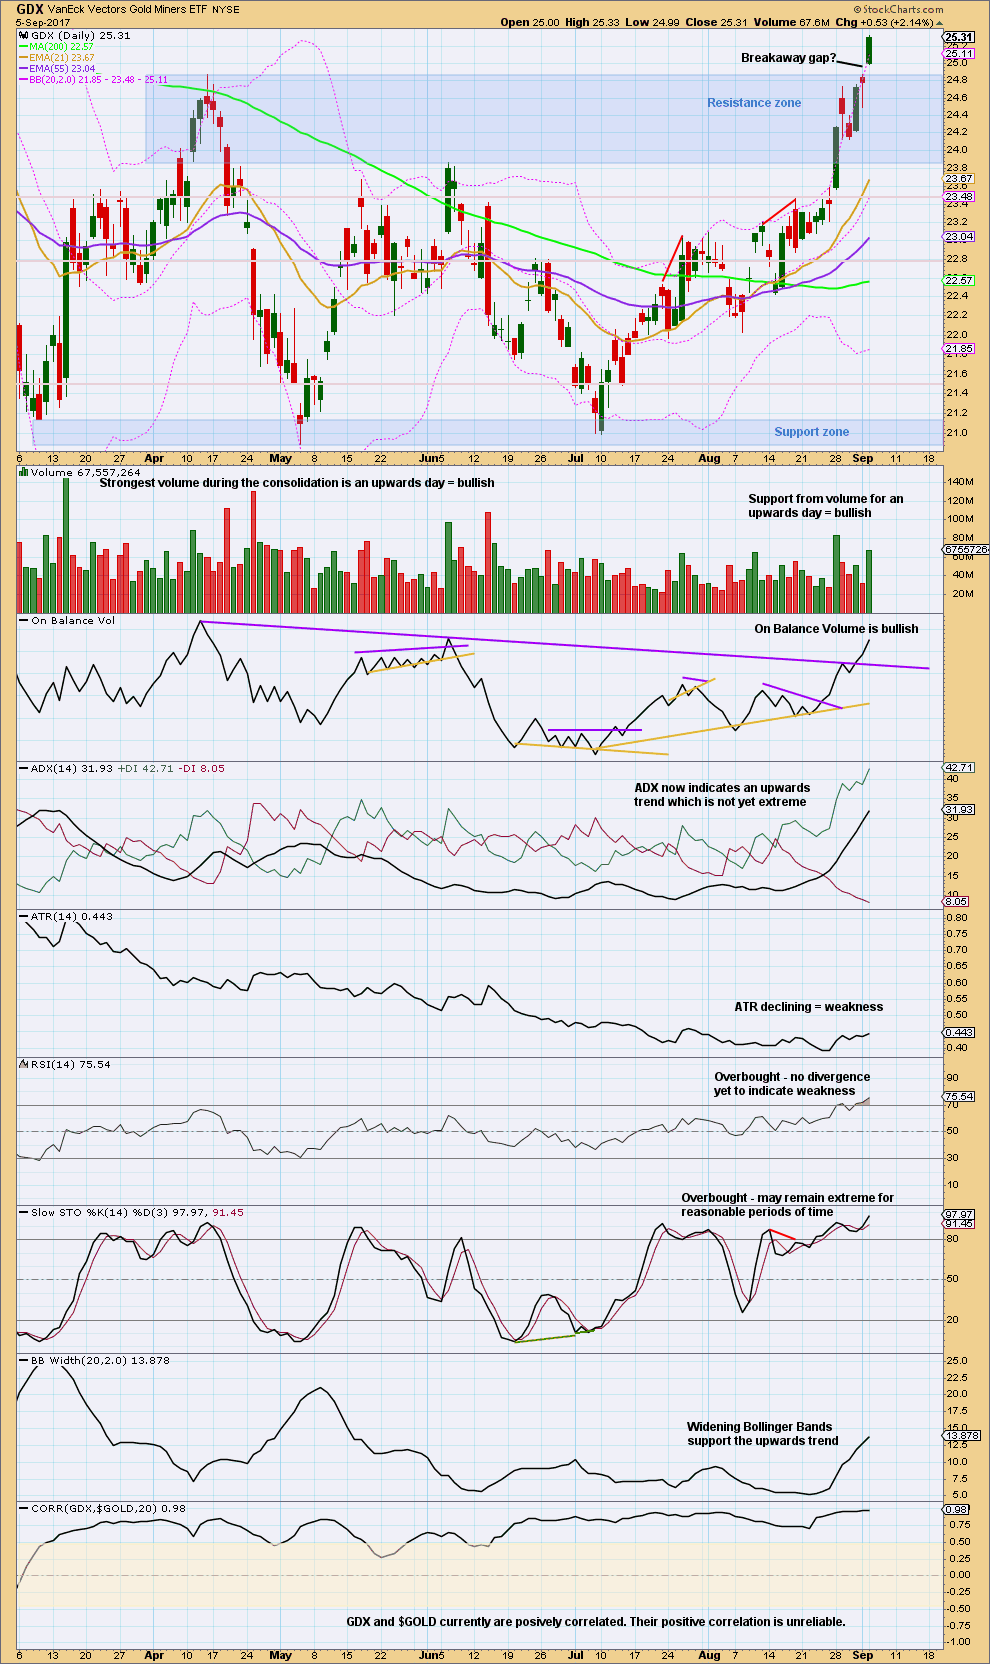
The hanging man candlestick pattern did not get bearish confirmation, so it is negated. GDX has today finally broken out upwards from a large consolidation zone. The upwards breakout has support from volume today.
The upwards breakout looks to also have a breakaway gap. If this is a breakaway gap, then it should not be filled. The lower edge at 24.87 should offer support now and may be used to set stops for long positions.
Look out for GDX to possibly turn down in coming days for a back test of support now about 24.88. If price behaves like this, it would offer a good entry point to join an established and confirmed upwards trend.
GOLD THIRD WAVE EXAMPLE – DAILY CHART
Click chart to enlarge. Chart courtesy of StockCharts.com.
This section will be left at the end of analysis until either the current wave count is proven wrong, or the third wave we are expecting has completed.
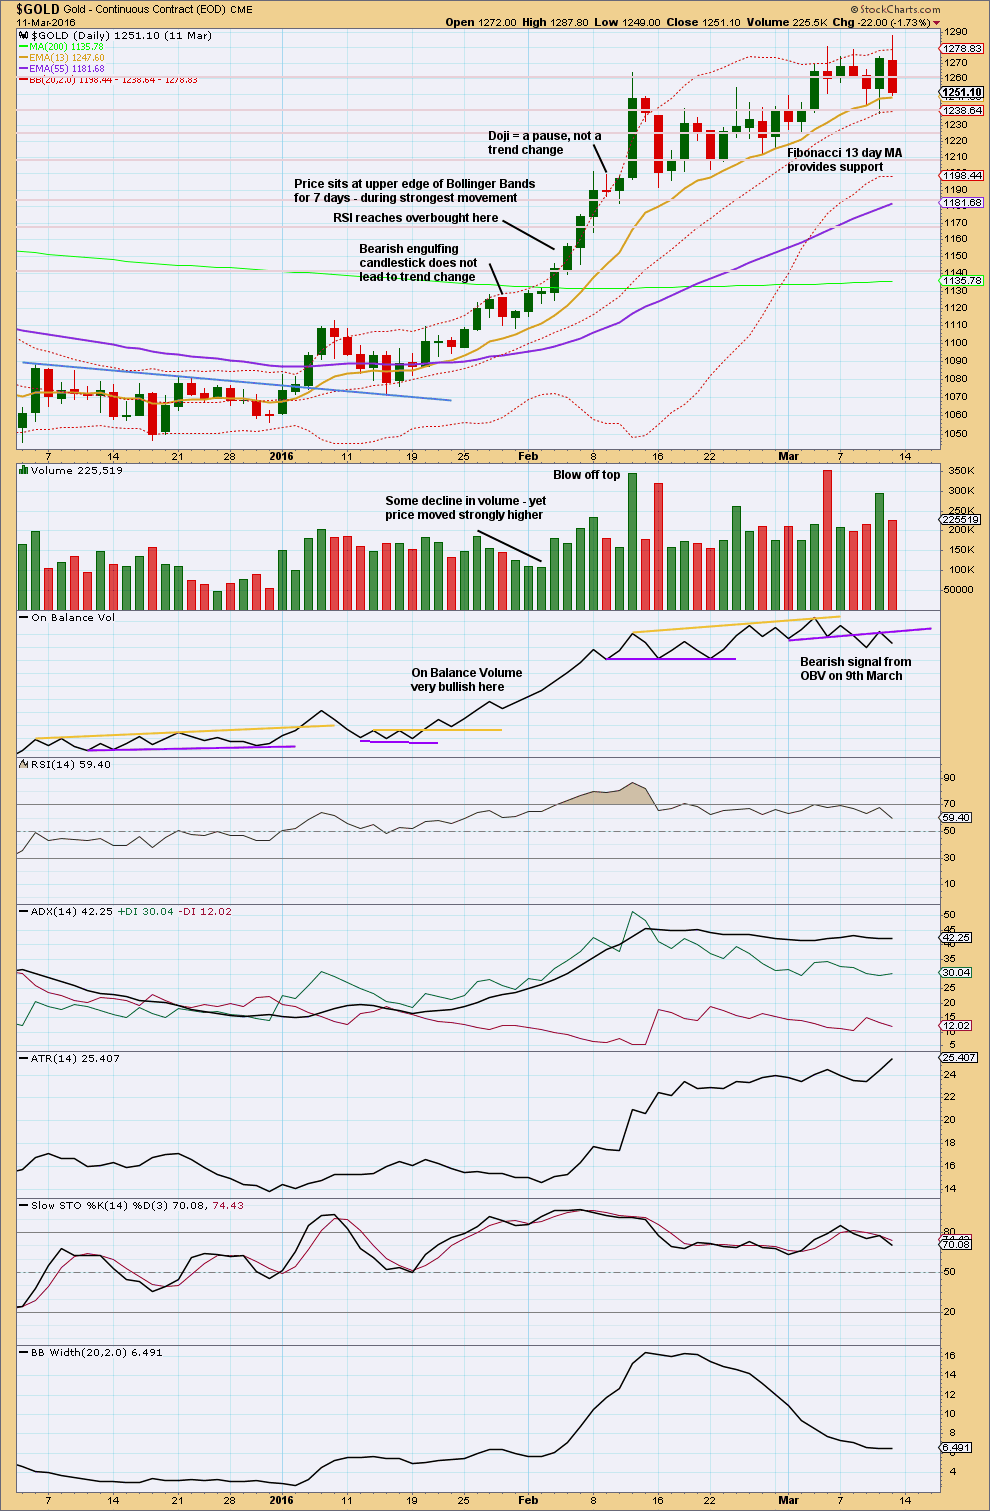
This chart has been published before. It shows the most recent example of a strong third wave in Gold from December 2015 to March 2016.
Note that during this strong upwards trend:
– RSI first reached overbought on the 4th of February and price then continued strongly higher for five more days culminating in a blowoff top on the 11th of February.
– RSI and Stochastics remained extreme for most of the second half of the trend. At the final high, they both exhibited strong divergence with price.
– Price found support at the short term Fibonacci 13 day moving average during the entire trend.
– All signals from On Balance Volume were bullish right up to the end of the trend. The 9th of March shows the first bearish signal, which was an important warning of a trend change.
– The trend begins with choppy overlapping and some hesitancy.
– The 6th of January was an important upwards breakout from resistance, with support from volume. Thereafter, price moved more strongly.
– While overall volume supported the upwards movement in price, this was not linear. Some weaker days occurred yet price continued higher. It is the overall trend of volume which is more important than any one or two days. On Balance Volume remaining bullish was an important guide.
No two waves are the same. So if the current wave count is correct, it may be different from this example. However, there are some important lessons to be learned here:
1. On Balance Volume is an important guide. Bullish signals should be taken seriously, particularly early on in the trend. Later in the trend, with RSI and Stochastics overbought, any bearish signal from On Balance Volume should see long positions closed.
2. RSI and Stochastics can reach extreme overbought. Only when they have been extreme for some time and then exhibit strong divergence should it be taken as a warning of a trend change.
Published @ 07:51 p.m. EST.
Price has come down again to the upper edge of the base channel.
I was suspicious yesterday of StockCharts volume data, but it’s still the same today. It does look like that was a blow off top and now a small correction is the result.
Expect price to find support here at the upper edge of the base channel is this main hourly count is correct. If price breaks below that line then the alternate may actually be correct.
The price point which will differentiate them for the short term is 1,325.67. If price makes a new low below that point then the alternate should be seriously considered.
If price makes a new low below 1,301.09 the main and alternate wave counts should then again be swapped over, a big trend change would be indicated.
But we are not there yet. The main count still has the highest probability, the trend is up, corrections are an opportunity to join the trend. Here is a perfect opportunity today.
Stops may be set just below the upper edge of the base channel. Give the market a little room to move, but close long positions if price moves fully back into the channel with clearly downwards movement (not just a bit of sideways movement). That’s about 1,327 at this time.
Target 1,365.
Manage risk, it’s the most important aspect of trading. Invest only 1-5% of equity on any one trade.
I’m adjusting the labelling within minor 3 now to see minute iii over and this current correction minute iv.
That’s because it has a great fit, good Fibonacci ratio and ended with a blowoff top.
It came a bit earlier than expected. The final target for minor 3 is still about the same. About 1,375 minor 3 would reach equality with minor 1, and minute v would be close to equality with minute waves i and iii.
Hi Lara. On Stockcharts volume – i wouldn’t take it very seriously, as it could be a result of market being closed on Monday (but futures were active). So they may have combined both Monday and Tuesday volume. GLD volume was strong, but not an outlier like the volume shown for $GOLD.
Yeah, that was my thinking too.
Still, now it’s followed by a small red candlestick this may be enough of a result.
Inside day so far. Gold price should really be getting back below weekly upper band to open up 1300 or thereabouts (20dma). Imo risk buy at current level 1337. Who is to say which way this will swing~!
Guess i was about a day late (as usual) with that short idea. Gold should hold here, or this could end up getting rather messy
The frolicsome bears need to execute one more dump to break below 1331-1328 and likely set-up walking the bulls to the abattoir lol… a stop at 1335.78 (1337) may just work. Tomorrow is another day; if wishes were horses….Oh well, have a fine day all 🙂
I had to look up abattoir lol thx
looks like we need to ride out this flat
Lara, wanted to say thanks for the Bitcoin post….but it won’t let me leave a comment over there. That market has been nothing short of amazing. Maybe we could all keep an eye out for the end of Primary 4 as it looks like Primary 5 could offer a double or two 💰
You’re welcome. I will be watching it, I want to buy BitCoin again if P4 comes down to touch the trend line and if that line holds.
No doubt about, this is a strong 3rd wave move up in GDX. Minuette 3 looks to be extending and may end tomorrow. The target is now 25.48.
Watch the top of the blue base channel for Minuette 4 support around 25. This is also the top of a possible “breakaway” gap as shown by Lara. Should this area fail, look for a deeper correction, possibly as low as 24, where the top of the yellow base channel should hold as support.
Good luck!
https://www.tradingview.com/x/Oo3tQh16/
The new banner pic this month is taken at Langs beach, one of my local surf spots.
Nice pic!
Thanks, Wow what a huge surf. How big is this wave?
We would say down here in NZ that it’s 4ft. That’s measured from the back of the wave.
So the face would be just under 8ft.