
More upwards movement was expected to about 20. Price moved slightly higher after last analysis before turning at 18.207.
Summary: Check On Balance Volume carefully over the next session. If it moves higher, take that as a bullish signal and expect the pullback is over and price may continue higher to a target at 20.06.
If On Balance Volume breaks below support tomorrow, then upwards movement may be over for Silver. Use the second wave count.
New updates to this analysis are in bold.
Last monthly chart is here.
ELLIOTT WAVE COUNTS
FIRST WAVE COUNT
WEEKLY CHART
Click chart to enlarge.
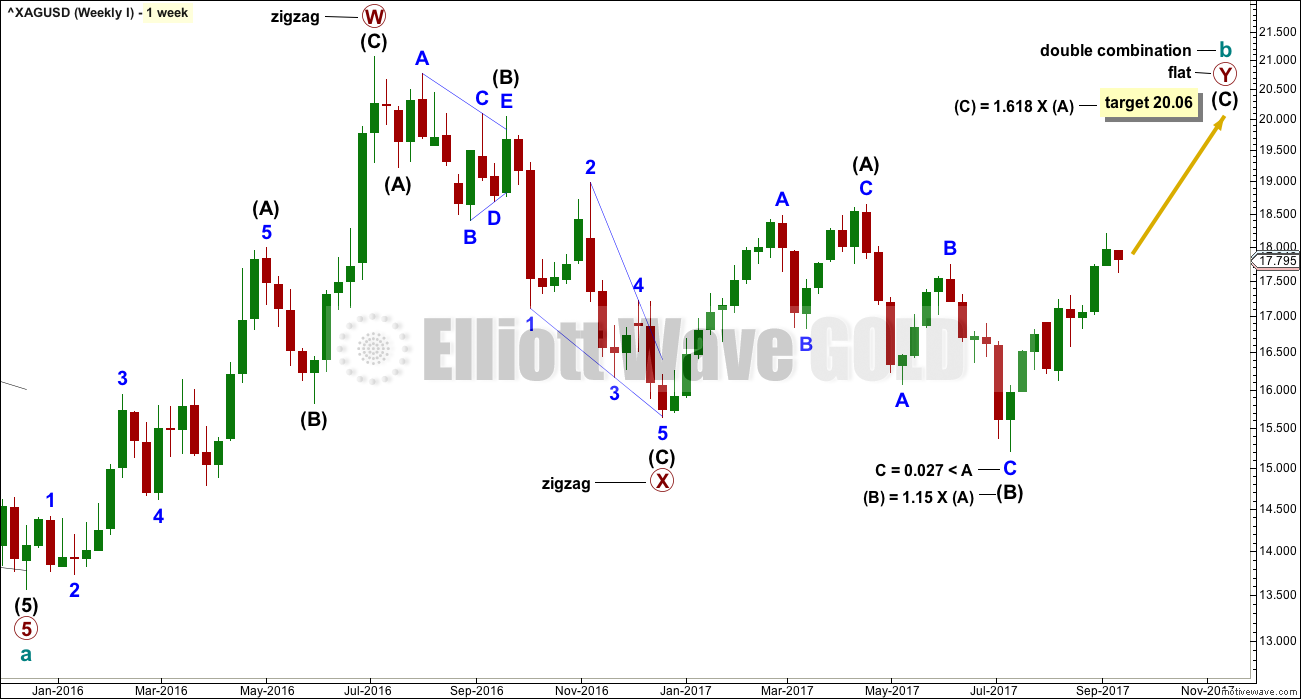
Cycle wave b may be completing as a double combination: zigzag – X – flat. The second structure, a flat correction for primary wave Y, may be underway.
Within a flat correction, intermediate wave (B) must retrace a minimum 0.9 length of intermediate wave (A) at 15.938. Intermediate wave (B) has met this minimum requirement; the rule for a flat correction is met. Intermediate wave (B) is longer than 1.05 times the length of intermediate wave (A) indicating this may be an expanded flat. Expanded flat corrections are the most common type. Normally their C waves are 1.618 or 2.618 the length of their A waves.
The target calculated would see primary wave Y to end close to same level as primary wave W about 21.062. The purpose of combinations is to take up time and move price sideways. To achieve this purpose the second structure in the double normally ends about the same level as the first.
While the combination wave count at the weekly chart level does not currently work for Gold, it does still work for Silver. They do not have to complete the same structures for cycle wave b, and fairly often their structures are different.
DAILY CHART
Click chart to enlarge.
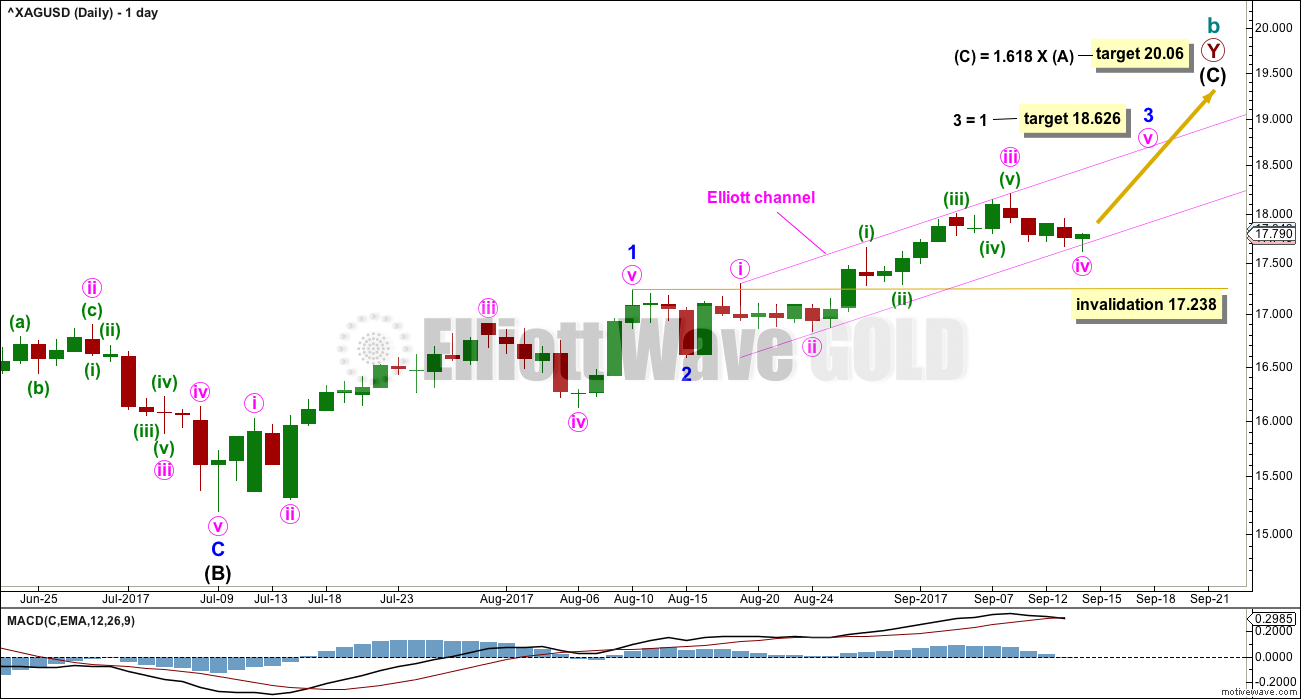
For this first wave count, upwards movement for intermediate wave (C) must subdivide as a five wave structure. It may be unfolding as an impulse.
Within the impulse, the labelling this week has been changed to fit with MACD. Minor wave 3 is now seen as incomplete.
Minor wave 1 is extended. The target expects minor wave 3 may also be an extension. If that happens, then minor wave 5 may not be extended and would be expected to be shorter than minor waves 1 or 3.
So far minor wave 3 has stronger momentum than minor wave 1.
Minor wave 4, when it arrives, may not move into minor wave 1 price territory below 17.238.
SECOND WAVE COUNT
WEEKLY CHART
Click chart to enlarge.
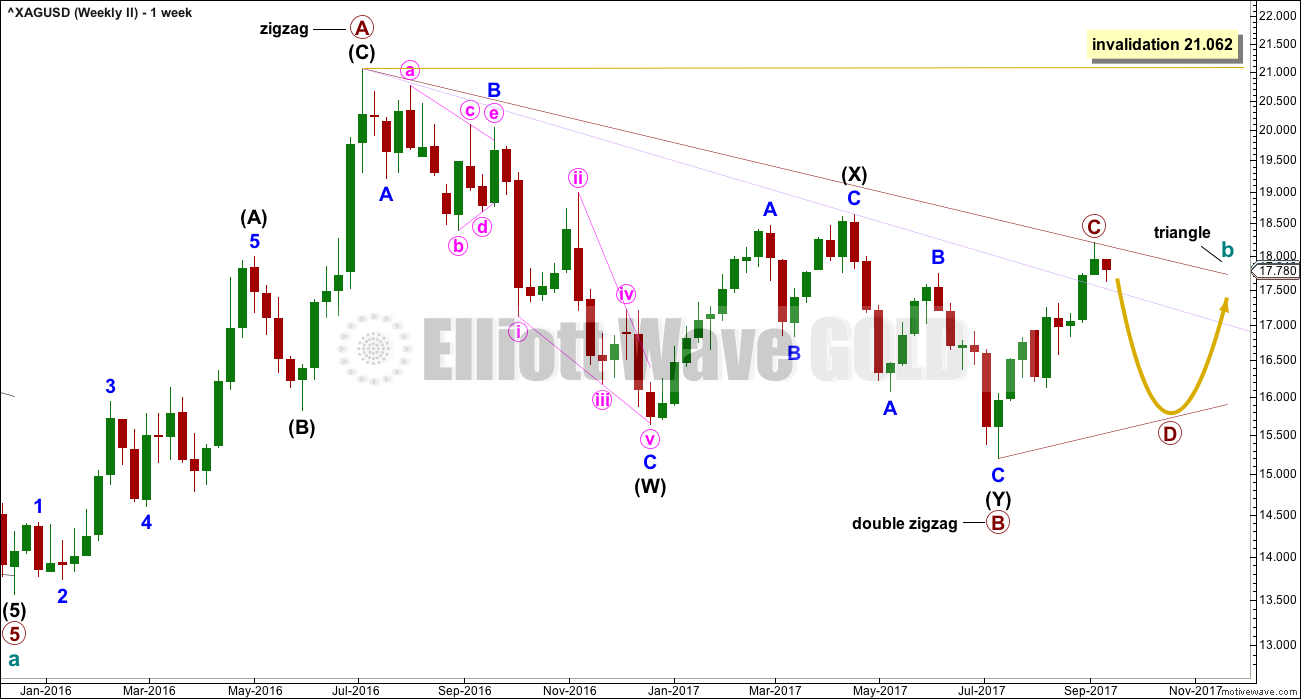
Within a triangle, one of the sub-waves must be a more complicated multiple, usually a multiple zigzag. This may be complete for primary wave B.
Primary wave C upwards may now be complete. The upper A-C trend line does have a fairly steep slope though, so it must be accepted that primary wave C may not be over and may continue higher. If it does, it may not move beyond the end of primary wave A above 21.062.
Primary wave C must subdivide as a three wave zigzag.
DAILY CHART
Click chart to enlarge.
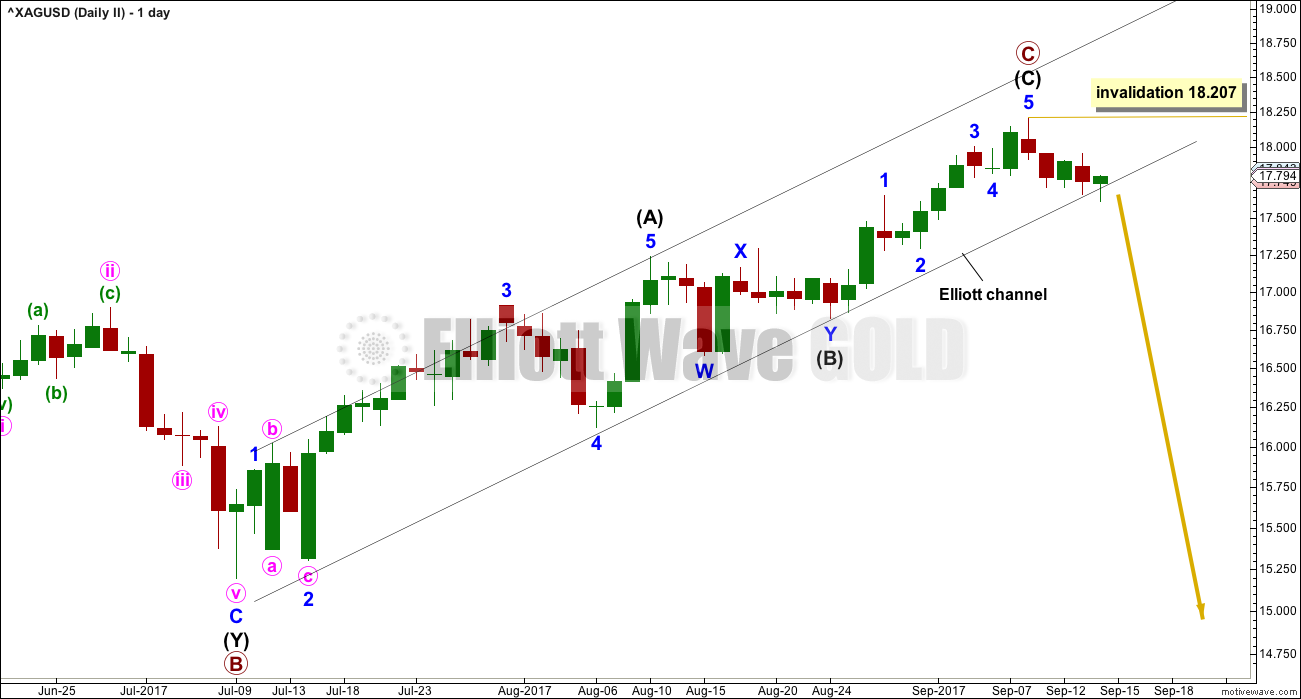
This daily chart now focusses on the structure of primary wave C.
Intermediate wave (C) must subdivide as a five wave structure. It looks like it may be unfolding as the more common impulse. It may now be complete.
If intermediate wave (C) is complete, then the next wave down for primary wave D must begin with a five wave structure at the daily chart level. Within the first five down, no second wave correction may move beyond its start above 18.207.
TECHNICAL ANALYSIS
WEEKLY CHART
Click chart to enlarge. Chart courtesy of StockCharts.com.
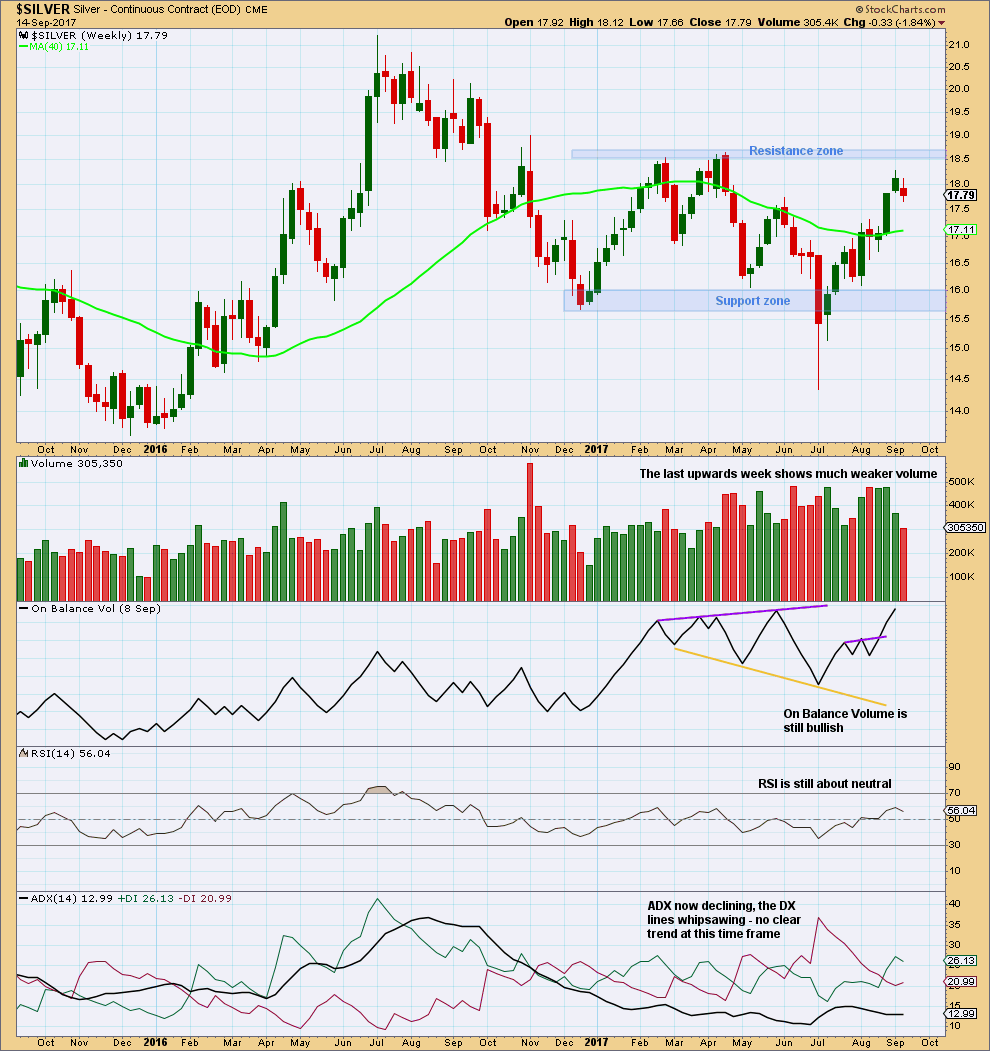
Price is still within a large consolidation zone. Volume remains relatively strong. So far, within the consolidation, it is only now one downwards week that has strongest volume suggesting a downwards breakout eventually is more likely than upwards. However, the difference is very slight between this week and the next strongest week which was an upwards week, so the signal is not a clear one.
A strong decline in the last upwards week along with a longer upper candlestick wick is short term bearish. This may be resolved during the current week, which may close red.
DAILY CHART
Click chart to enlarge. Chart courtesy of StockCharts.com.
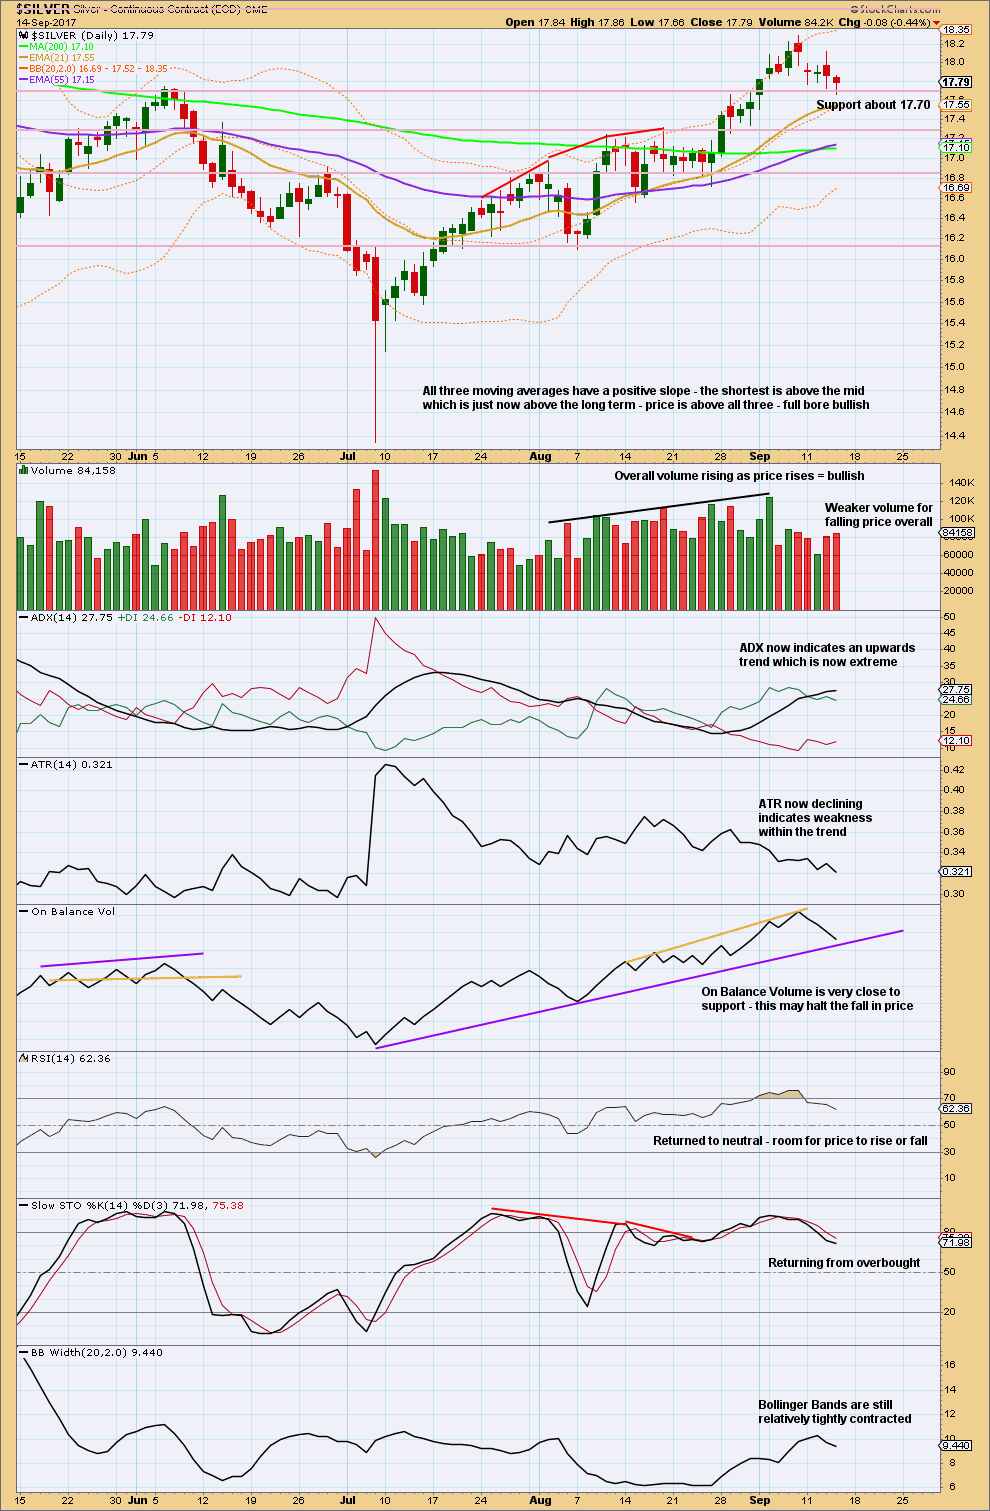
Downwards movement may be finding some support about 17.70.
A long lower wick on the last downwards day is slightly bullish. But some slight support from volume is slightly bearish.
On Balance Volume may give an important signal in the next 24 hours. If it moves up from support, that would be a bullish signal; expect that downwards movement was a pullback and expect new highs.
If however On Balance Volume breaks below support, that would be a reasonable bearish signal for Silver.
Published @ 12:55 a.m. EST.