
More upwards movement was expected from last week’s analysis. This is what has happened.
Summary: The trend is upwards. There are some signs it is nearing extreme, but there is room still for price to rise further.
A short term target is about 20.
Expect price to keep rising while price remains within the Elliott channels on the daily charts. If price breaks below the channels, then a deeper pullback or trend change may have occurred.
New updates to this analysis are in bold.
Last monthly chart is here.
ELLIOTT WAVE COUNTS
FIRST WAVE COUNT
WEEKLY CHART
Click chart to enlarge.
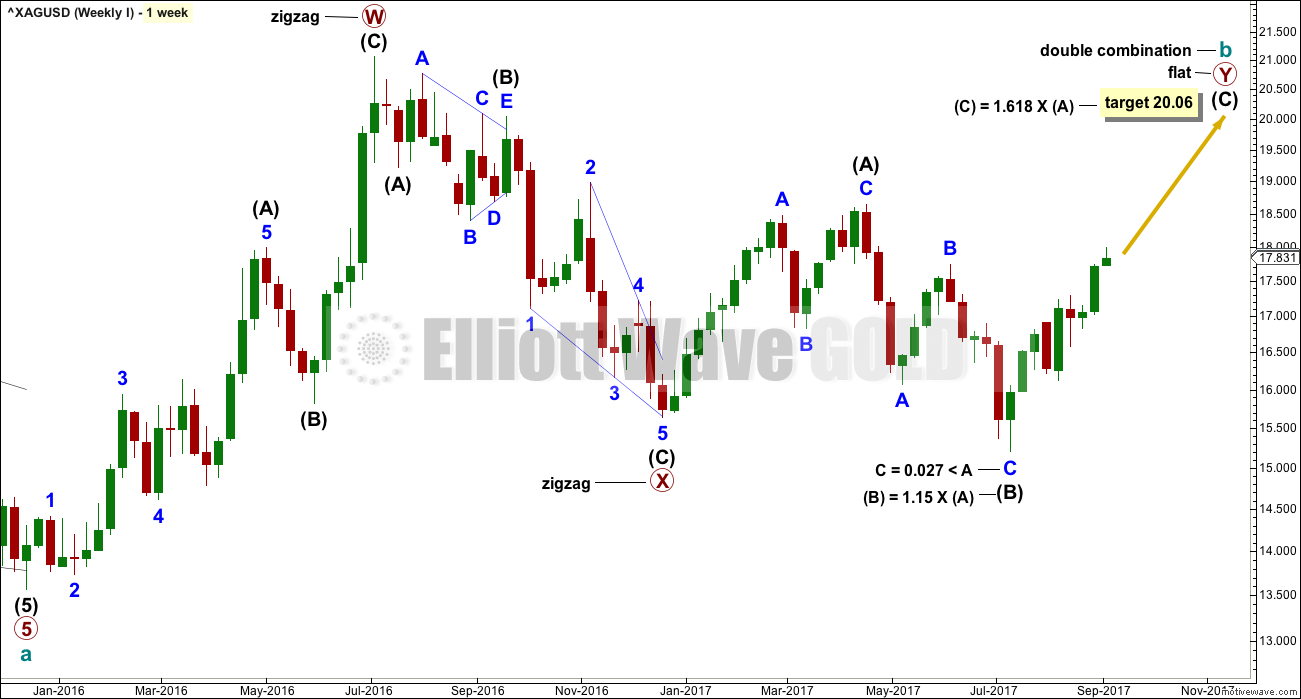
Cycle wave b may be completing as a double combination: zigzag – X – flat. The second structure, a flat correction for primary wave Y, may be underway.
Within a flat correction, intermediate wave (B) must retrace a minimum 0.9 length of intermediate wave (A) at 15.938. Intermediate wave (B) has met this minimum requirement; the rule for a flat correction is met. Intermediate wave (B) is longer than 1.05 times the length of intermediate wave (A) indicating this may be an expanded flat. Expanded flat corrections are the most common type. Normally their C waves are 1.618 or 2.618 the length of their A waves.
The target calculated would see primary wave Y to end close to same level as primary wave W about 21.062. The purpose of combinations is to take up time and move price sideways. To achieve this purpose the second structure in the double normally ends about the same level as the first.
While the combination wave count at the weekly chart level does not currently work for Gold, it does still work for Silver. They do not have to complete the same structures for cycle wave b, and fairly often their structures are different.
DAILY CHART
Click chart to enlarge.
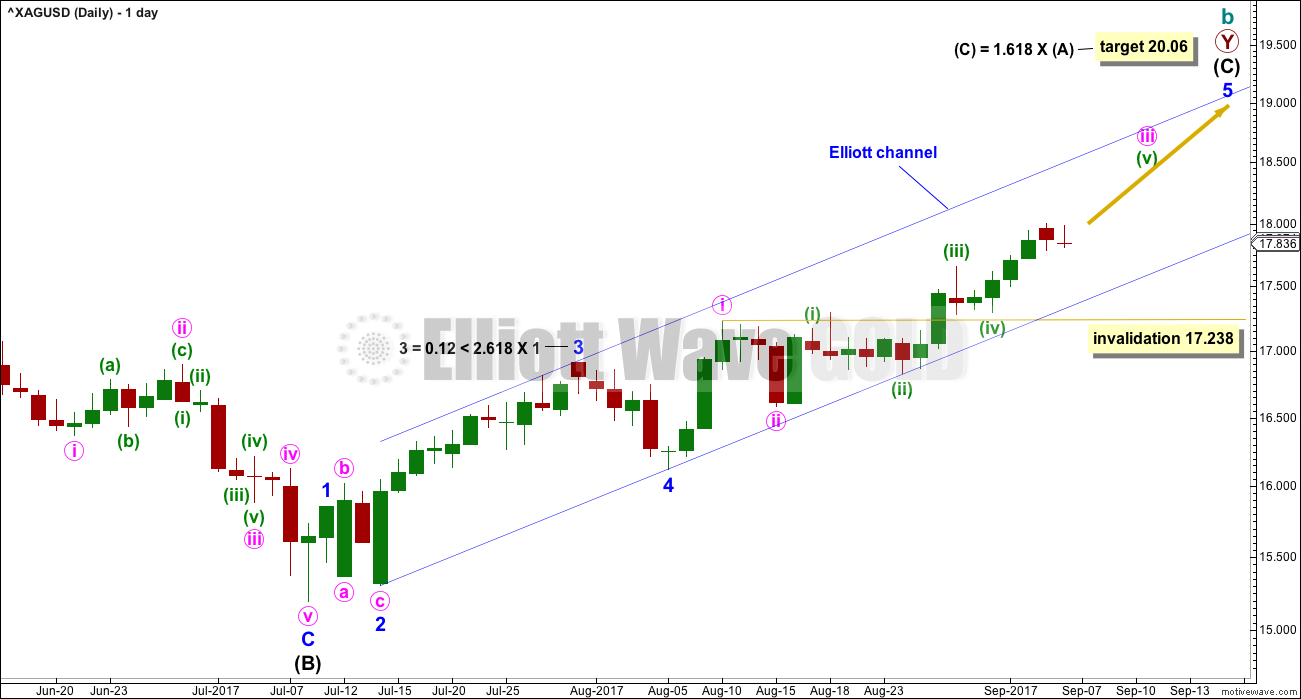
For this first wave count, upwards movement for intermediate wave (C) must subdivide as a five wave structure. It may be unfolding as an impulse.
Within the impulse, minor waves 1 through now to 4 may be complete. Minor wave 5 may be a long extension, which is typical for commodities.
The blue Elliott channel is redrawn using the second technique. Minor wave 5 may end about the upper edge of the channel.
Within the extension of minor wave 5, minute waves i and ii may be complete. Minute wave iii may be extending.
The middle of the third wave may be extending within minute wave iii.
When minute wave iii is complete, then minute wave iv may not move into minute wave i price territory below 17.238.
SECOND WAVE COUNT
WEEKLY CHART
Click chart to enlarge.
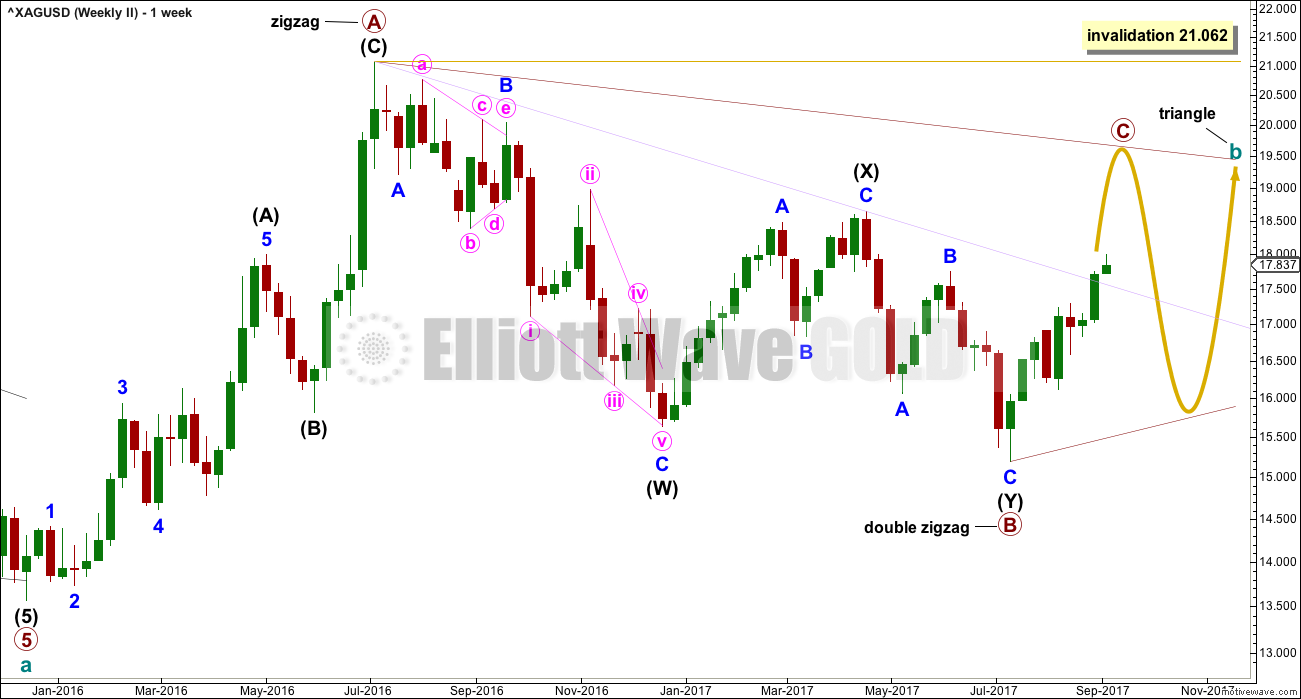
Within a triangle, one of the sub-waves must be a more complicated multiple, usually a multiple zigzag. This may be complete for primary wave B.
Primary wave C upwards should unfold as a single zigzag that may not move beyond the end of primary wave A above 21.062. The A-C trend line is adjusted to see primary wave C reach a more normal length in relation to primary wave B. Along the way up, price may find some resistance at the lilac trend line.
Primary wave C must subdivide as a three wave zigzag.
DAILY CHART
Click chart to enlarge.
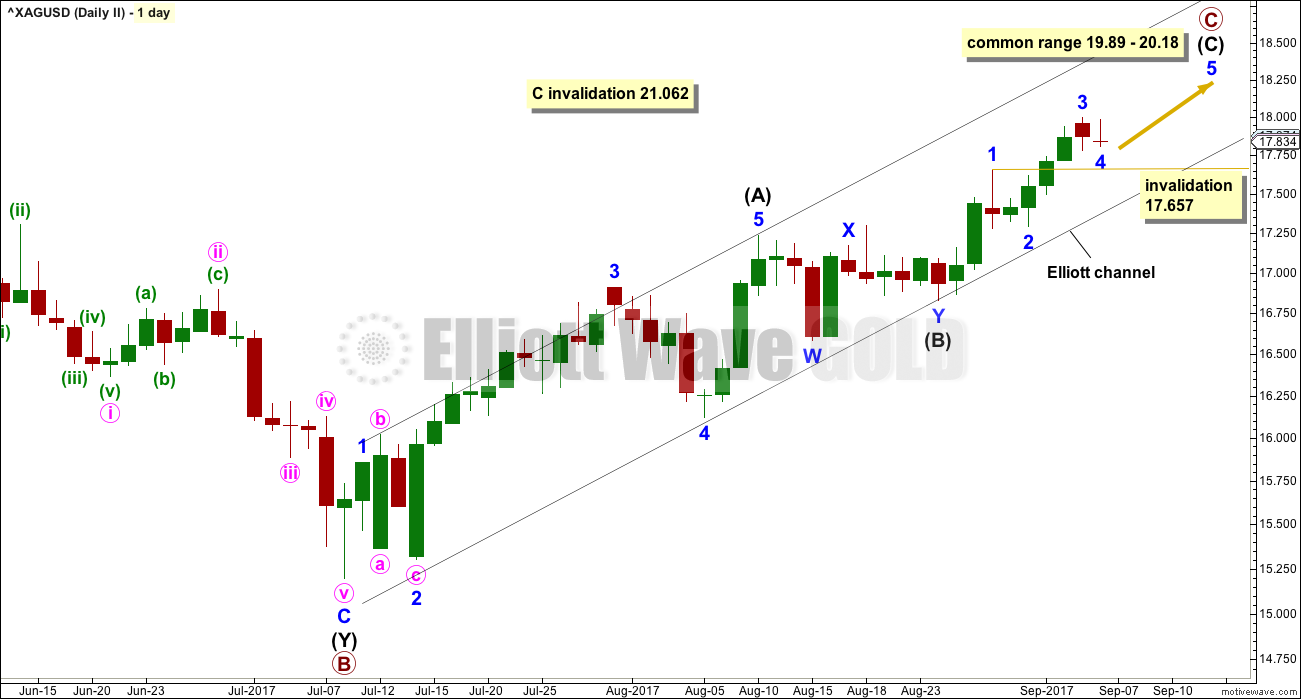
This daily chart now focusses on the structure of primary wave C.
Intermediate wave (C) must subdivide as a five wave structure. It looks like it may be unfolding as the more common impulse. Within intermediate wave (C), minor wave 2 may not move beyond the start of minor wave 1 below 16.829.
Minor wave 3 upwards should exhibit an increase in momentum and should have support from volume.
If minor wave 3 is over as labelled, then it is slightly shorter than minor wave 1. This would limit minor wave 5 to no longer than equality in length with minor wave 3 at 18.515. This would mean that primary wave C may be a little shorter than the more common length.
Minor wave 4 may not move into minor wave 1 price territory below 17.657.
TECHNICAL ANALYSIS
WEEKLY CHART
Click chart to enlarge. Chart courtesy of StockCharts.com.
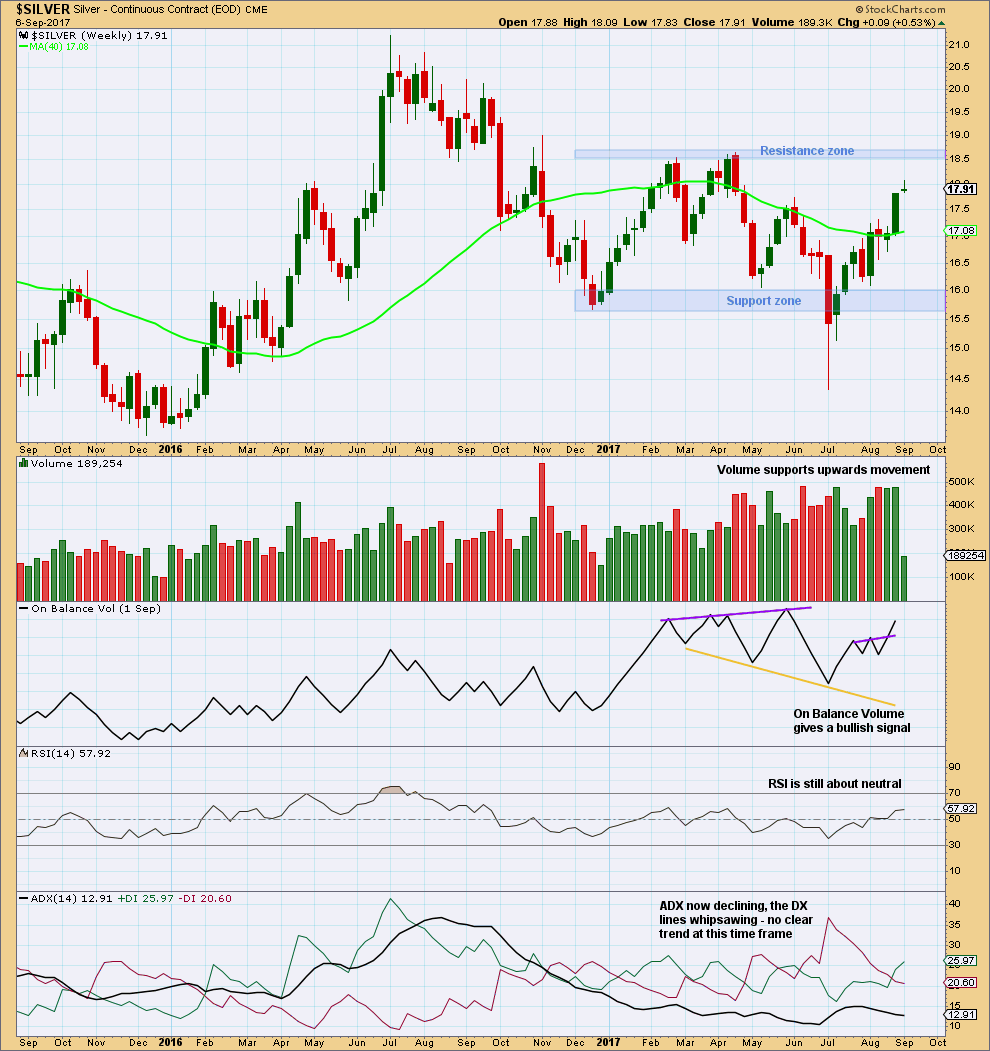
Price is still within a large consolidation zone. Volume remains relatively strong. So far, within the consolidation, it is only now one downwards week that has strongest volume suggesting a downwards breakout eventually is more likely than upwards. However, the difference is very slight between this week and the next strongest week which was the last upwards week, so the signal is not a clear one.
On Balance Volume gives an important bullish signal this week. It often precedes price, so it now looks like an upwards breakout may be coming for Silver.
DAILY CHART
Click chart to enlarge. Chart courtesy of StockCharts.com.
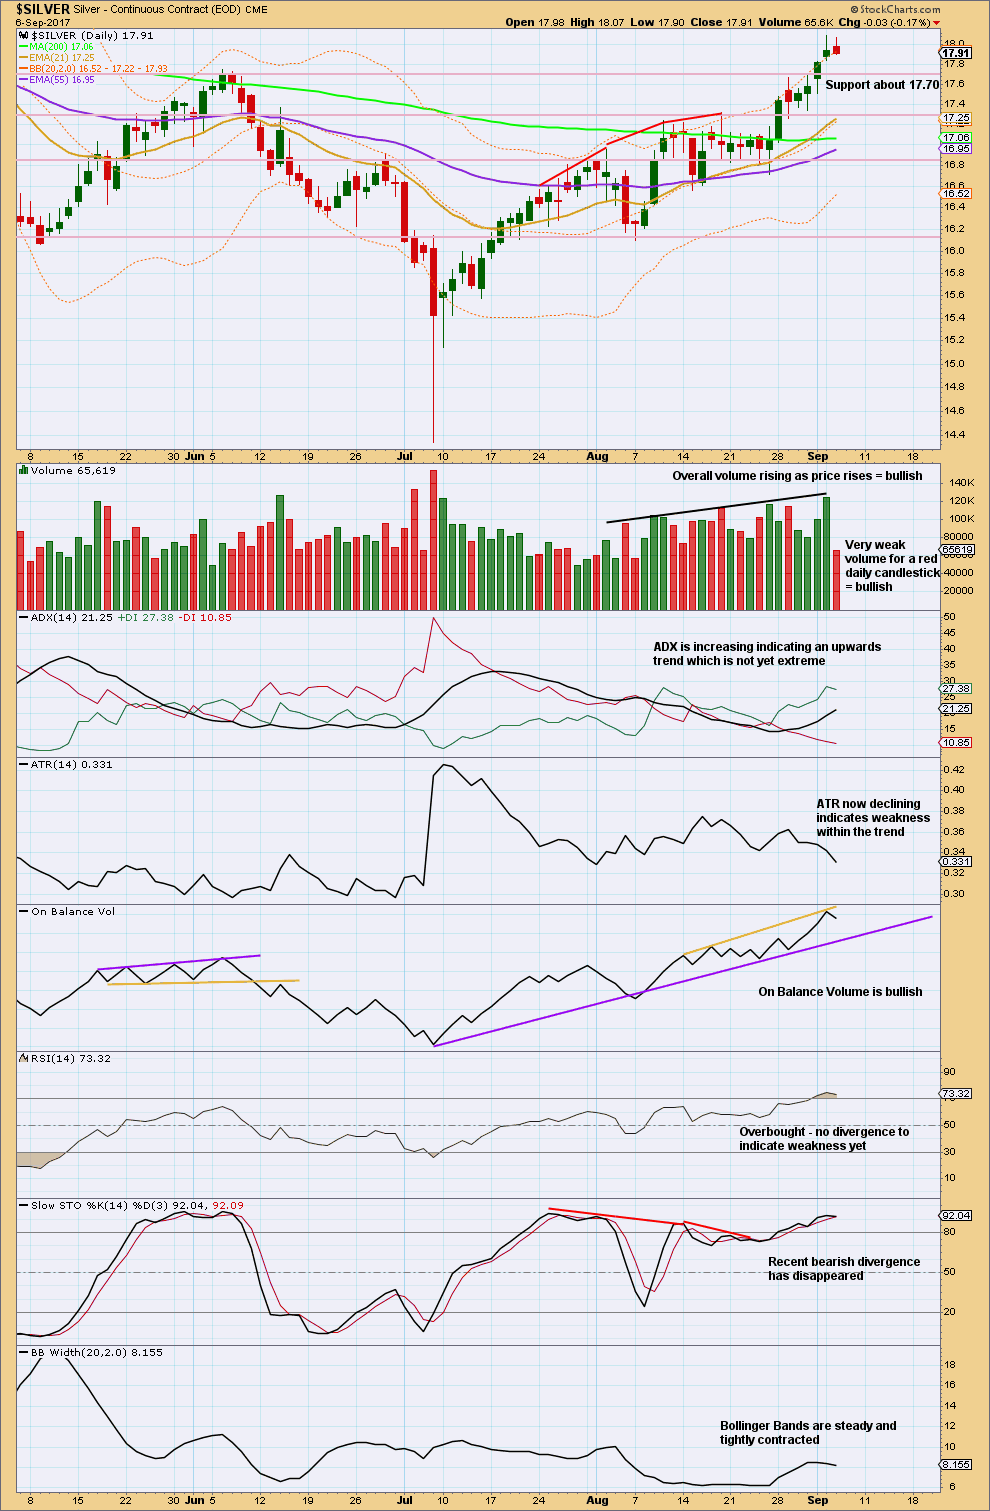
RSI and Stochastics may remain extreme for reasonable periods of time when Silver is in a strong bullish trend.
With ADX not yet extreme, and RSI not yet exhibiting divergence with price, there is room for upwards movement to continue further.
The only concern regarding the trend at this time is now slightly declining ATR and a lack of widening of Bollinger Bands.
Published @ 08:34 p.m. EST.