
The overall upwards trend continues, which is what the Elliott wave counts expected at the daily chart level.
Summary: A pullback to test support is still likely either here or very soon. The target is at 1,274 – 1,273.
Overall, at this time, the trend is up. If a pullback does unfold as the Elliott wave counts expect, then use it as an opportunity to join the new upwards trend.
The fist target for this upwards trend is at 1,297, then 1,319 or possibly as high as 1,412.
This pullback may offer an entry opportunity to go long. Always trade with stops and invest only 1-5% of equity on any one trade.
New updates to this analysis are in bold.
Last monthly charts for the main wave count are here, another monthly alternate is here, and video is here.
Grand SuperCycle analysis is here.
The wave counts will be labelled first and second. Classic technical analysis will be used to determine which wave count looks to be more likely. In terms of Elliott wave structure the second wave count has a better fit and fewer problems.
FIRST ELLIOTT WAVE COUNT
WEEKLY CHART
Click chart to enlarge.
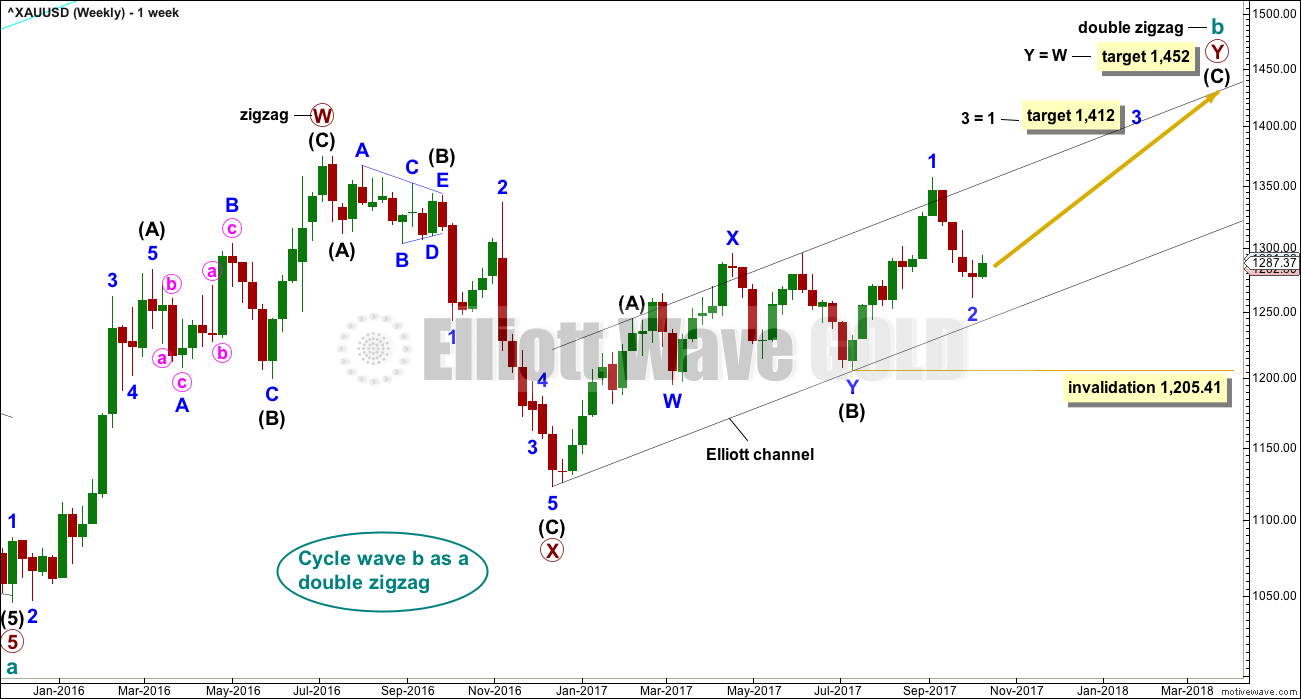
There are more than 23 possible corrective structures that B waves may take, and although cycle wave b still fits well at this stage as a triangle, it may still be another structure. This wave count looks at the possibility that it may be a double zigzag.
If cycle wave b is a double zigzag, then current upwards movement may be part of the second zigzag in the double, labelled primary wave Y.
The target remains the same.
Within intermediate wave (C), no second wave correction may move beyond the start of its first wave below 1,205.41. However, prior to invalidation, this wave count may be discarded if price breaks below the lower edge of the black Elliott channel. If this wave count is correct, then intermediate wave (C) should not break below the Elliott channel which contains the zigzag of primary wave Y upwards.
There are two problems with this wave count which reduce its probability in terms of Elliott wave:
1. Cycle wave b is a double zigzag, but primary wave X within the double is deep and time consuming. While this is possible, it is much more common for X waves within double zigzags to be brief and shallow.
2. Intermediate wave (B) within the zigzag of primary wave Y is a double flat correction. These are extremely rare, even rarer than running flats. The rarity of this structure must further reduce the probability of this wave count.
DAILY CHART
Click chart to enlarge.
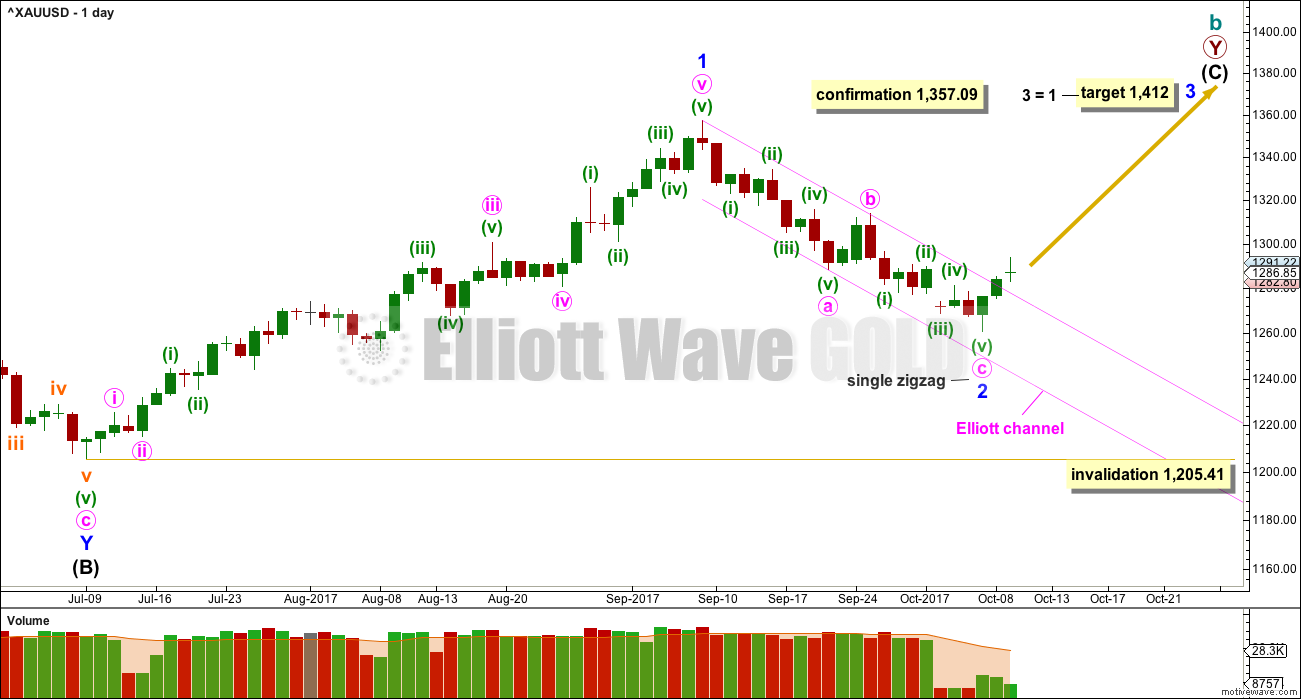
The analysis will focus on the structure of intermediate wave (C). To see details of all the bull movement for this year see daily charts here.
Intermediate wave (C) must be a five wave structure, either an impulse or an ending diagonal. It is unfolding as the more common impulse.
It is possible that minor waves 1 and now 2 may both be over. Minor wave 2 may have ended very close to the 0.618 Fibonacci ratio. If it continues lower, then minor wave 2 may not move beyond the start of minor wave 1 below 1,205.41.
Minor wave 1 lasted 44 days and minor wave 2 may have lasted 20 days, just one short of a Fibonacci 21.
HOURLY CHART
Click chart to enlarge.
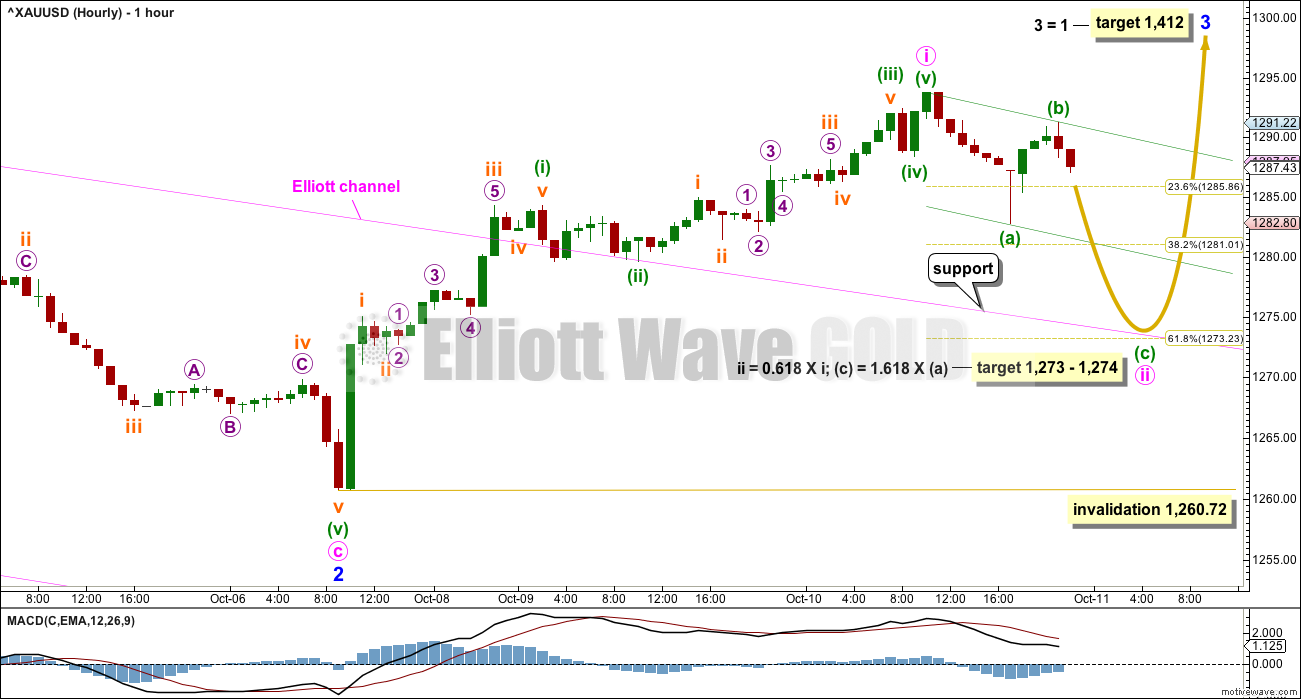
A five up is now complete. A three down should follow.
The .618 Fibonacci ratio coincides neatly with a 1.618 Fibonacci ratio for minuette wave (c) within minute wave ii. This may bring price down to test support of prior resistance from the prior downwards channel. When this pullback is complete, upwards momentum should increase as a third wave up (minute wave iii) or minor wave c (second count) unfolds.
Minute wave ii may not move beyond the start of minute wave i below 1,260.72.
SECOND ELLIOTT WAVE COUNT
WEEKLY CHART
Click chart to enlarge.
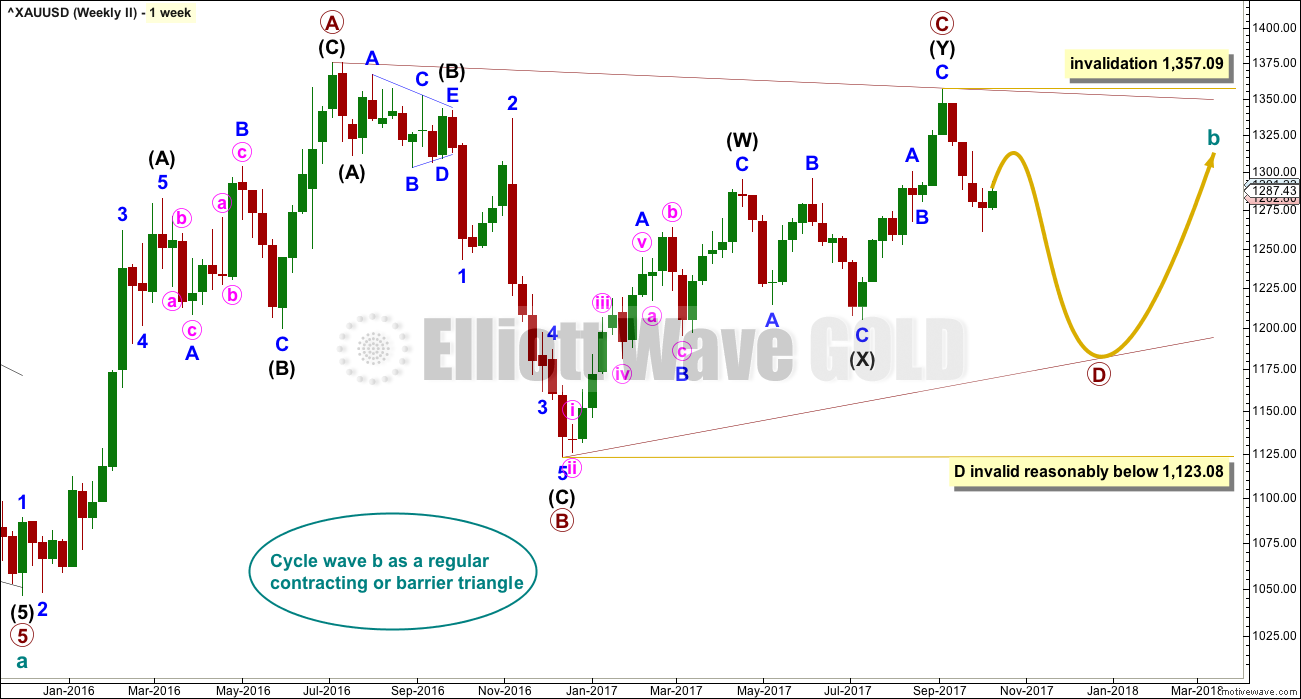
It is still possible that cycle wave b is unfolding as a regular contracting or barrier triangle.
Within a triangle, one sub-wave should be a more complicated multiple, which may be primary wave C. This is the most common sub-wave of the triangle to subdivide into a multiple.
Intermediate wave (Y) now looks like a complete zigzag at the weekly chart level.
Primary wave D of a contracting triangle may not move beyond the end of primary wave B below 1,123.08. Contracting triangles are the most common variety.
Primary wave D of a barrier triangle should end about the same level as primary wave B at 1,123.08, so that the B-D trend line remains essentially flat. This involves some subjectivity; price may move slightly below 1,123.08 and the triangle wave count may remain valid. This is the only Elliott wave rule which is not black and white.
Finally, primary wave E of a contracting or barrier triangle may not move beyond the end of primary wave C above 1,295.65. Primary wave E would most likely fall short of the A-C trend line. But if it does not end there, then it can slightly overshoot that trend line.
Primary wave A lasted 31 weeks, primary wave B lasted 23 weeks, and primary wave C lasted 38 weeks.
The A-C trend line now has too weak a slope. At this stage, this is now a problem for this wave count, the upper A-C trend line no longer has such a typical look.
Within primary wave D, no part of the zigzag may move beyond its start above 1,357.09.
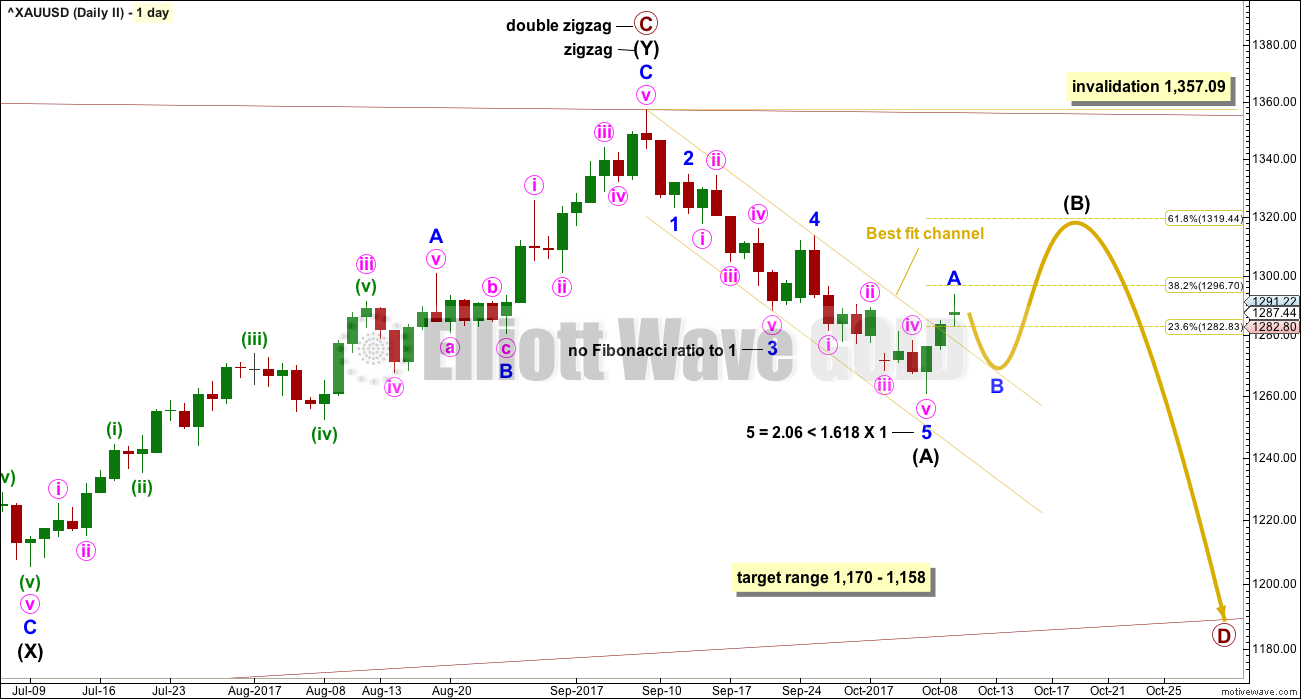
DAILY CHART
Click chart to enlarge.
This second wave count expects the new wave down may be deeper and longer lasting than the first wave count allows for.
A common length for triangle sub-waves is from 0.8 to 0.85 the length of the prior wave. Primary wave D would reach this range from 1,170 to 1,158.
If primary wave C is correctly labelled as a double zigzag, then primary wave D must be a single zigzag.
Within the single zigzag of primary wave D, intermediate wave (A) is labelled as a complete impulse.
Intermediate wave (A) lasted 20 days, just one short of a Fibonacci 21. Intermediate wave (B) may be about the same duration, so that this wave count has good proportions, or it may be longer because B waves tend to be more complicated and time consuming.
Intermediate wave (B) may be a sharp upwards zigzag, or it may be a choppy overlapping consolidation as a flat, triangle or combination.
HOURLY CHART
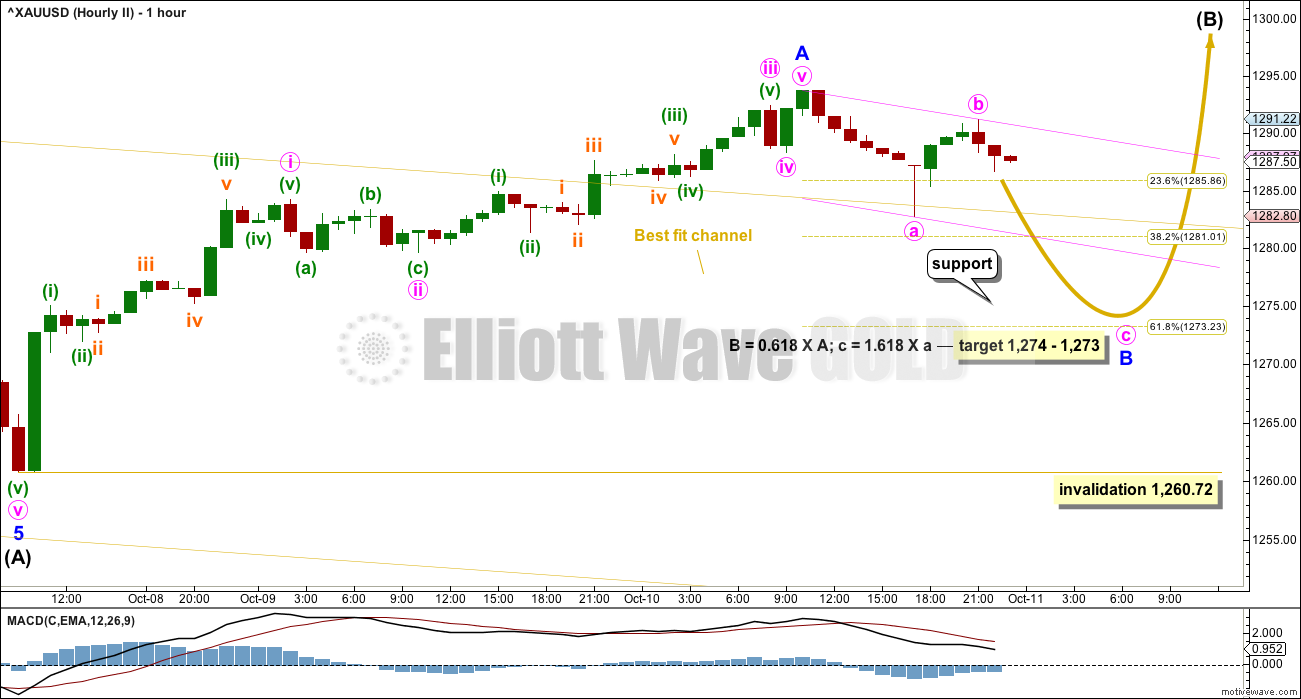
Click chart to enlarge.
Minor wave b may not move beyond the start of minor wave a below 1,260.72.
TECHNICAL ANALYSIS
WEEKLY CHART
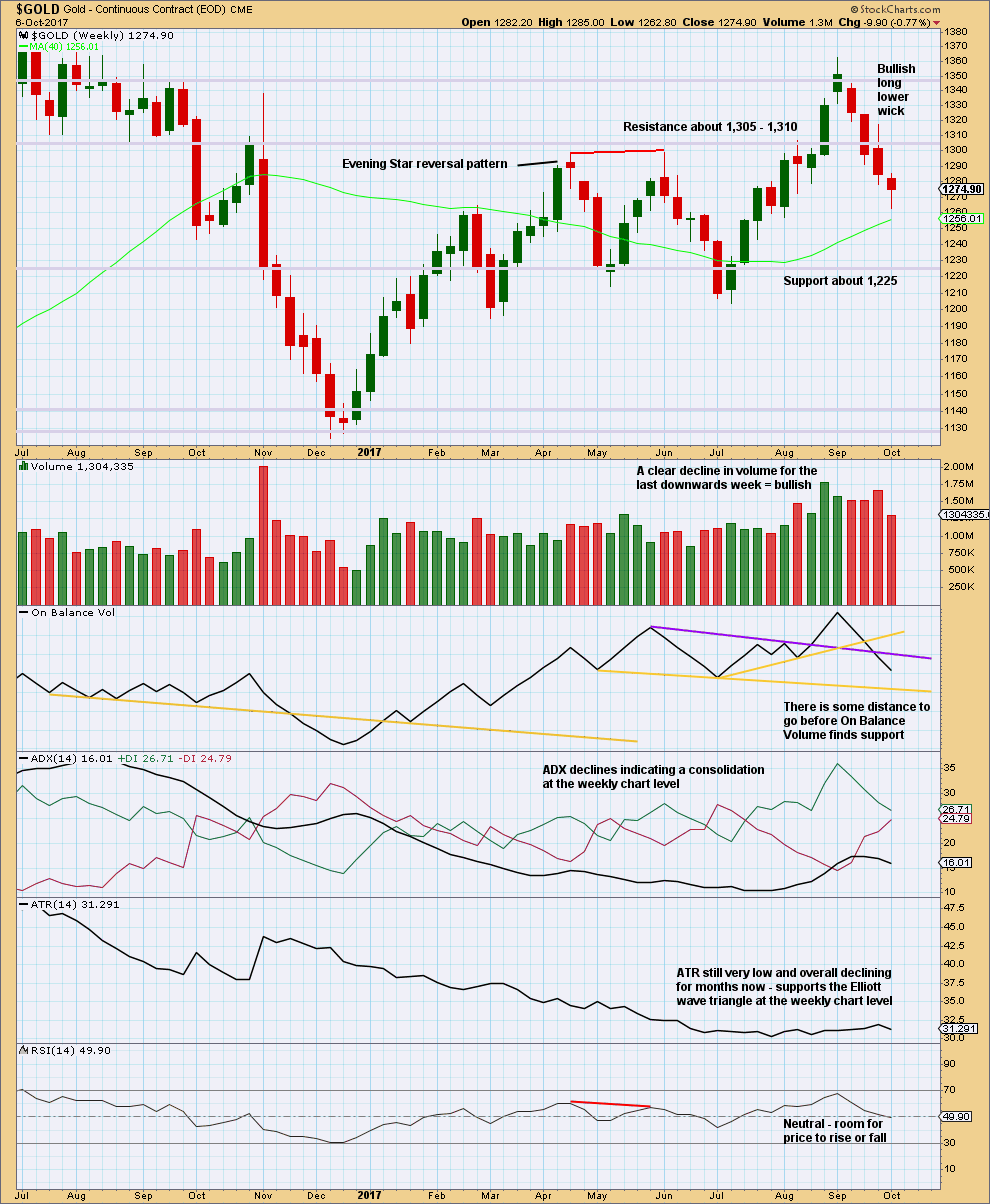
Click chart to enlarge. Chart courtesy of StockCharts.com.
The candlestick for last week is not a Hammer reversal pattern. The lower shadow must be at minimum twice the length of the real body and this one falls short. The long lower wick is still bullish though.
The lower wick with a decline in volume for downwards movement last week does look like at least an interim low is in place.
DAILY CHART
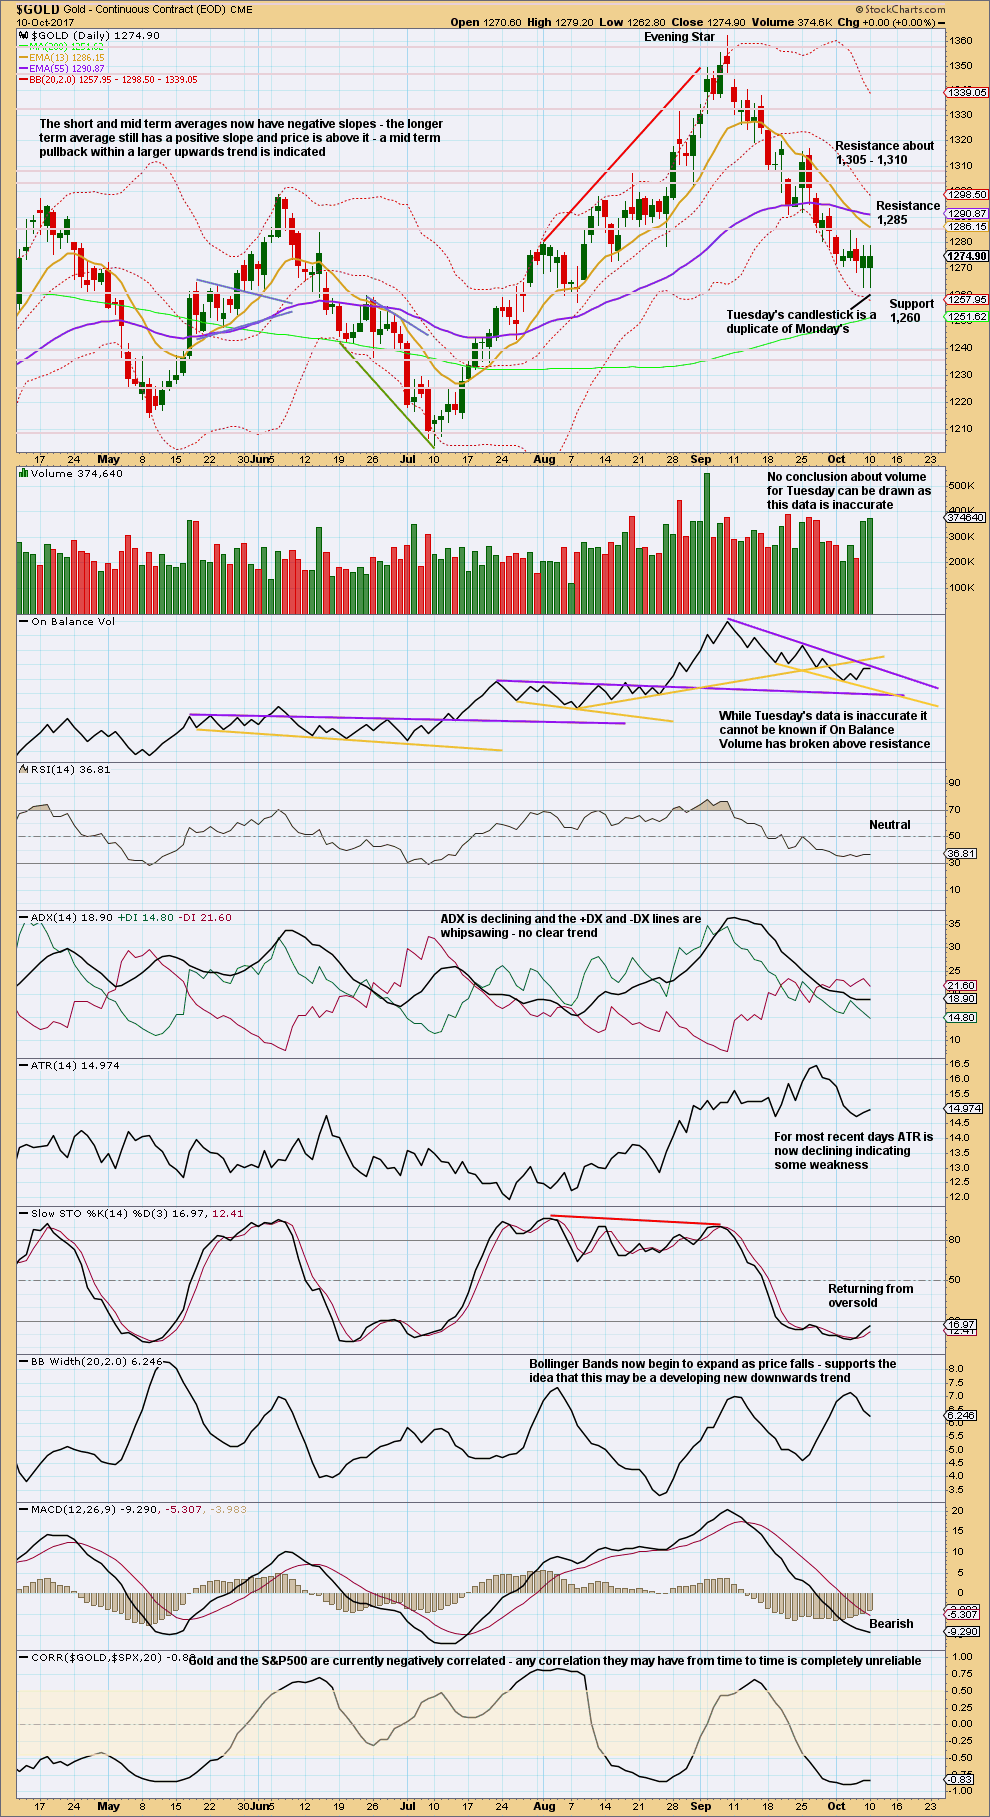
Click chart to enlarge. Chart courtesy of StockCharts.com.
With inaccurate data from StockCharts, for Tuesday’s session, it is rather difficult to analyse the session. Looking at BarChart data on the daily Elliott wave count, volume shows a steady decline as price rises over the last three sessions. The rise in price is not supported by volume, so it is suspicious. This in conjunction with a doji candlestick for Tuesday’s session offers some support to the hourly Elliott wave count which expects a pullback to test support here.
GDX
DAILY CHART
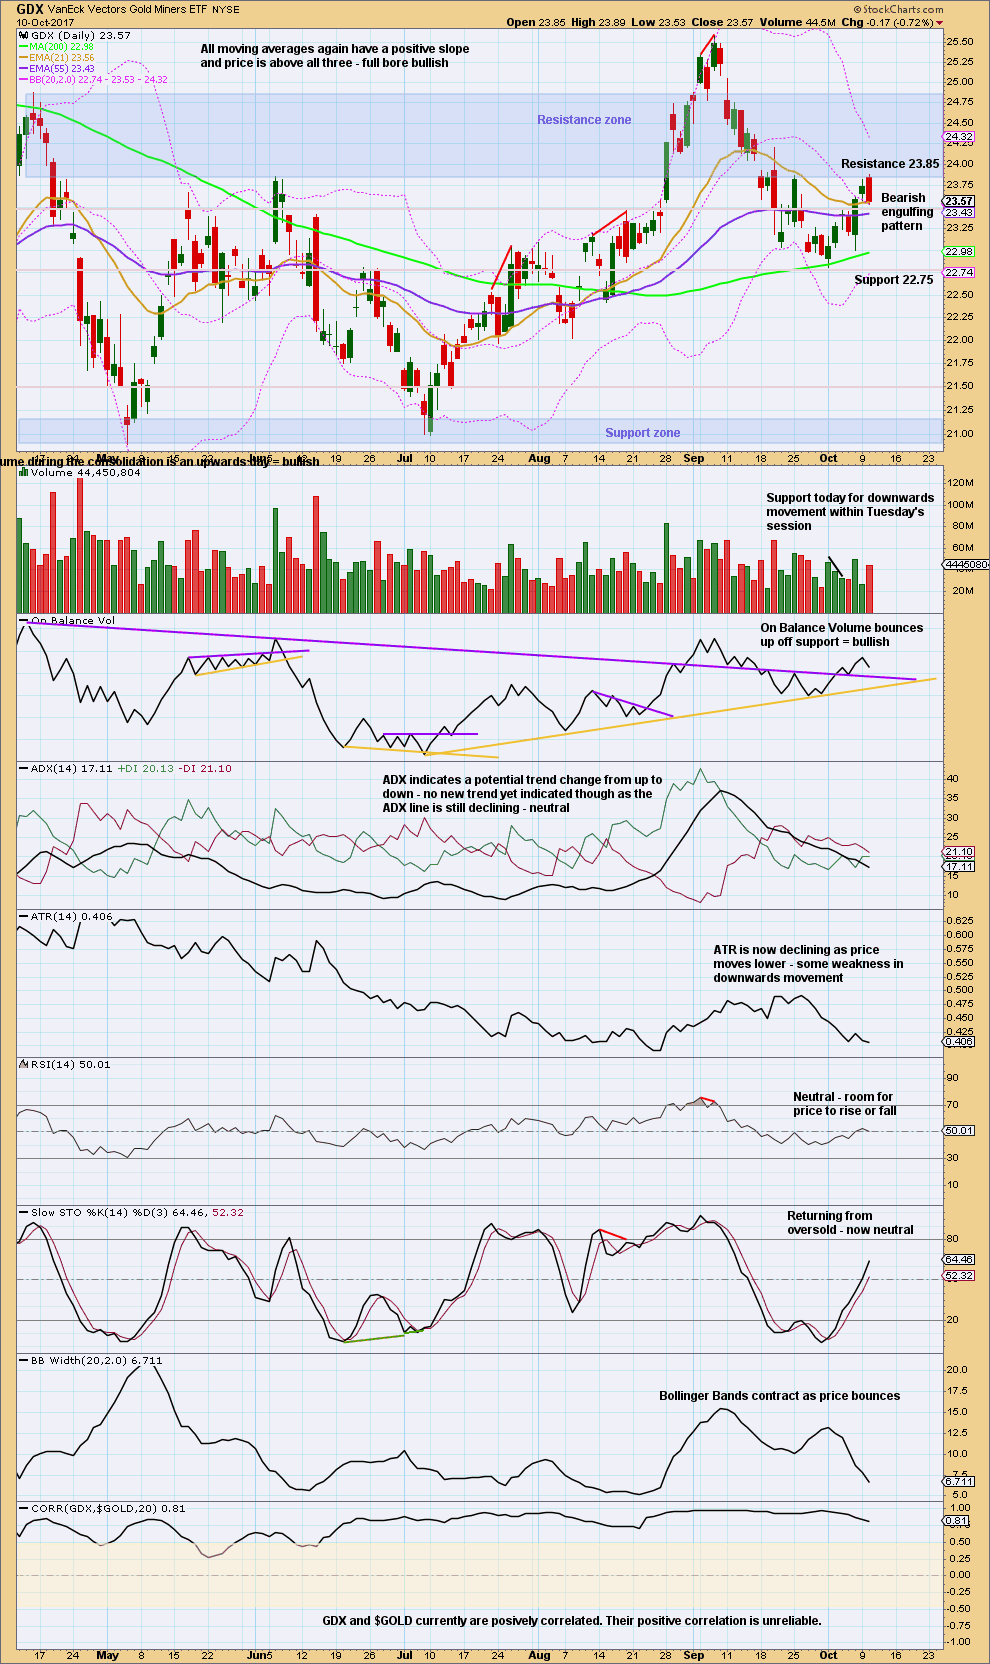
Click chart to enlarge. Chart courtesy of StockCharts.com.
Bearish: The bearish engulfing candlestick for Tuesday, support from volume for a day with the balance of volume downwards, and Bollinger Bands.
Neutral: ADX, RSI and Stochastics.
Bullish: ATR (only slightly bullish).
Overall, give weight today to the reversal candlestick pattern. Expect either downwards or sideways movement tomorrow.
Published @ 12:02 a.m. EST on 11th October, 2017.
Hourly chart update:
Good morning everybody! I hope everyone is having a lovely day.
Again price has not seen a decent pullback. It will come… but just not yet.
Hopefully StockCharts have some accurate data for me to analyse today, that would make my job a bit easier. If there’s weakness in this upwards move then we may see a pullback… if not, then this hourly count may be correct.
This count is subject to change once I can see StockCharts data for the session.
Minute ii may have been a very shallow combination: zigzag – X – flat. A common structure, but uncommon for a second wave to be this shallow. Especially the first second wave in a new trend.
Gold Ichimoku Daily Analysis
Data as at 4:30 am ET, October 11
=============================
Gold prices are trading above the short-term downtrend line (shown in orange). Currently, prices are trading above both the tenkan-sen and the kijun-sen in the 4-hour Ichimoku chart. The tenkan-sen remains above the kijun-sen. This is the first bullish sign.
Gold prices are inside the cloud, and trying to break above it. The kumo resistance is 1290.86. The 38% Fibonacci retracement resistance is found at 1297. So, prices need to break above 1297-1300 in order for the short-term trend to change to bullish again.
Should prices fail to break the kumo resistance, and fall, then the support levels are 1277.78 (bottom cloud boundary) followed by 1277.30 (kijun-sen). A little lower, and prices will test the orange downtrend line. I don’t expect prices to break down below the downtrend line, and a bounce should develop from there towards at least 1300. Should this come to pass, it would provide at least a small window of opportunity.
On the fundamental level, the Fed minutes due for release later in the day would be a driver for gold prices. Volatility could arise if there had been a range of views on inflation, financial stability, and the implications for rate hike policies. A hawkish stance would most likely push gold prices lower. Furthermore, the concession made by the Catalan president, as regards the continuation of independence, was deemed bearish to gold as uncertainty recedes. It ought to be an interesting day today, so we’ll just monitor events unfolding, and trade accordingly.
Thank you very much Alan for this commentary.
It does look like Gold is turning… but how high is it going to go? This is where my EW analysis begins to diverge for the two counts, and where your Ichimoku analysis adds that extra depth for us all 🙂
Lara, in the chart for GDX, you have indicated that ” GDX and $GOLD currently are positively correlated. Their positive correlation is unreliable “. What does the second sentence about correlation being unreliable mean, please? Thanks.
This post will answer your question.
Thank you very much, Lara. Wonderful. Appreciate your help.
David, you may also find this longer term look helpful. For the most part there is a positive correlation between Gold and GDX (Green area). Within the Green area, the Correlation moves from strong (+1) to weak (+.05).
Then, every once in a while, the positive Correlation fails. These times are noted on the chart when the Correlation line moves into the Yellow area which ranges from +.05 to -.05, hence unreliable.
Meant .50 to -.50 for the no correlation zone
Thank you very much Dreamer. I appreciate your prompt help and guidance. This is superb. I am seriously intimidated by the collective knowledge of this forum members. Amazing. Once again thank you kindly.
True. I’m intimidated by the collective knowledge of my membership too!
Decades, and many of them are much more experienced than I.
My thing is only to be able to do Elliott wave. With some classic analysis.