
Analysis for the last two days has advised members to assume the trend remains the same, upwards, until proven otherwise. Friday has continued the upwards trend. A new short term target is now calculated.
Summary: The trend remains up. The short term target is at 1,320, where a deep pullback may begin.
Always use stops and invest only 1-5% of equity on any one trade.
New updates to this analysis are in bold.
Last monthly charts for the main wave count are here, another monthly alternate is here, and video is here.
Grand SuperCycle analysis is here.
The wave counts will be labelled first and second. Classic technical analysis will be used to determine which wave count looks to be more likely. In terms of Elliott wave structure the second wave count has a better fit and fewer problems.
FIRST ELLIOTT WAVE COUNT
WEEKLY CHART
Click chart to enlarge.
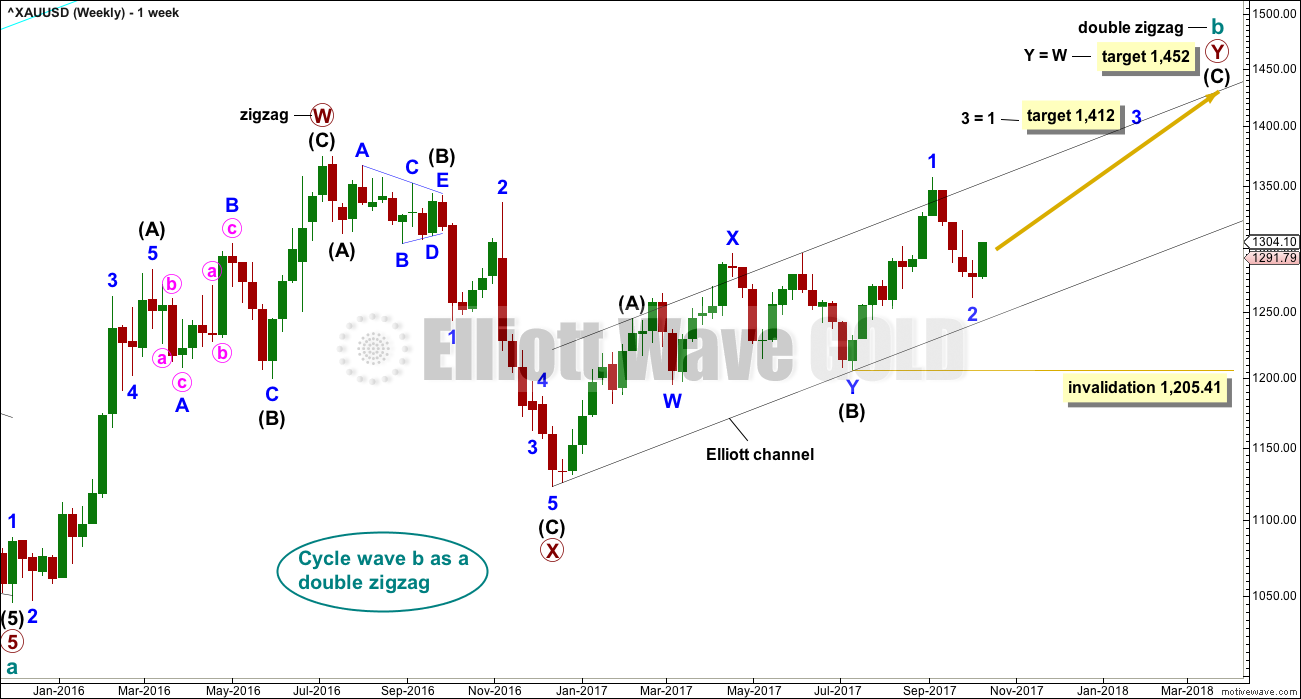
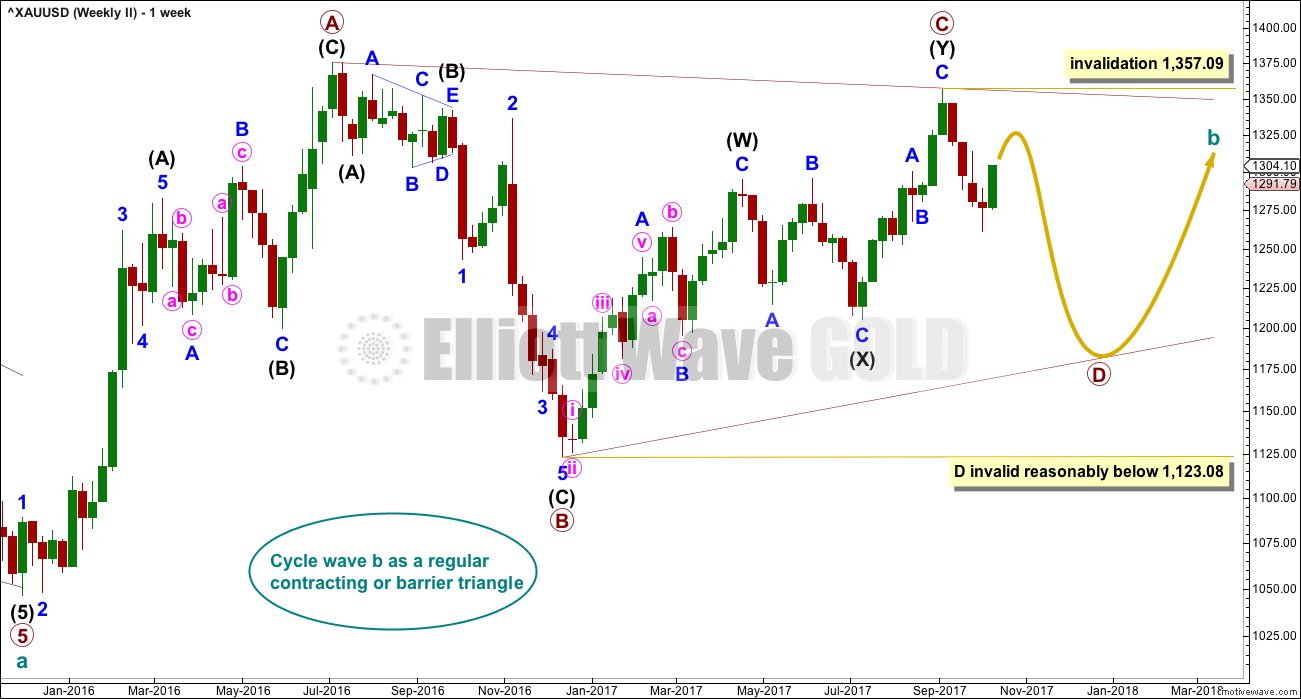
There are more than 23 possible corrective structures that B waves may take, and although cycle wave b still fits well at this stage as a triangle, it may still be another structure. This wave count looks at the possibility that it may be a double zigzag.
If cycle wave b is a double zigzag, then current upwards movement may be part of the second zigzag in the double, labelled primary wave Y.
The target remains the same.
Within intermediate wave (C), no second wave correction may move beyond the start of its first wave below 1,205.41. However, prior to invalidation, this wave count may be discarded if price breaks below the lower edge of the black Elliott channel. If this wave count is correct, then intermediate wave (C) should not break below the Elliott channel which contains the zigzag of primary wave Y upwards.
There are two problems with this wave count which reduce its probability in terms of Elliott wave:
1. Cycle wave b is a double zigzag, but primary wave X within the double is deep and time consuming. While this is possible, it is much more common for X waves within double zigzags to be brief and shallow.
2. Intermediate wave (B) within the zigzag of primary wave Y is a double flat correction. These are extremely rare, even rarer than running flats. The rarity of this structure must further reduce the probability of this wave count.
DAILY CHART
Click chart to enlarge.
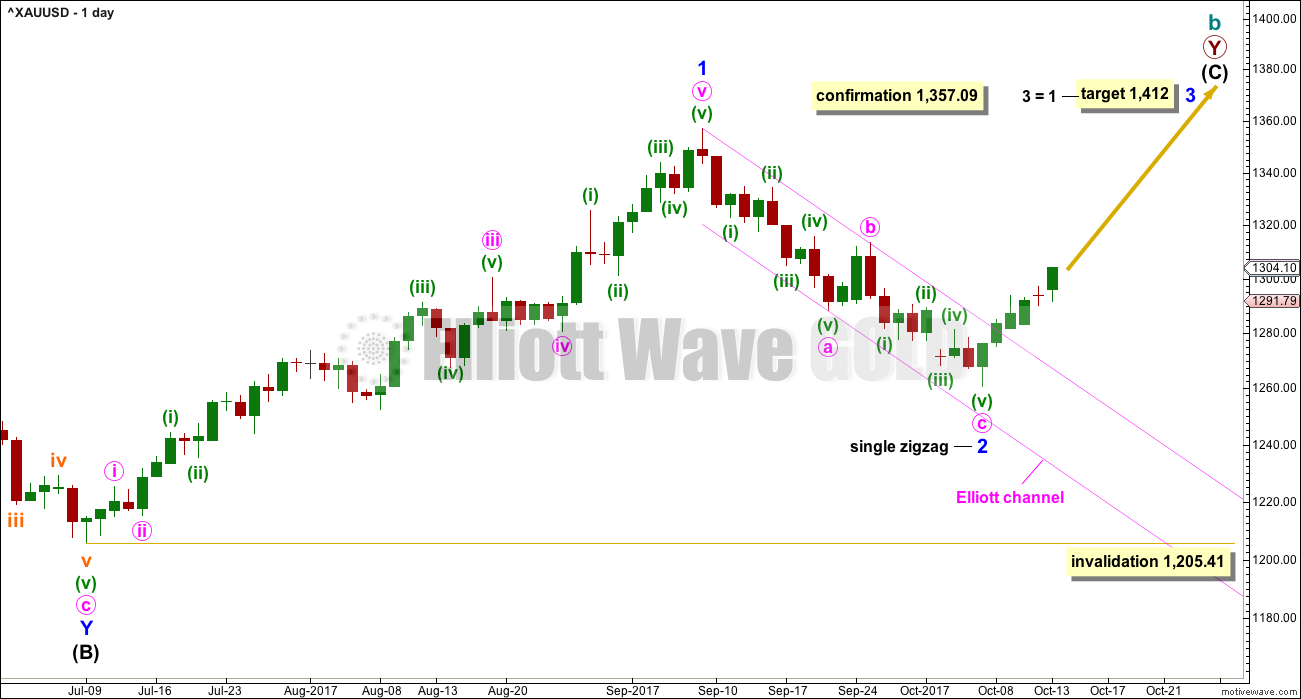
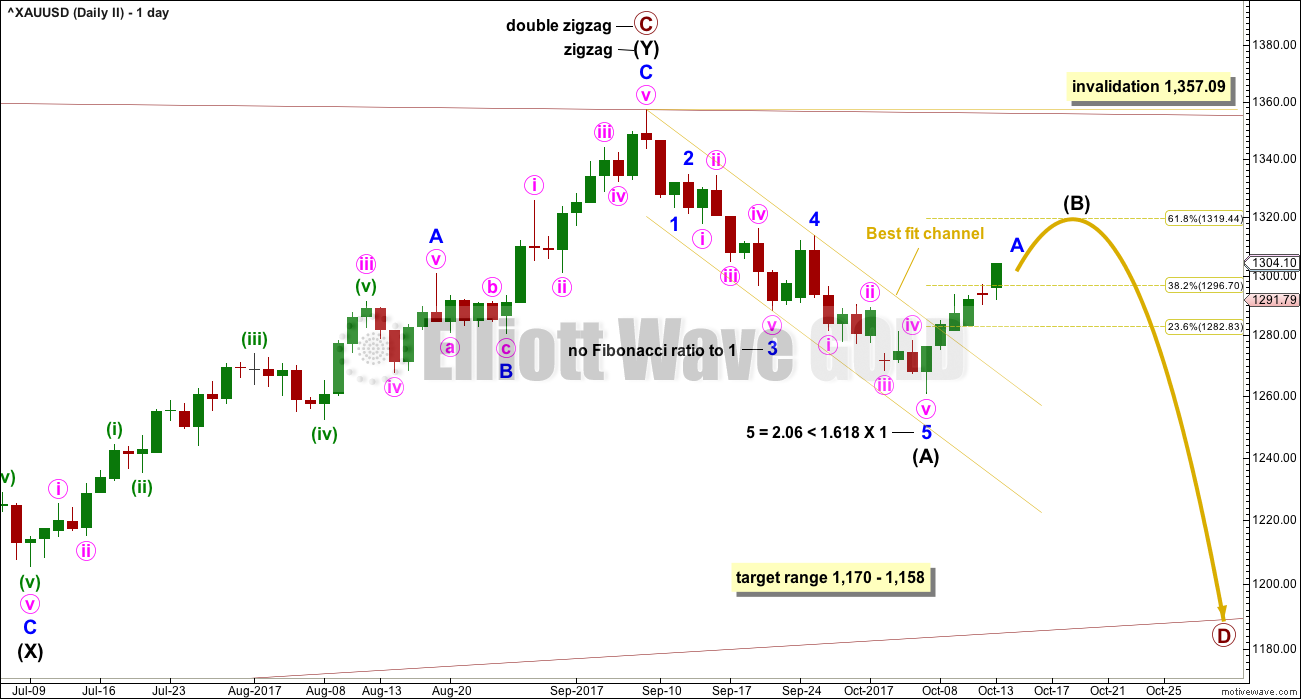
The analysis will focus on the structure of intermediate wave (C). To see details of all the bull movement for this year see daily charts here.
Intermediate wave (C) must be a five wave structure, either an impulse or an ending diagonal. It is unfolding as the more common impulse.
It is possible that minor waves 1 and now 2 may both be over. Minor wave 2 may have ended very close to the 0.618 Fibonacci ratio. If it continues lower, then minor wave 2 may not move beyond the start of minor wave 1 below 1,205.41.
Minor wave 1 lasted 44 days and minor wave 2 may have lasted 20 days, just one short of a Fibonacci 21.
It is of some concern now that minor wave 3 appears to be starting out rather slowly. This is somewhat unusual for a third wave and offers some support now to the second Elliott wave count. With StockCharts data showing a steady decline in volume as price rises, this concern is now validated.
HOURLY CHART
Click chart to enlarge.
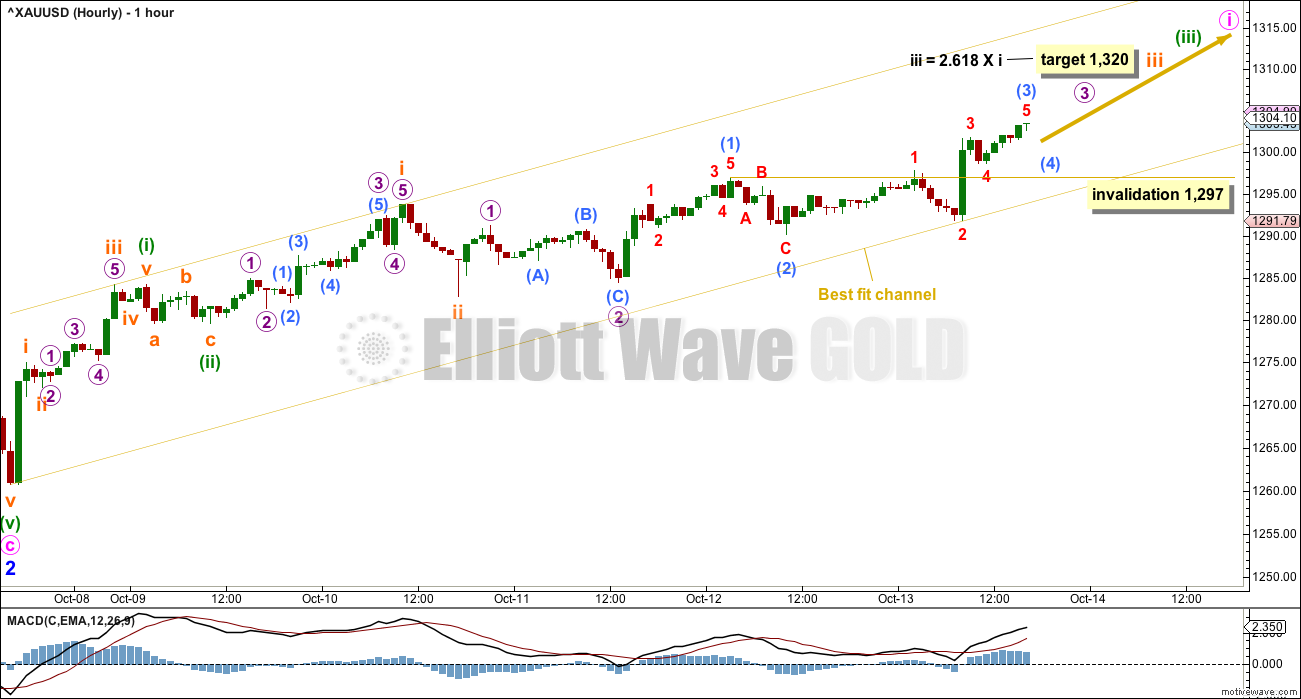
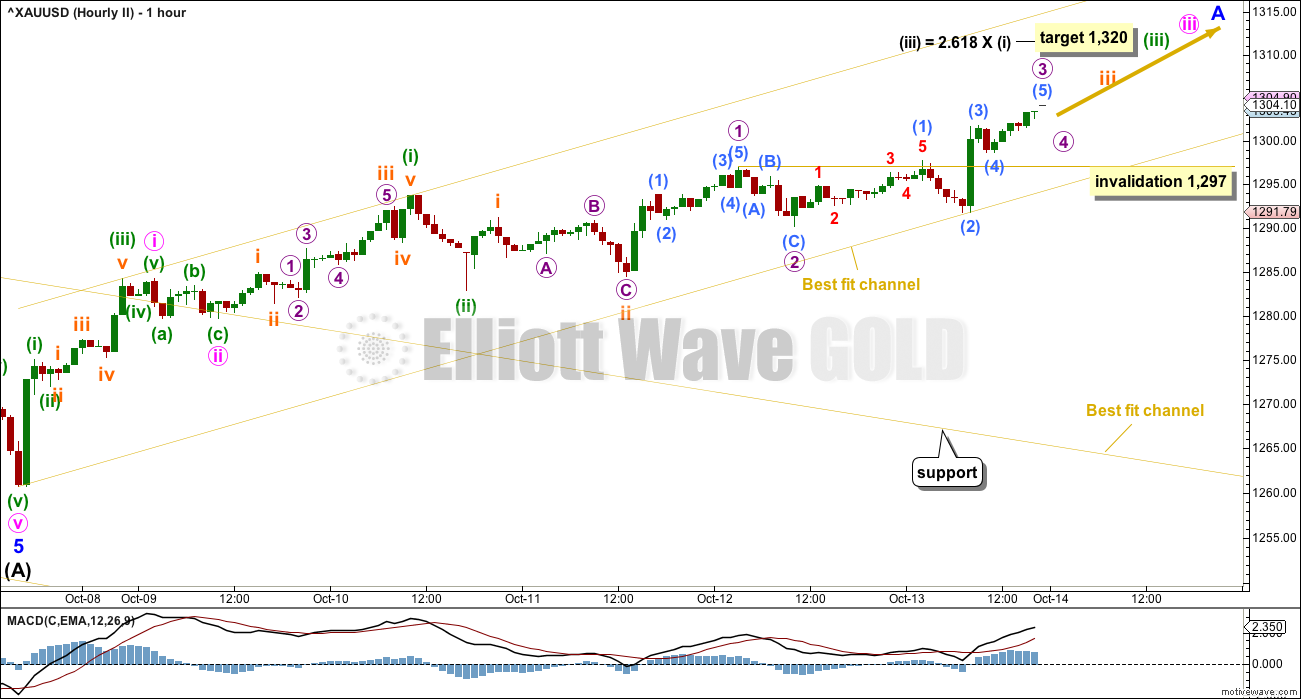
Assume the trend remains the same until proven otherwise. With upwards movement continuing and some support from volume for Friday’s session, this is now the main wave count.
A five up is now incomplete. The middle of a third wave may have passed during Friday’s session.
Within the middle of the third wave, sub-micro wave (4) may not move into sub-micro wave (1) price territory below 1,297.
When subminuette waves iii and iv are complete, then a target may be calculated for minuette wave (iii) to end. When minuette waves (iii) and (iv) are complete, then a final target may be calculated for minute wave i to end.
If price makes a new low below 1,297, then the degree of labelling within sub-micro wave (3) may be moved down one degree. Another first wave up may be complete and downwards movement would then be labelled as another second wave correction, which may not move beyond the start of its first wave below 1,290.11.
A new low below 1,290.11 would see the alternate hourly wave count below preferred.
ALTERNATE HOURLY CHART
Click chart to enlarge.
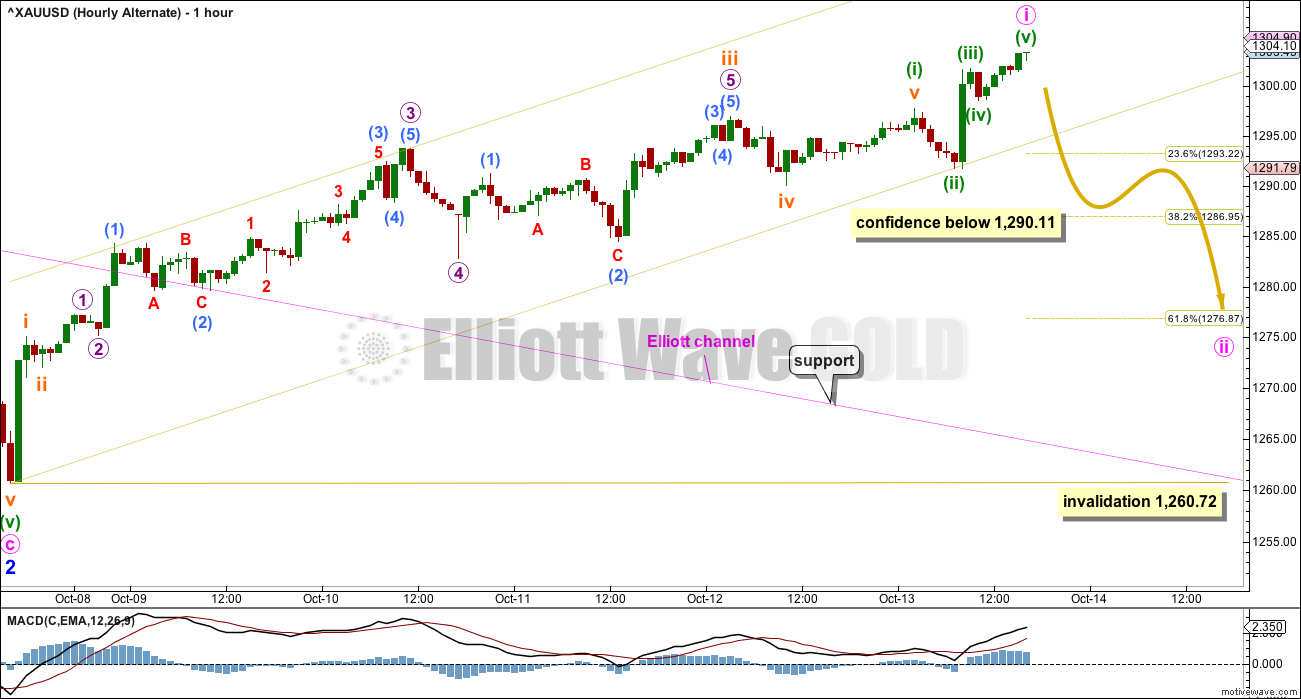
It is possible to see a five up complete at Friday’s high. The channel is drawn in the same way.
If a five up is complete, then a three down should follow. The most likely target for minute wave ii would be the 0.618 Fibonacci ratio of minute wave i, but it may not be low enough if this target is wrong. The first second wave correction within a new trend is commonly very deep for Gold.
Minute wave ii may not move beyond the start of minute wave i below 1,260.72.
SECOND ELLIOTT WAVE COUNT
WEEKLY CHART
Click chart to enlarge.
It is still possible that cycle wave b is unfolding as a regular contracting or barrier triangle.
Within a triangle, one sub-wave should be a more complicated multiple, which may be primary wave C. This is the most common sub-wave of the triangle to subdivide into a multiple.
Intermediate wave (Y) now looks like a complete zigzag at the weekly chart level.
Primary wave D of a contracting triangle may not move beyond the end of primary wave B below 1,123.08. Contracting triangles are the most common variety.
Primary wave D of a barrier triangle should end about the same level as primary wave B at 1,123.08, so that the B-D trend line remains essentially flat. This involves some subjectivity; price may move slightly below 1,123.08 and the triangle wave count may remain valid. This is the only Elliott wave rule which is not black and white.
Finally, primary wave E of a contracting or barrier triangle may not move beyond the end of primary wave C above 1,295.65. Primary wave E would most likely fall short of the A-C trend line. But if it does not end there, then it can slightly overshoot that trend line.
Primary wave A lasted 31 weeks, primary wave B lasted 23 weeks, and primary wave C lasted 38 weeks.
The A-C trend line now has too weak a slope. At this stage, this is now a problem for this wave count, the upper A-C trend line no longer has such a typical look.
Within primary wave D, no part of the zigzag may move beyond its start above 1,357.09.
DAILY CHART
Click chart to enlarge.
This second wave count expects the new wave down may be deeper and longer lasting than the first wave count allows for.
A common length for triangle sub-waves is from 0.8 to 0.85 the length of the prior wave. Primary wave D would reach this range from 1,170 to 1,158.
If primary wave C is correctly labelled as a double zigzag, then primary wave D must be a single zigzag.
Within the single zigzag of primary wave D, intermediate wave (A) is labelled as a complete impulse.
Intermediate wave (A) lasted 20 days, just one short of a Fibonacci 21. Intermediate wave (B) may be about the same duration, so that this wave count has good proportions, or it may be longer because B waves tend to be more complicated and time consuming.
Intermediate wave (B) may be a sharp upwards zigzag, or it may be a choppy overlapping consolidation as a flat, triangle or combination. At this stage, it looks most likely to be incomplete because an intermediate degree wave should last weeks. At its conclusion intermediate wave (B) should have an obvious three wave look to it here on the daily chart.
HOURLY CHART
Click chart to enlarge.
This hourly chart is the same as the hourly chart for the first wave count. This is because 1-2-3 of an unfolding impulse (hourly chart for the first wave count) will subdivide 5-3-5, which is exactly the same as A-B-C of a zigzag.
Subdivisions are the same, the target is now the same, and the invalidation point remains the same.
TECHNICAL ANALYSIS
WEEKLY CHART
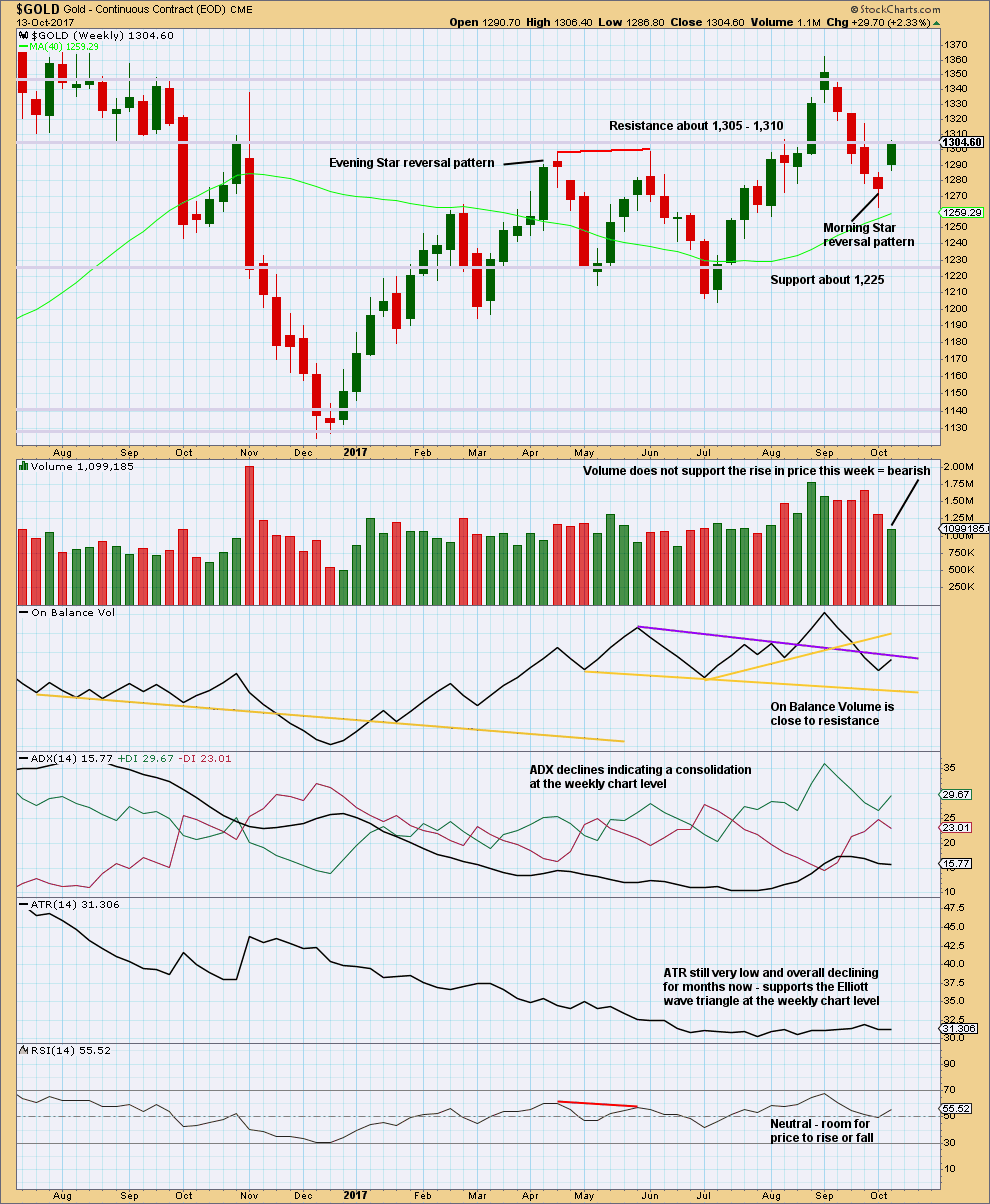
Click chart to enlarge. Chart courtesy of StockCharts.com.
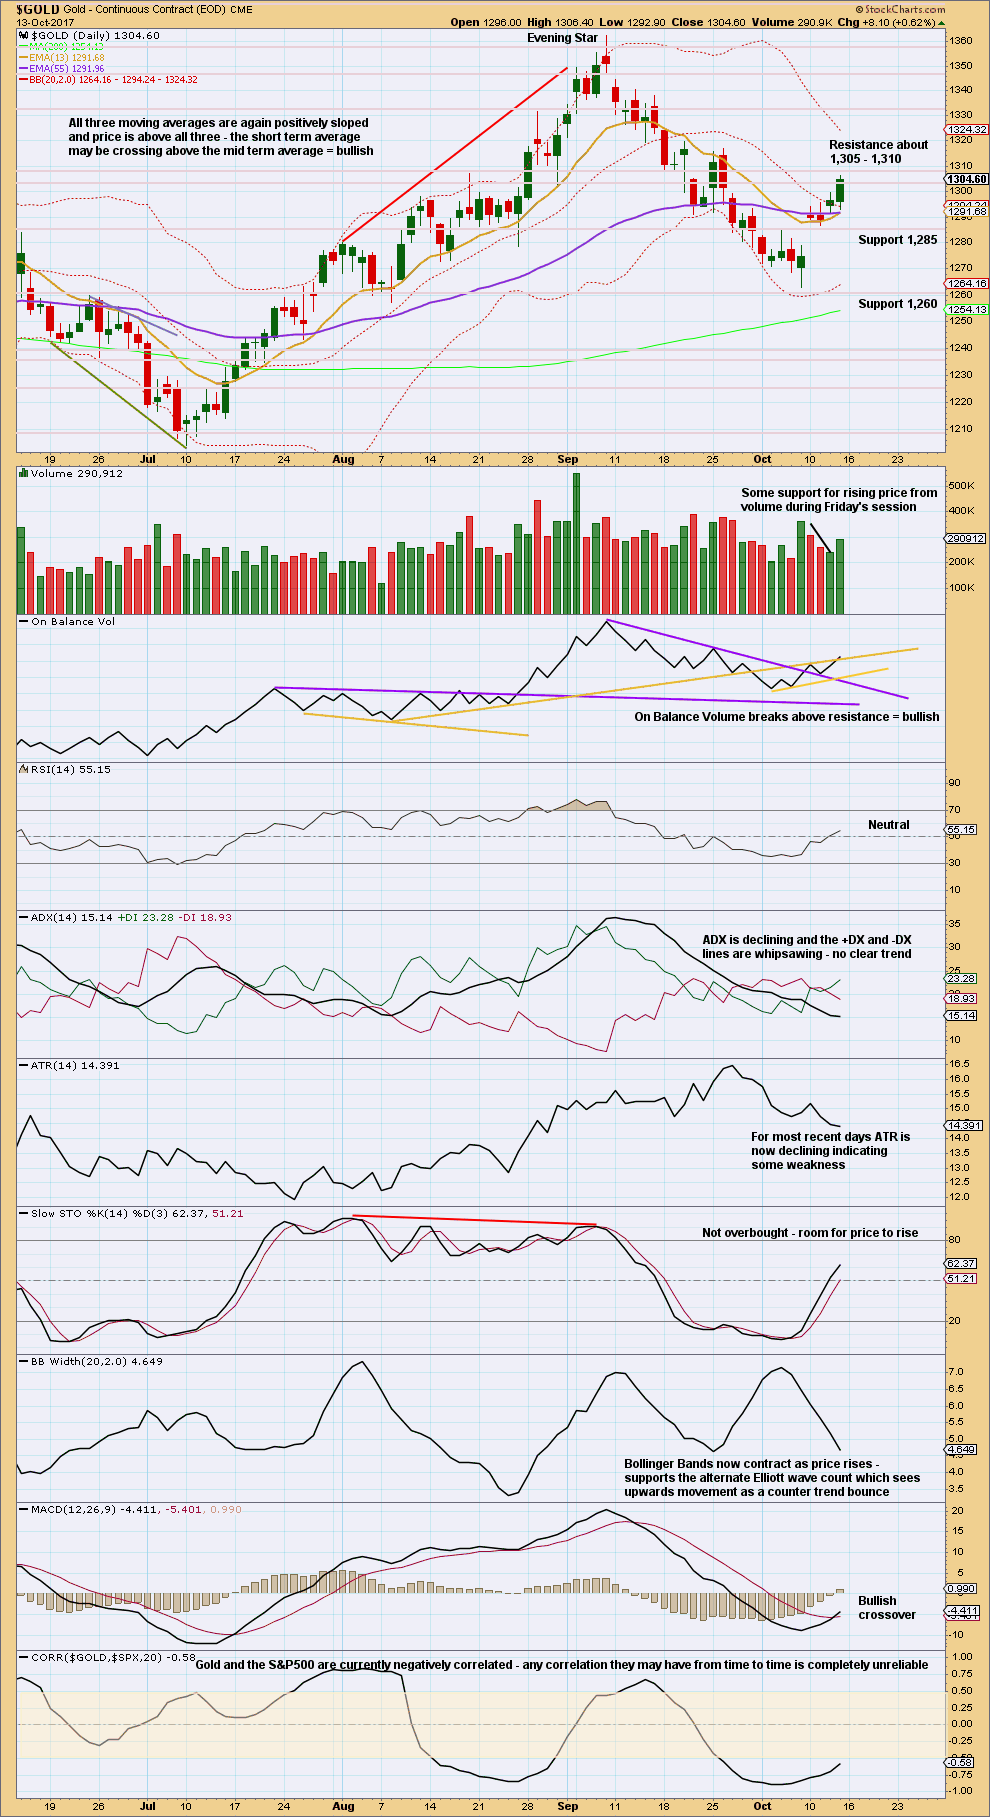
This last weekly candlestick completes a Morning Star reversal pattern, which is bullish.
Without support from volume for upwards movement though, it should be suspicious. The reversal pattern may signify a new sideways trend or a short lived upwards bounce.
Resistance at On Balance Volume may halt the rise in price.
DAILY CHART
Click chart to enlarge. Chart courtesy of StockCharts.com.
There is strong resistance about 1,305 to 1,310.
Some support from volume for Friday’s upwards movement along with a bullish signal now from On Balance Volume offers support to the new main hourly Elliott wave count.
MACD is now bullish.
There is still some weakness in this upwards movement (which supports the second Elliott wave count and sees it as a B wave) due to declining ATR, volume overall remaining light, and Bollinger Bands still contracting.
GDX
DAILY CHART
Click chart to enlarge. Chart courtesy of StockCharts.com.
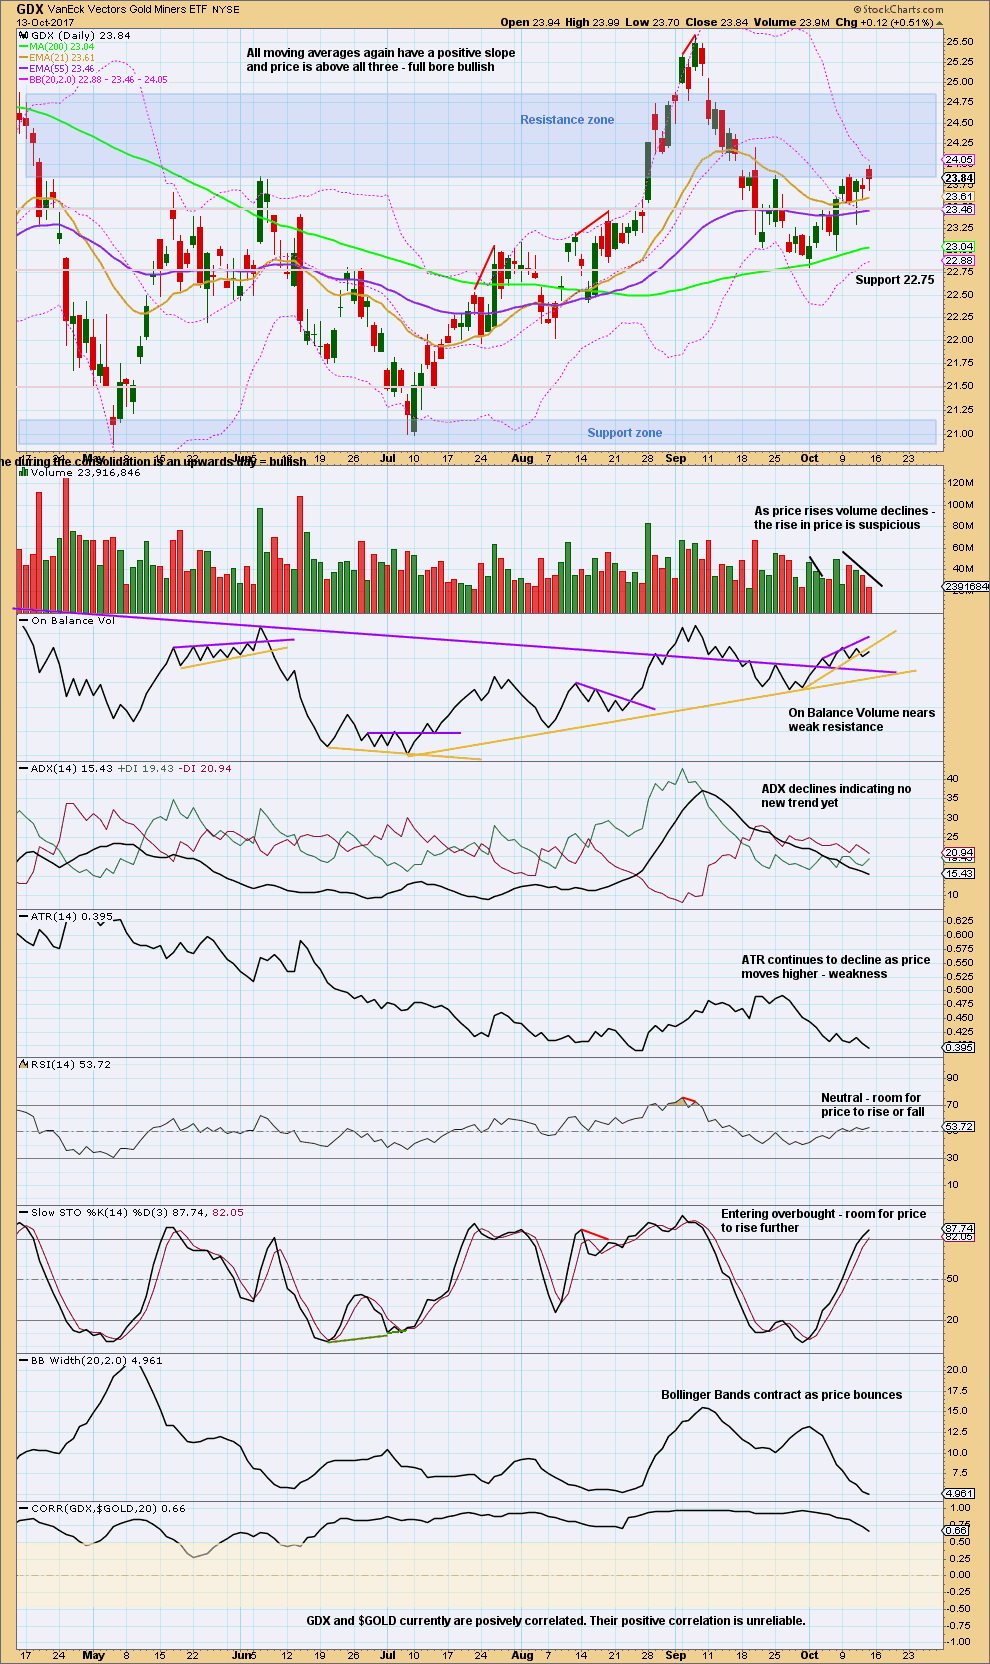
Long lower wicks on the last daily candlestick and one two days prior are bullish. Price is back within the resistance zone, but Stochastics is not yet fully overbought and exhibits no divergence yet with price; there is room for price to rise further.
There is weakness in this upwards movement though due to volume overall remaining light, Bollinger Bands contracting, and ATR continuing to decline. The rise in price is suspicious; this may be a B wave.
Published @ 07:13 p.m. EST on 14th October, 2017.
It’s looking like finally the pullback we were waiting for last week has arrived. We’d still need to see a new low below 1,290.11 for full confidence. So far these red candlesticks are looking convincing, and the channel about prior upwards movement has been very clearly breached, so the probability of a multi day pullback here is high.
I’ll be waiting patiently for this to end to enter long.
If the second wave count is right then this could be the start of a B wave within a B wave; minor B within intermediate (B). That’s a horrible trading opportunity. B waves within B waves really are the worst. Most often they’re choppy overlapping and very complicated.
OR
it could be a simple zigzag down for a second wave correction
And it’s impossible for me to tell you with any level of confidence which scenario; consolidation or quick pullback, it’s going to be. I don’t think anyone could know that.
So if any members want to trade this to the downside please reduce exposure to 1-3% of equity, and be careful where you place stops. Be prepared for losses. Only very experienced members should be trading a smaller move against the trend.
Hello Lara, When you get chance please throw some light on Copper as where its headed to? Thank you.
Dreamer, Really appreciate your charts.
Sure. Will do just a classic TA of Copper for you, added to the end of the next analysis perhaps.
Rambus sees bullish gold possibilities
Public post
https://rambus1.com/2017/10/15/the-bullish-chartology-for-gold-public-version/
EW analysis forecast sees the bull much in advance of Chartology.
Lara’s EW analysis has been forecasting the current target of 1452 for many months. Sorry Rambus you have been bear/bullish like pendulum several times during the same period!!!!!
Bravo EW analysis. !!
Can someone help me with the math?
On the hourly chart
iii = 2.618 i = 1320??
Thanks
vbase,
First you need access to the same database as Lara. She uses Barchart, so go to Barchart.com, open a chart of ^xauusd and set the parameters for an hourly (60min) candle chart.
Then using Lara’s hourly chart as a guide find the top of subminuette 1 (orange) [1,293.76] and the bottom of subminuette 1 [1,279.62]. Hover your mouse over the candles to get the exact values. You’ll also need to find the bottom of subminuette 2 [1,282.80]
Now that you have the numbers, here’s the math:
1,293.76-1,279.62 = 14.14
[Top 1 – Bottom 1 = Length 1]
14.14 x 2.618 = 37.02
[Length 1 x 2.618 = Target for length of Subminuette 3]
1,282.80 + 37.02 = 1,319.82 (Lara rounded to 1,320)
[Bottom of Subminuette 2 + Target for length of 3 = Target for Subminuette 3]
As you can see, it takes a little time, but it gets easier with practice. Hope this helps.
As you can see, you need to like math and details to use EW effectively. Maybe that’s why EW is so underrated…
Thank you Dreamer!
It will be easier if Lara’s chart service has option of “price label” similar to Stockcharts.
But at the same time EW chart will get too busy also along with the notations of wave counts.
Thanks Dreamer.
It does. I can make the price points visible.
When I’m using MW I’m able to click on the degree of labelling and it shows me the price points and the length of each wave. I use that to quickly calculate targets (which I do old school, with an actual calculator).
Maybe for a video later this week I’ll do a “how to” for Motive Wave. It does save me a LOT of time and I really do love it.
And this bigger picture GDX chart is also a favorite as it highlights the Rounded Bottom pattern that’s forming. A move to at least the top of the pattern @ 31.79 is expected.
I captured this statement from a recent free Jeffrey Kennedy video. Seems to fit what we are seeing in Gold and GDX at the moment,
From Jeffrey Kennedy video (EWI) 10/06/17
“Whenever a commodity market puts in a very significant long term top, these tops tend to be “V tops”. Market moves up very fast and it also falls very fast. Whenever a commodity market puts in a significant low, it tends to form what we refer to as a “rounding bottom”. So some of the consolidation that we’ve seen not only this year but going back into 2016, is indicative of a commodity market trying to put in a significant low. This is why much of the price action in Crude Oil or even Gold has been significantly sideways for the last 12 to 18 months. But I think as we move into 2018, the volatility is going to increase dramatically, but to the upside”
https://www.tradingview.com/x/ZAWASsCK/
Dreamer, thank you for this post. This is good. Could you tell us how to get these free videos, if you don’t mind please? If you would prefer not to, no worries.
Just sign up as a free member at Elliottwave.com
I get some good tips from them, but when it comes to actual EW counts and detail, nobody does it better than Lara…
Thank you Dreamer, much appreciated. I shall do that today.
And, yes, Lara is great with EWT. The meticulous counts, clear concepts AND she is a great teacher too.
Thanks David 🙂
I have a post grad diploma in teaching. I used to teach high school science.
LOL when I first let members know that Verne thought he could hear the teacher in my voice. Yep.
It’s been a couple of months since I shared this chart. It’s one of my favorites as I think it highlights the symmetry and why I think there’s a high likelihood that price will test the top of this channel again before rolling over.
A move back above last months 1,357.50 high will be the first step toward the target.
https://www.tradingview.com/x/aCgvqvpH/
Dreamer thank you again for posting your charts. I’m planning on doing a GDX analysis.. I wanted to get it done this weekend but I’ve run out of time. Will aim to get it done my Tuesday / Wednesday. Lets see if I can see any new alternates…
Sounds good
Zoomed in hourly look for GDX:
https://www.tradingview.com/x/mKhVGZt3/
So as you know, I had 2 bullish ideas from the low of 22.81, a nested 1-2, 1-2 or a leading expanding diagonal.
Since Lara’s update for Gold showing most likely that Minute 1 is not over, I think the leading expanding diagonal will fit great with that count.
So expect another 2 days of up movement before a deep retrace. The minimum target for GDX so that the 5th wave is longer than the 3rd wave (EW rule) is above 24.19, although we should expect it will go a little higher than that. 5th waves of ExpED’s usually end just short of the trendline.
https://www.tradingview.com/x/shEaSxts/
Thank you dreamer for this update… Would you consider the possibility that right now GDX could be in the making of minuette wave (II) green, instead of minute 2 ? considering the time it took minor wave 1(blue) to complete….It seems that it takes longer to accomplish each step….. just a thought….