
Both Elliott wave counts were expecting upwards movement to begin the new trading week, which is so far what has happened.
There is an important signal from On Balance Volume today, but it is strongly contradicted by volume for Monday’s session.
Summary: While price remains above 1,260.72, this downwards movement could still be a second wave correction that may now be complete. A third wave up may begin here.
If price makes a new low below 1,260.72, then the second Elliott wave count would be strongly indicated. A mid term upwards swing would still be expected to begin very soon. The target at this stage would be about 1,305 – 1,310.
Reduce risk at this time to only 1-3% of equity on any one trade. Always trade with stops.
New updates to this analysis are in bold.
Last monthly charts for the main wave count are here, another monthly alternate is here, and video is here.
Grand SuperCycle analysis is here.
The wave counts will be labelled first and second. Classic technical analysis will be used to determine which wave count looks to be more likely. In terms of Elliott wave structure the second wave count has a better fit and fewer problems.
FIRST ELLIOTT WAVE COUNT
WEEKLY CHART
Click chart to enlarge.
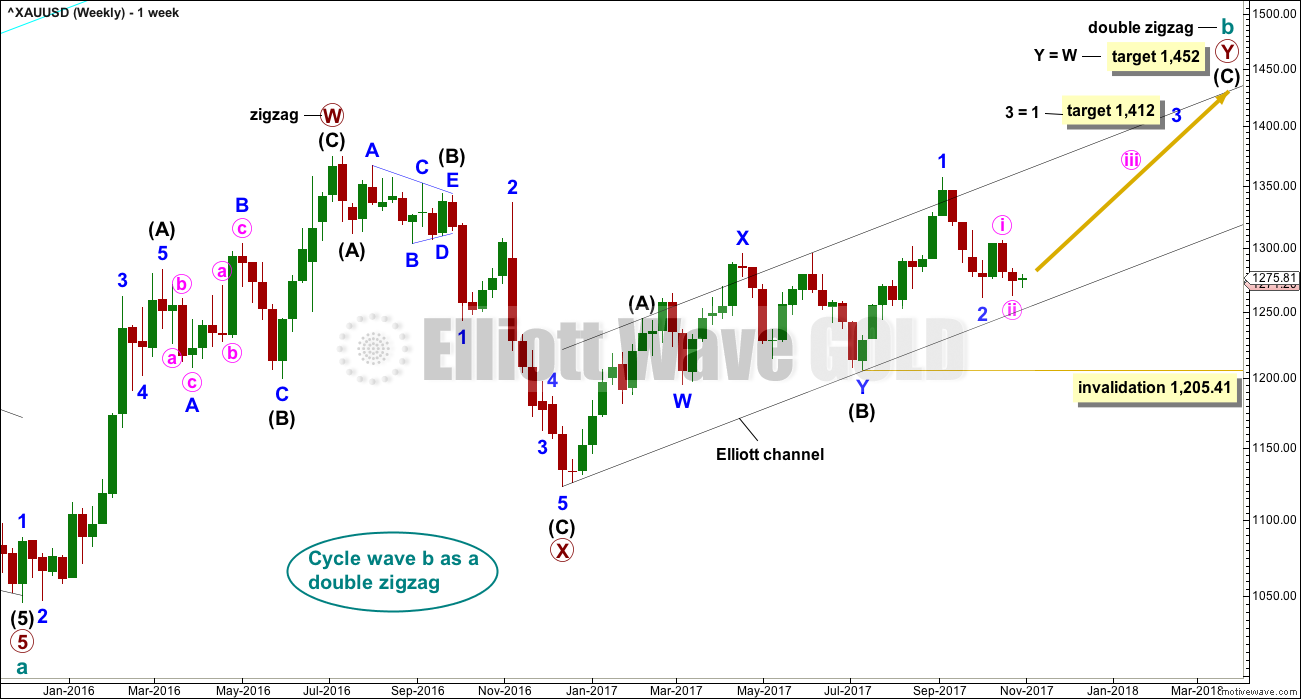
There are more than 23 possible corrective structures that B waves may take, and although cycle wave b still fits well at this stage as a triangle, it may still be another structure. This wave count looks at the possibility that it may be a double zigzag.
If cycle wave b is a double zigzag, then current upwards movement may be part of the second zigzag in the double, labelled primary wave Y.
The target remains the same.
Within intermediate wave (C), no second wave correction may move beyond the start of its first wave below 1,205.41. However, prior to invalidation, this wave count may be discarded if price breaks below the lower edge of the black Elliott channel. If this wave count is correct, then intermediate wave (C) should not break below the Elliott channel which contains the zigzag of primary wave Y upwards.
There are now three problems with this wave count which reduce its probability in terms of Elliott wave:
1. Cycle wave b is a double zigzag, but primary wave X within the double is deep and time consuming. While this is possible, it is much more common for X waves within double zigzags to be brief and shallow.
2. Intermediate wave (B) within the zigzag of primary wave Y is a double flat correction. These are extremely rare, even rarer than running flats. The rarity of this structure must further reduce the probability of this wave count.
3. Although intermediate wave (C) should be continuing so that primary wave Y ends substantially above the end of primary wave W, the duration and depth of minor wave 2 within it now looks to be too large at the weekly time frame.
DAILY CHART
Click chart to enlarge.
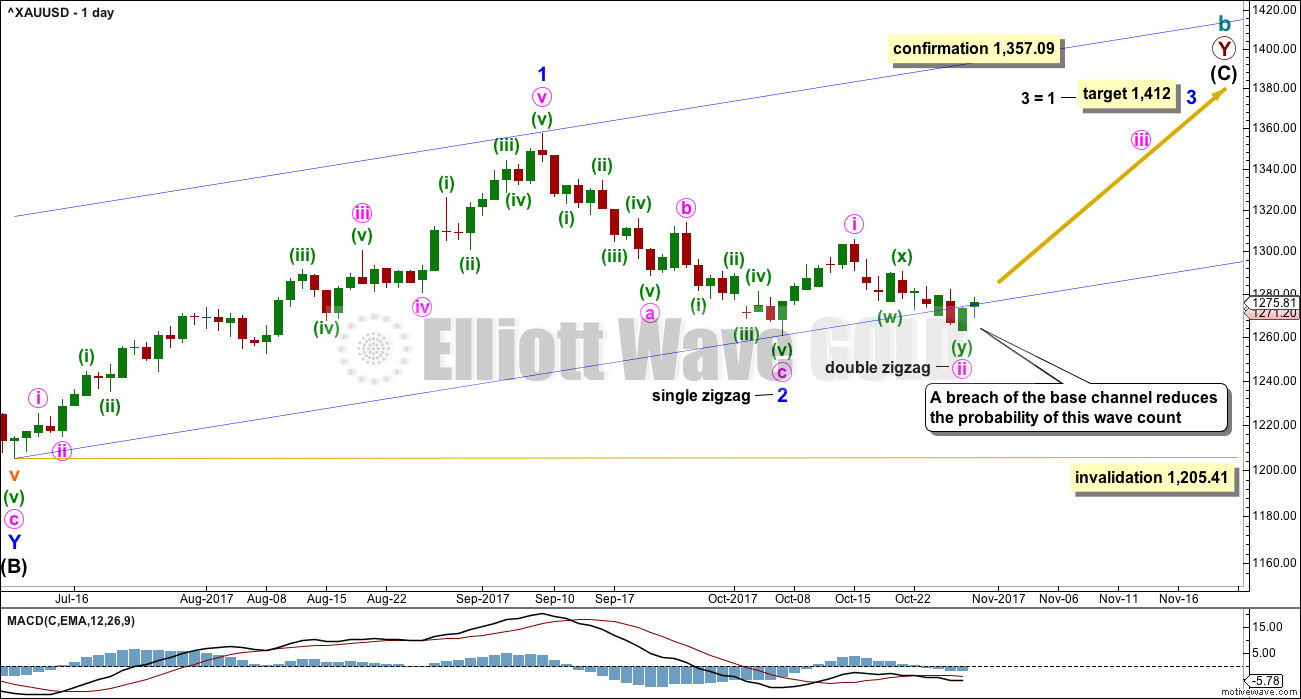
The analysis will focus on the structure of intermediate wave (C). To see details of all the bull movement for this year see daily charts here.
Intermediate wave (C) must be a five wave structure, either an impulse or an ending diagonal. It is unfolding as the more common impulse.
It is possible that minor waves 1 and now 2 may both be over. Minor wave 2 may have ended very close to the 0.618 Fibonacci ratio. If it continues lower, then minor wave 2 may not move beyond the start of minor wave 1 below 1,205.41.
Minor wave 1 lasted 44 days and minor wave 2 may have lasted 20 days, just one short of a Fibonacci 21.
It is of some concern now that minor wave 3 appears to be starting out rather slowly and that minute wave ii within it is now a very deep correction.This is somewhat unusual for a third wave and offers some support now to the second Elliott wave count. With StockCharts data showing a steady decline in volume as price rises, this concern is validated.
A base channel is added to minor waves 1 and 2. If this wave count is correct, then lower degree second wave corrections should find support at the lower edge of the base channel. Friday’s candlestick is below the base channel, which now reduces the probability of this wave count.
Attention now turns to the structure of minute wave ii. Minute wave ii may now be over as a double zigzag structure.
It is again of concern that upwards movement to begin this new trading week does not have support from volume. The start of a third wave up at two degrees should be a strong movement.
HOURLY CHART
Click chart to enlarge.
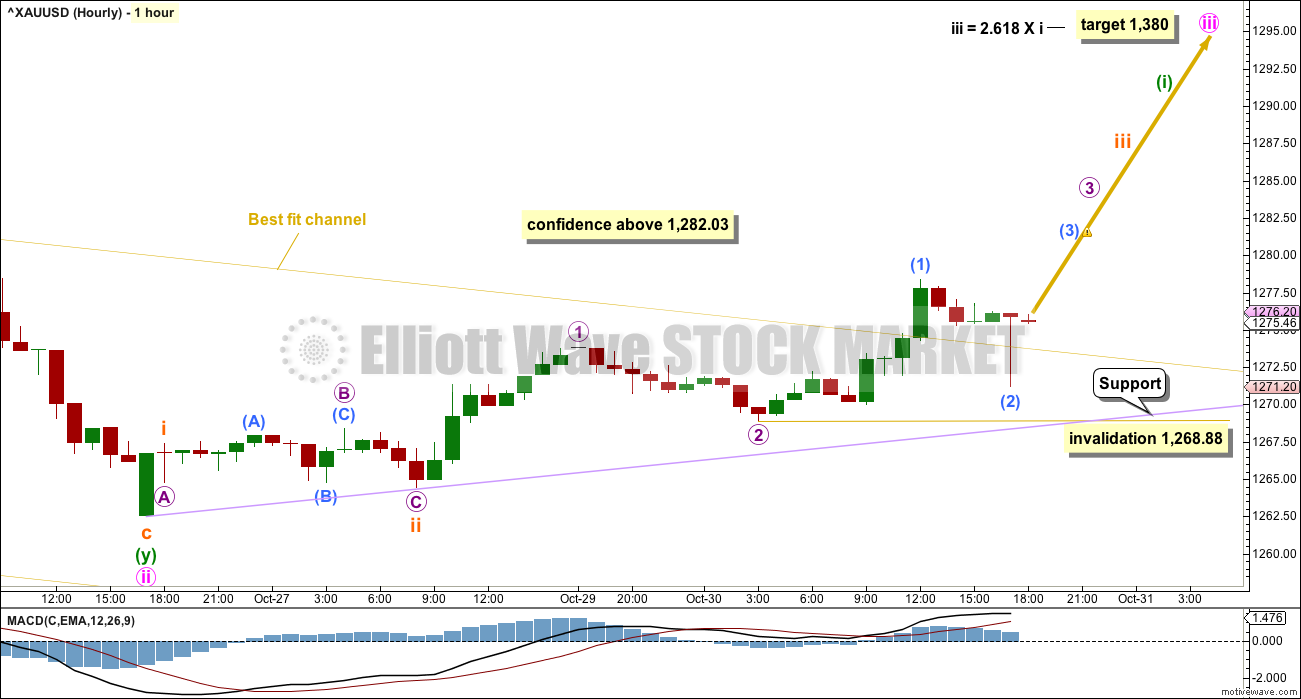
If minute wave ii is over as a very deep double zigzag, then it may have lasted a Fibonacci eight days.
Because minute wave ii here is so deep, the appropriate Fibonacci ratio to use to calculate a target for minute wave iii is 2.618.
Minute wave iii may only subdivide as a five wave impulse upwards. The first five up for minuette wave (i) looks incomplete. It may have begun with three overlapping first and second waves. This wave count now expects to see some increase in upwards momentum over the next 24 hours.
Sub-micro wave (2) may not move beyond the start of sub-micro wave (1) below 1,269.46.
Along the way up, corrections should now find strong support at the lilac trend line. This line is drawn from the start of minute wave iii to the first swing low of subminuette wave ii.
SECOND ELLIOTT WAVE COUNT
WEEKLY CHART

Click chart to enlarge.
It is still possible that cycle wave b is unfolding as a regular contracting or barrier triangle.
Within a triangle, one sub-wave should be a more complicated multiple, which may be primary wave C. This is the most common sub-wave of the triangle to subdivide into a multiple.
Intermediate wave (Y) now looks like a complete zigzag at the weekly chart level.
Primary wave D of a contracting triangle may not move beyond the end of primary wave B below 1,123.08. Contracting triangles are the most common variety.
Primary wave D of a barrier triangle should end about the same level as primary wave B at 1,123.08, so that the B-D trend line remains essentially flat. This involves some subjectivity; price may move slightly below 1,123.08 and the triangle wave count may remain valid. This is the only Elliott wave rule which is not black and white.
Finally, primary wave E of a contracting or barrier triangle may not move beyond the end of primary wave C above 1,295.65. Primary wave E would most likely fall short of the A-C trend line. But if it does not end there, then it can slightly overshoot that trend line.
Primary wave A lasted 31 weeks, primary wave B lasted 23 weeks, and primary wave C lasted 38 weeks.
The A-C trend line now has too weak a slope. At this stage, this is now a problem for this wave count, the upper A-C trend line no longer has such a typical look.
Within primary wave D, no part of the zigzag may move beyond its start above 1,357.09.
DAILY CHART
Click chart to enlarge.
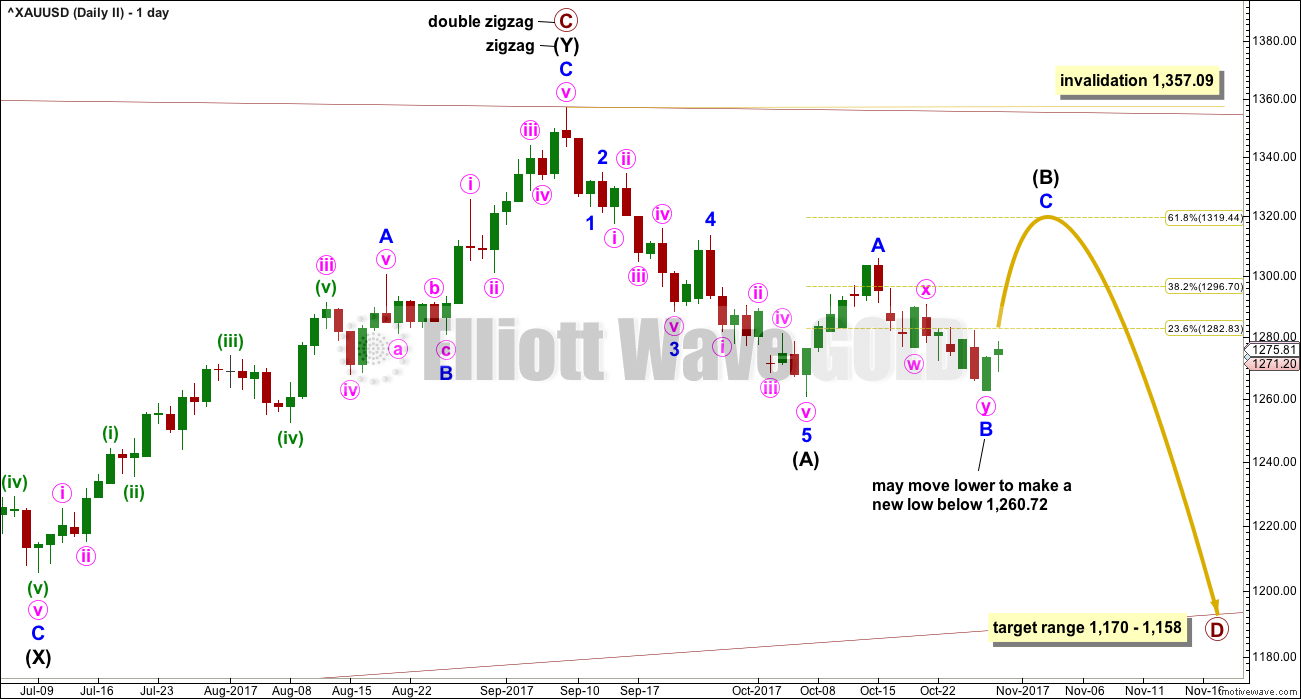
This second wave count expects the new wave down may be deeper and longer lasting than the first wave count allows for. At this stage, in the middle of this downwards wave intermediate wave (B) looks incomplete.
A common length for triangle sub-waves is from 0.8 to 0.85 the length of the prior wave. Primary wave D would reach this range from 1,170 to 1,158.
If primary wave C is correctly labelled as a double zigzag, then primary wave D must be a single zigzag.
Within the single zigzag of primary wave D, intermediate wave (A) is labelled as a complete impulse.
Intermediate wave (A) lasted twenty days, just one short of a Fibonacci twenty-one. Intermediate wave (B) may be about the same duration, so that this wave count has good proportions, or it may be longer because B waves tend to be more complicated and time consuming.
So far intermediate wave (B) has lasted sixteen sessions. The next Fibonacci number in the sequence is twenty-one which would see it continue now for another five sessions.
Intermediate wave (B) may be a sharp upwards zigzag, or it may be a choppy overlapping consolidation as a flat, triangle or combination. At this stage, it looks most likely to be incomplete because an intermediate degree wave should last weeks. At its conclusion intermediate wave (B) should have an obvious three wave look to it here on the daily chart.
Minor wave B may be complete here or close to completion as a double zigzag.
Minor wave A will subdivide as either a five wave impulse or a three wave zigzag. If it is seen as a zigzag, then the whole structure for intermediate wave (B) may be a flat correction, which would allow for minor wave B to move below the start of minor wave A at 1,260.72.
HOURLY CHART
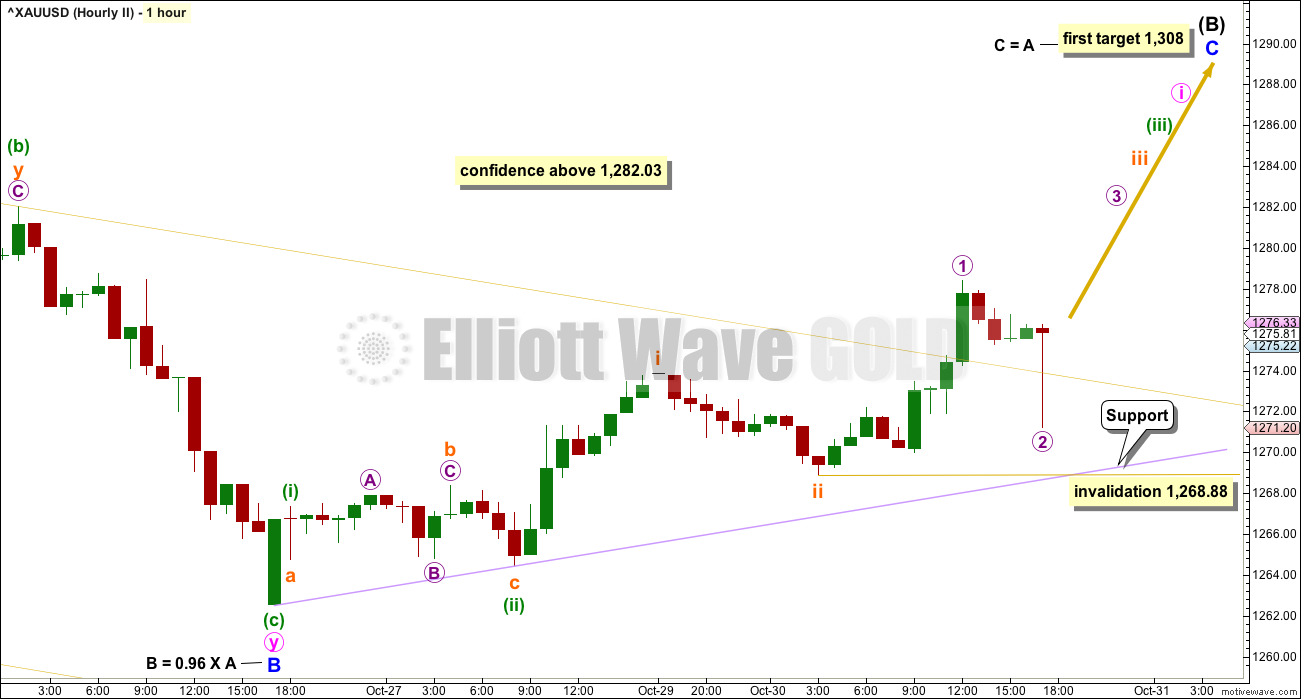
Click chart to enlarge.
Intermediate wave (B) may be a regular flat correction. Within intermediate wave (B), minor wave B has passed the minimum requirement of 0.90 the length of minor wave A. B waves within 0.90 to 1.05 the length of A waves indicate a regular flat correction. The most common length for C waves within regular flats is equality in length with the A wave.
Minor wave C would be extremely likely to make at least a slight new high above the end of minor wave A at 1,305.72 to avoid a truncation.
Now that the best fit channel about minor wave B downwards has been breached by some upwards movement a little confidence may be had in a low. Reasonable confidence may only be had if price makes a new high above 1,282.03.
Both wave counts require a five wave structure upwards to complete. For this second wave count it would be labelled minor wave C.
TECHNICAL ANALYSIS
WEEKLY CHART
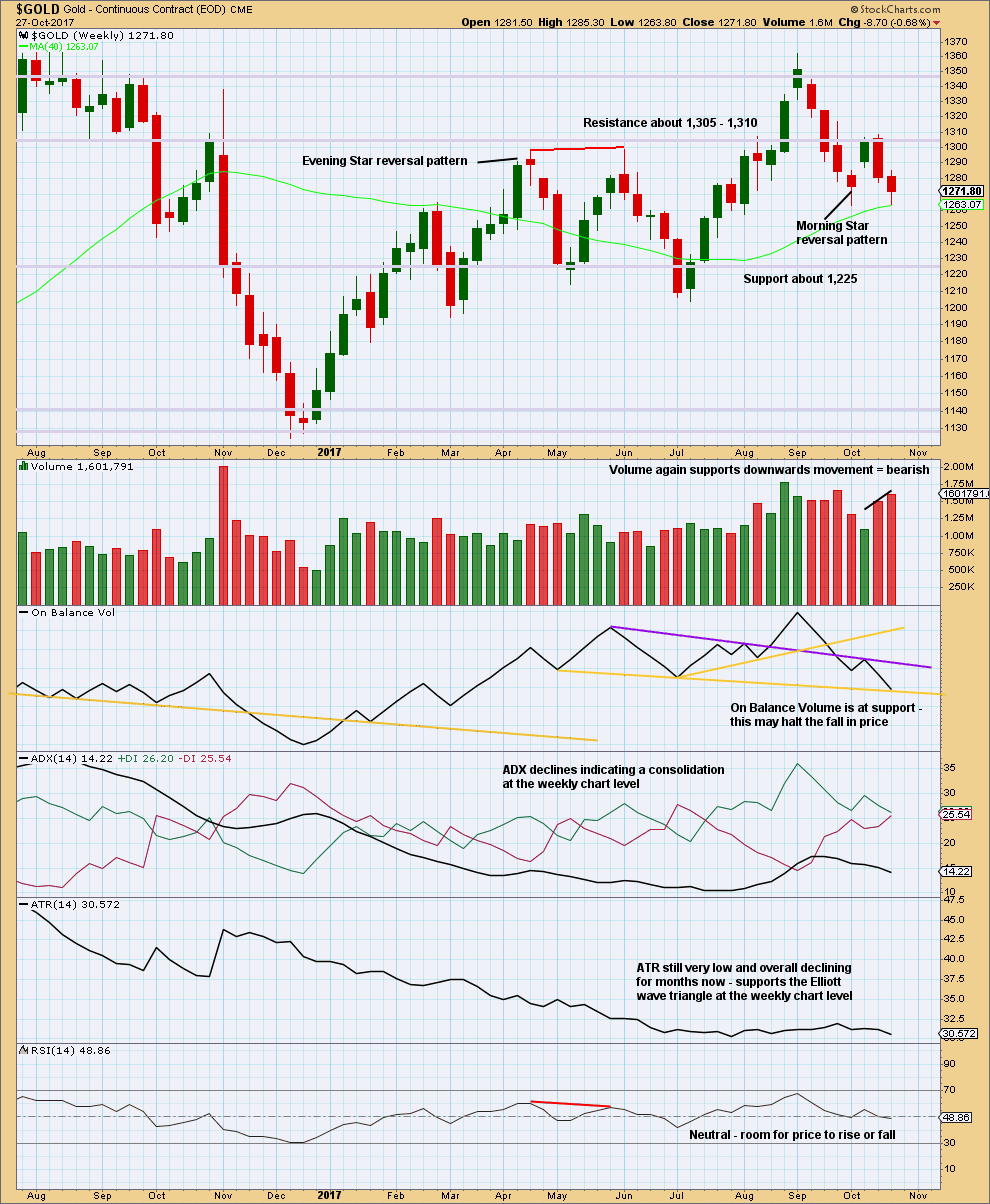
Click chart to enlarge. Chart courtesy of StockCharts.com.
What looks like a possible double bottom here with the last swing low three weeks ago is too small to be classified as a correct double bottom. The two troughs of a double bottom should be about 10% from the peak in between. Here, they are only 3.6% from the peak.
The long lower wick on the last completed weekly candlestick is bullish, but volume tells a different story as it is bearish.
On Balance Volume may again lead the way. Support may force a bounce here.
DAILY CHART
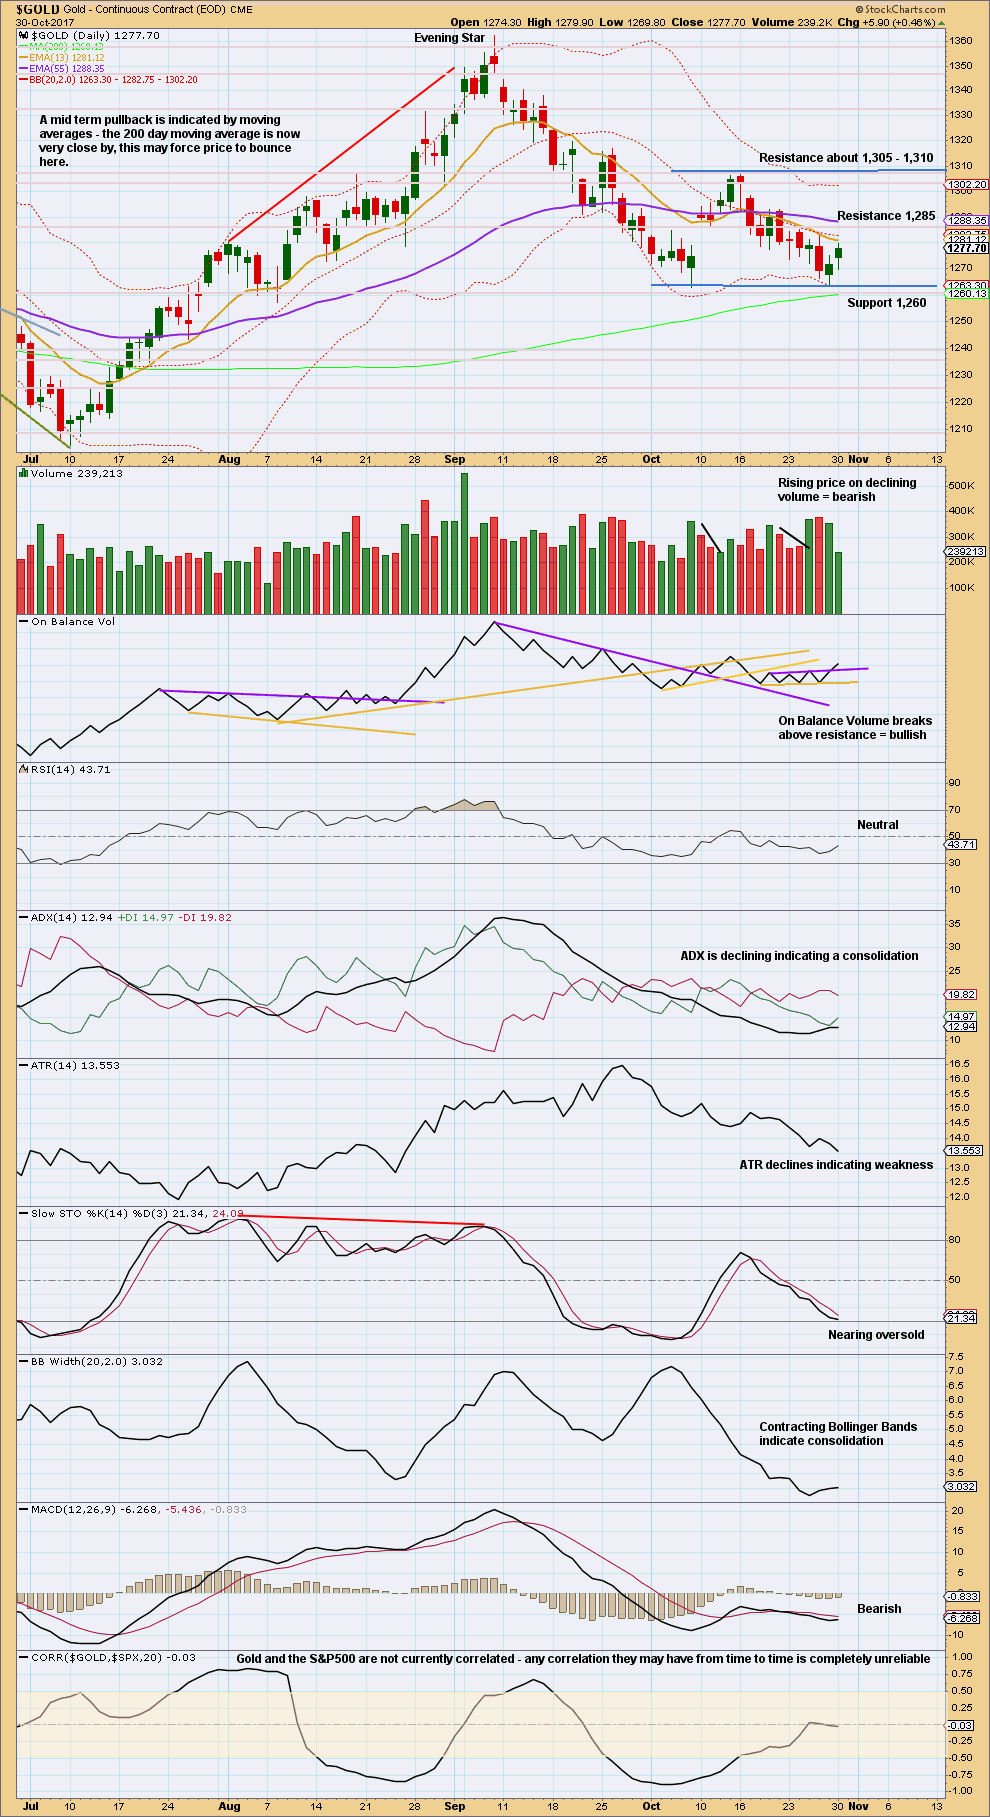
Click chart to enlarge. Chart courtesy of StockCharts.com.
A bullish breakout has come today from On Balance Volume. However, there is reasonable concern that this breakout may be short lived or false because volume definitely does not support upwards movement today. This supports the second Elliott wave count.
Price is very clearly consolidating. Expect swings from support to resistance and back again. Use Stochastics in conjunction with support and resistance to signal when each swing ends. Be aware that trading a consolidating market is much more risky than trading a trending market, and reduce risk accordingly. Only experienced traders should consider trading the swings within a consolidation. Reduce risk to 1-3% of equity. Always trade with stops. Here, move stops to a little below support and above resistance to allow for overshoots; give the market room to move.
With Stochastics very close to oversold and price at support, an upwards swing may begin here or very soon. Look for resistance about 1,305 – 1,310. This also supports the second Elliott wave count.
GDX DAILY CHART
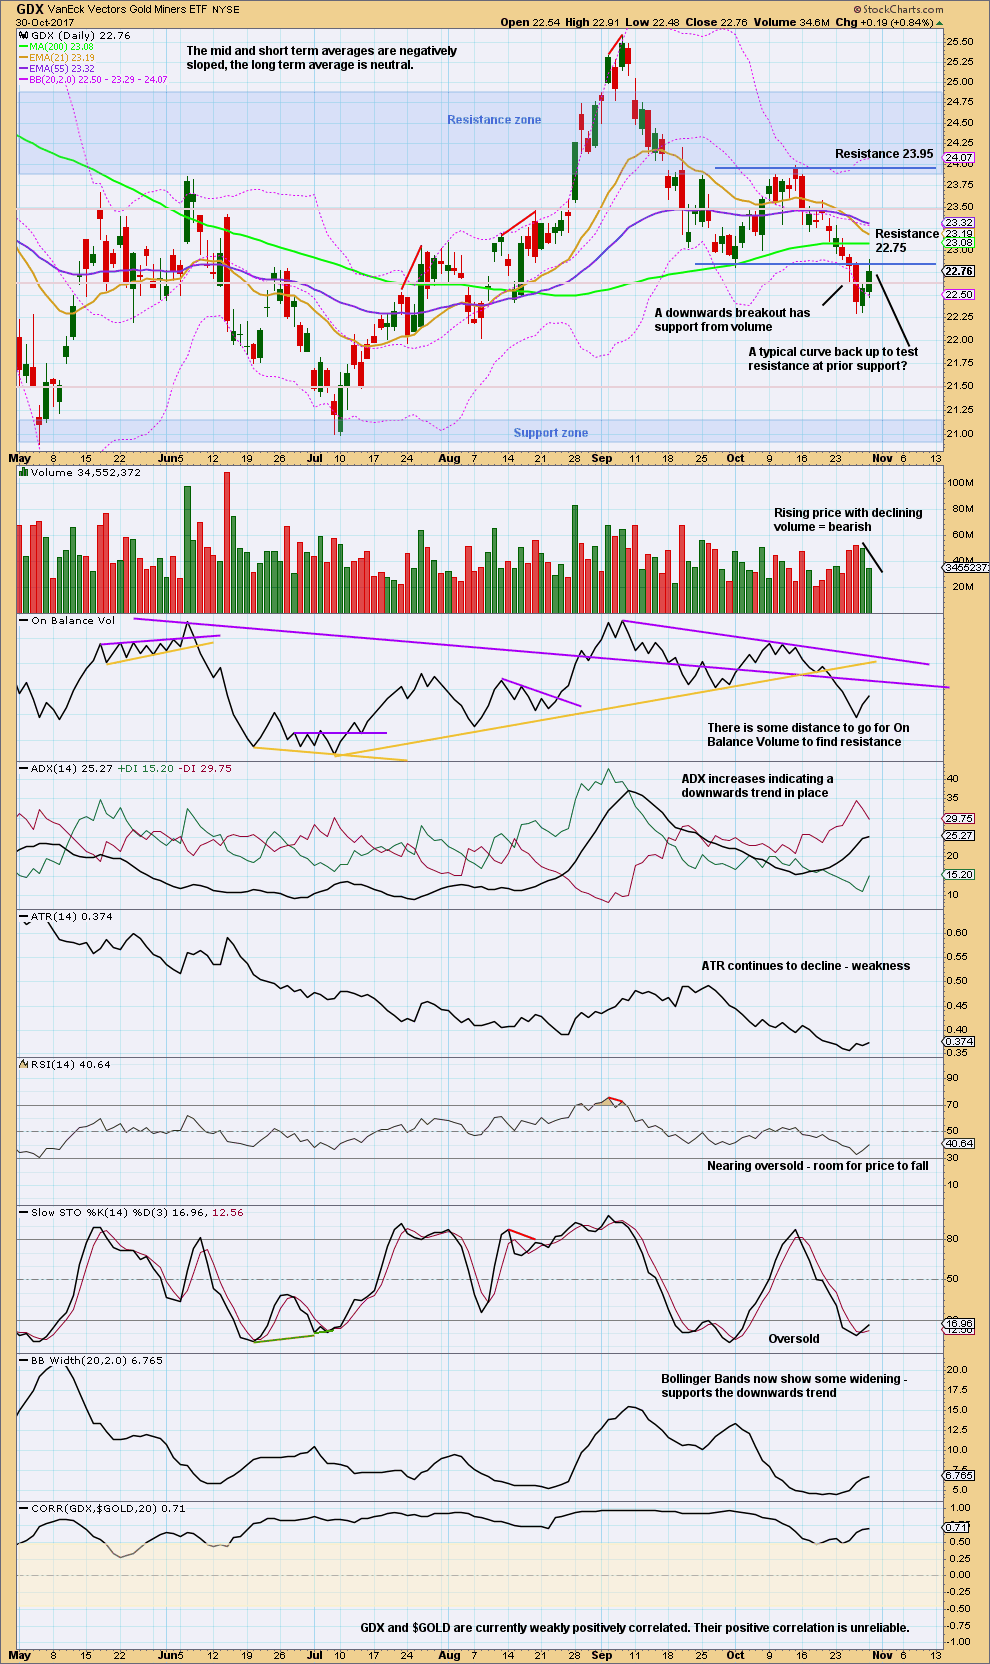
Click chart to enlarge. Chart courtesy of StockCharts.com.
A bounce to test resistance where price found prior support about 22.75 may have occurred today. This may offer a good entry point to join the downwards trend.
Published @ 06:27 p.m. EST.
Pretty much the same for GDX. Volume was lower for a down day and OBV could be a backtest of support.
Yet the candle looks bearish.
Tomorrow will likely decide if price makes a new low below 22.30 or rallies from here
Not sure what to make of today’s down day.
Volume did not support the down day and OBV looks like it may be a backtest of support.
Yet the candle is bearish and any channel breakout attempt was negated.
Need to see which way we go tomorrow.
Fed minutes release at 2pm EST may be the deciding factor.
Is gold going up tomorrow?
Thanks, Happy Halloween (USA)
I’m flying home from Tonga tonight. We arrive very late and have to drive up north from Auckland. So I may not be up in time tomorrow to post an updated hourly chart for you before the NY close tomorrow.
After that… all back to normal.
Thank you for your patience.
Tonga was fabulous. Great food, awesome yellow fin tuna especially, poor surf though. I did great on the coral reef, but no barrels. The snorkelling was excellent.
No worries if no post, Lara. The markets will still be here. Maybe gold will choose to shoot up through the roof while you are sleeping !
Me and huge bodies of water are not best of friends! Once, almost drowned in a lake. My biggest fear is being swallowed up by a huge tidal wave! So, no water above my head except in a shower 😁
Hi Lara,
For GDX, you noted that “This may offer a good entry point to join the downwards trend”. So, GDX is going down? Barrier triangle not an option anymore?
Thanks.
David,
There’s often more than one way to look at the data. I believe Lara is commenting specifically on what the technical analysis of her GDX StockChart is showing. The Barrier Triangle is certainly still in play and will be unless 20.99 is broken to the downside. That said, if you are long GDX, GDXJ, NUGT, or JNUG, I would put your stop below the recent GDX low @ 22.30.
For the bullish case, we do need to see a channel breakout to the upside and stronger volume on up days. Sometimes GDX volume can be deceiving, so it’s good to consider the action in Gold and the Gold OBV sign was bullish even though volume was weak. Once again, need to see upside follow through.
Price recently closed back within the Bollinger Bands after closing below them, which is bullish. Further, if you go back a little further on a GDX StockCharts chart and redraw some OBV trendlines, I think you can argue that today gave a weak bullish sign for OBV. I would like to see more follow through to the upside in the coming days to confirm.
Hope this helps. PS I am long
Thank you very much, Dreamer. Sincerely appreciate your help and guidance. Crystal clear. Between Lara and you, I have learnt so much in this one short month.
I am also long and hence a little concerned. But, not anymore.
There is one other bullish signal as well from RSI, as practised by Andrew Cardwell. There is a positive reversal in RSI between the July low and the current low. Price higher low, while RSI made a lower low, meaning the stock is getting oversold at a higher price. He uses this to calculate a possible target as well.
Once again, thank you kindly, Dreamer.
David,
What Dreamer said. Thanks Dreamer!
Also this.
The barrier triangle remains valid while price remains above 20.99.
Primary wave E may be about to overshoot the A-C trend line. This idea is still valid.
Thanks Lara. I agree that a new low is possible to complete triangle wave E. It’s also possible that Triangle wave E is complete already, but we need some more upward movement to confirm if that is the case. As we know, those quick 4th waves in a strong downtrend can be deceiving! The next couple of days are key.
Thank you Lara. And thanks for the overshoot scenario, I see and understand the overshoot possibility now. Might have been a surprise catch.
One important detail I have learnt from your videos is bottom up wave counting. I never used to bother with minute, minuette etc. In fact just the day timescale, nothing lower. Now when I go down to the hourly, things fall so well in place (mostly!)
As always thank you kindly, Lara.