
More downwards movement was expected after last week’s analysis. Silver has made a new low, which fits expectations so far.
With this market in a large consolidation, volume analysis will be used to indicate the breakout direction.
Summary: Downwards movement has support from classic technical analysis. The target is at either 16.347 or as low as 15.799 – 15.649.
It is possible that a bounce may unfold about here for Silver, but the low does not look to be in place yet.
New updates to this analysis are in bold.
Last monthly chart is here.
ELLIOTT WAVE COUNTS
FIRST WAVE COUNT
WEEKLY CHART
Click chart to enlarge.
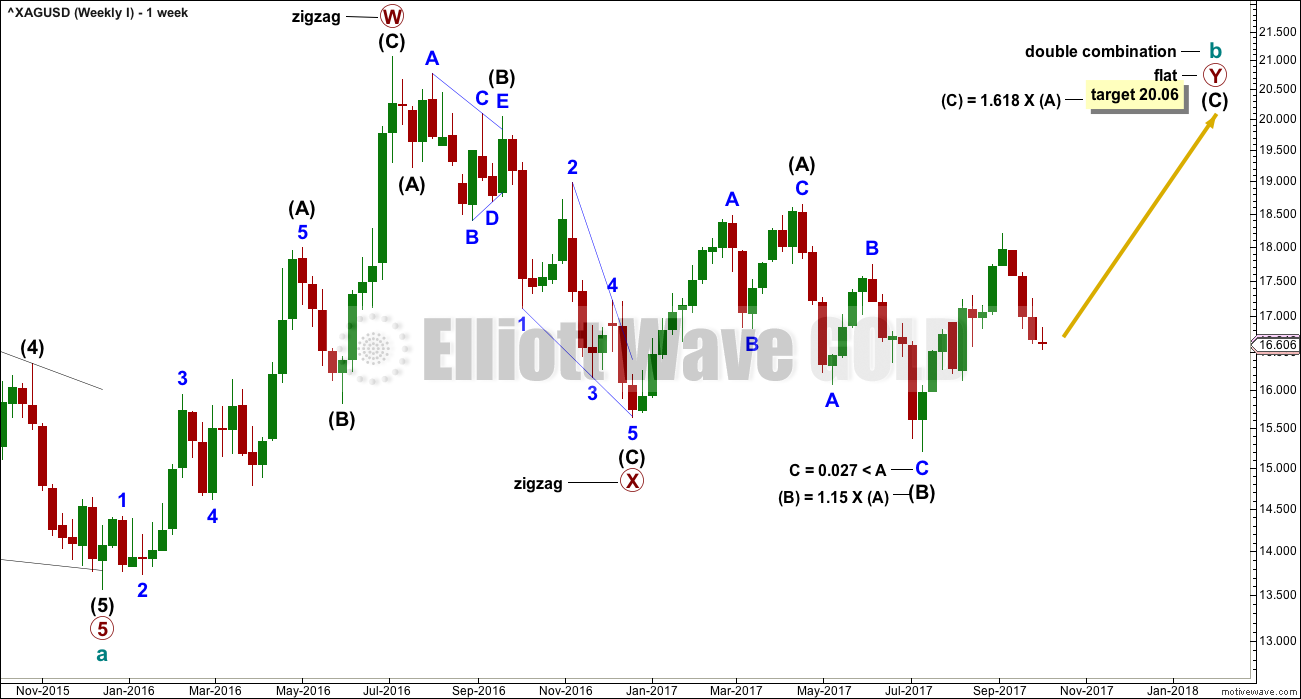
Cycle wave b may be completing as a double combination: zigzag – X – flat. The second structure, a flat correction for primary wave Y, may be underway.
Within a flat correction, intermediate wave (B) must retrace a minimum 0.9 length of intermediate wave (A) at 15.938. Intermediate wave (B) has met this minimum requirement; the rule for a flat correction is met. Intermediate wave (B) is longer than 1.05 times the length of intermediate wave (A) indicating this may be an expanded flat. Expanded flat corrections are the most common type. Normally their C waves are 1.618 or 2.618 the length of their A waves.
The target calculated would see primary wave Y to end close to same level as primary wave W about 21.062. The purpose of combinations is to take up time and move price sideways. To achieve this purpose the second structure in the double normally ends about the same level as the first.
While the combination wave count at the weekly chart level does not currently work for Gold, it does still work for Silver. They do not have to complete the same structures for cycle wave b, and fairly often their structures are different.
DAILY CHART
Click chart to enlarge.
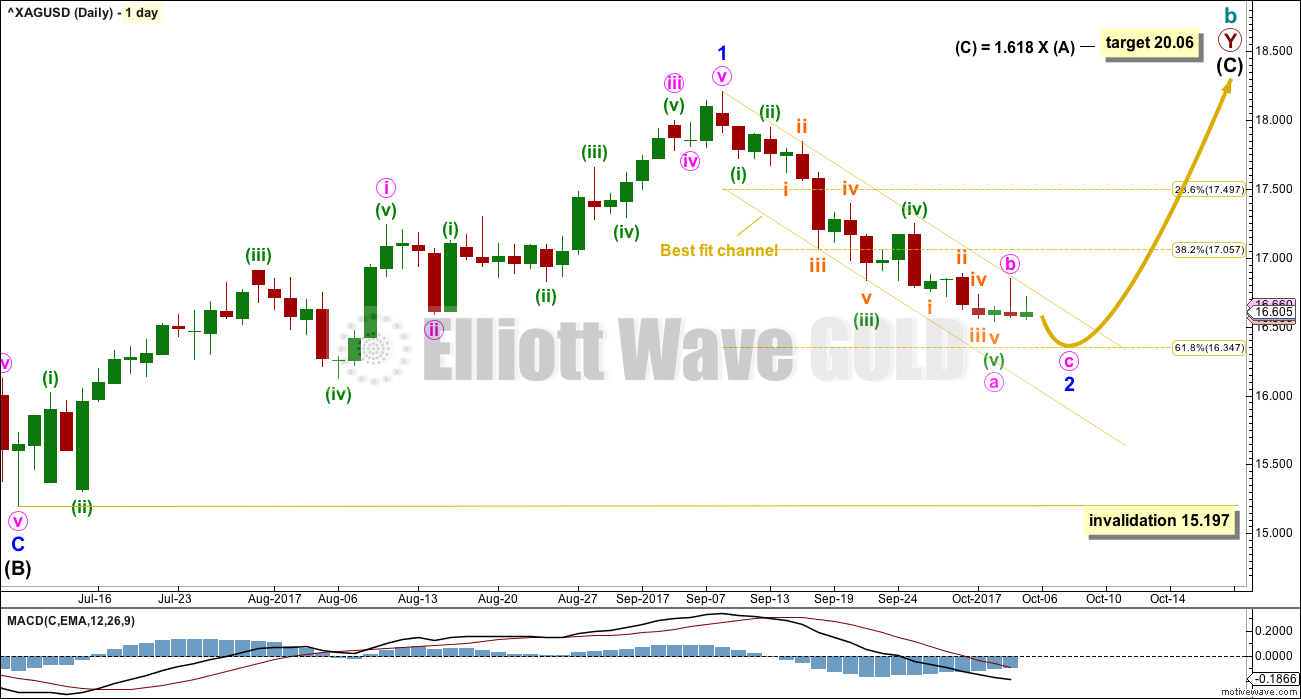
For this first wave count, upwards movement for intermediate wave (C) must subdivide as a five wave structure. It may be unfolding as an impulse.
Within the impulse of intermediate wave (C), only minor wave 1 was over at the last high and now minor wave 2 may be unfolding. Minor wave 2 may not move beyond the start of minor wave 1 below 15.197.
The most likely point for minor wave 2 to end may be the 0.618 Fibonacci ratio of minor wave 1 at 16.347.
Minor wave 1 lasted 44 days. Minor wave 2 so far has lasted 19 days. It would be likely to continue further, so that it has better proportion to minor wave 1. A Fibonacci 21 or 34 days may be expected at this stage.
SECOND WAVE COUNT
WEEKLY CHART
Click chart to enlarge.
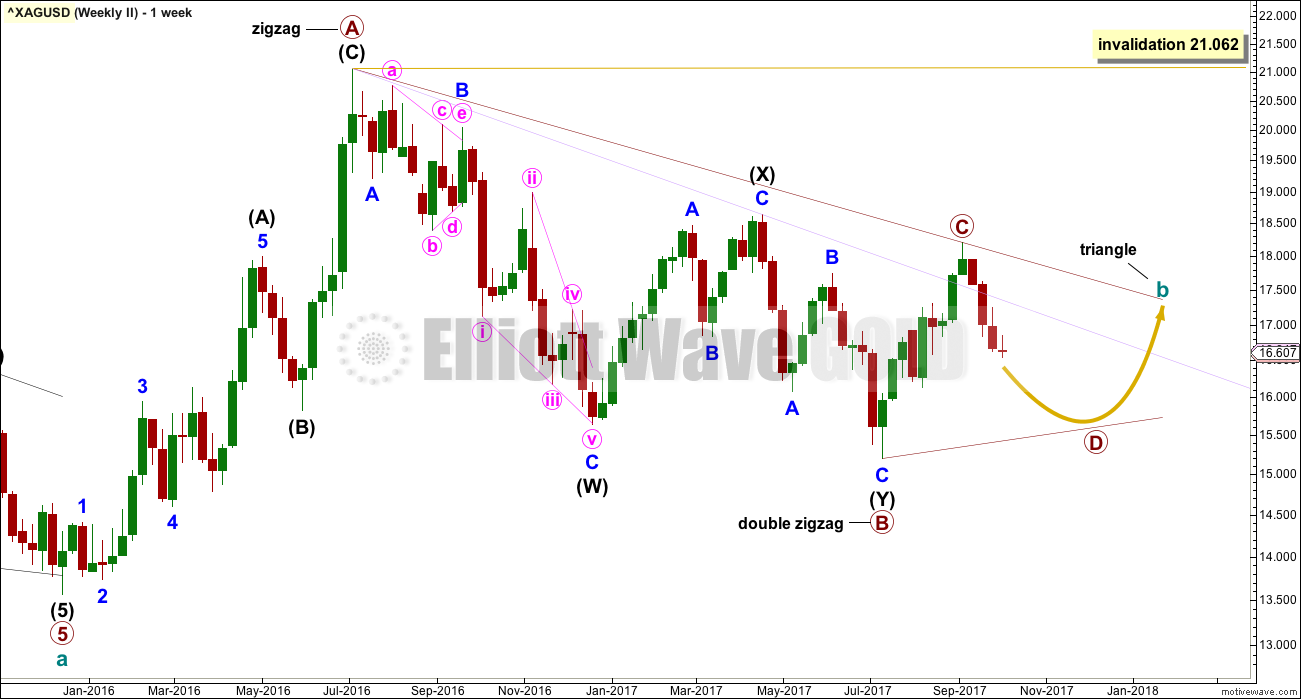
It remains possible for Silver that a large regular contracting or regular barrier triangle may be completing.
Within a triangle, one of the sub-waves must be a more complicated multiple, usually a multiple zigzag. This may be complete for primary wave B.
Primary wave C upwards may now be complete. The upper A-C trend line does have a fairly steep slope though, so it must be accepted that primary wave C may not be over and may continue higher. If it does, it may not move beyond the end of primary wave A above 21.062.
Primary wave C must subdivide as a three wave zigzag.
DAILY CHART
Click chart to enlarge.
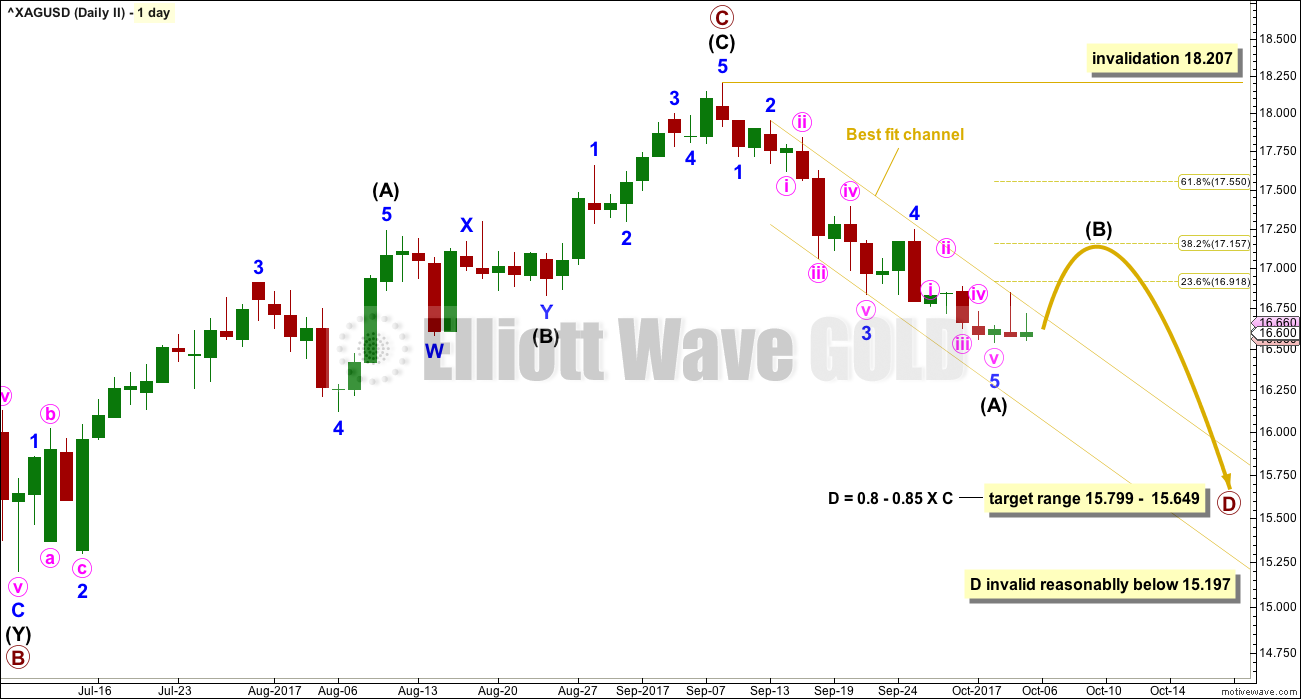
Primary wave C now looks complete and primary wave D downwards looks to have begun for this wave count. Primary wave D downwards must subdivide as a zigzag, which subdivides 5-3-5.
Primary wave D of a contracting triangle may not move beyond the end of primary wave B below 15.197.
Primary wave D of a barrier triangle may end about the same level as primary wave B at 15.197; as long as the B-D trend line is essentially flat, the triangle will remain valid. Unfortunately, there is some subjectivity in this rule; it is not black and white.
Within primary wave D, intermediate wave (A) now looks like a complete impulse. Intermediate wave (B) may now bounce higher up to the 0.382 or 0.618 Fibonacci ratios of intermediate wave (A).
It would be extremely unlikely for this wave count that intermediate wave (B) is over already. It should last at least two weeks and quite likely longer, so that it has reasonable proportion to intermediate wave (A).
Intermediate wave (B) should break out above the channel that contained intermediate wave (A).
Intermediate wave (B) may not move beyond the start of intermediate wave (A) above 18.207.
TECHNICAL ANALYSIS
WEEKLY CHART
Click chart to enlarge. Chart courtesy of StockCharts.com.
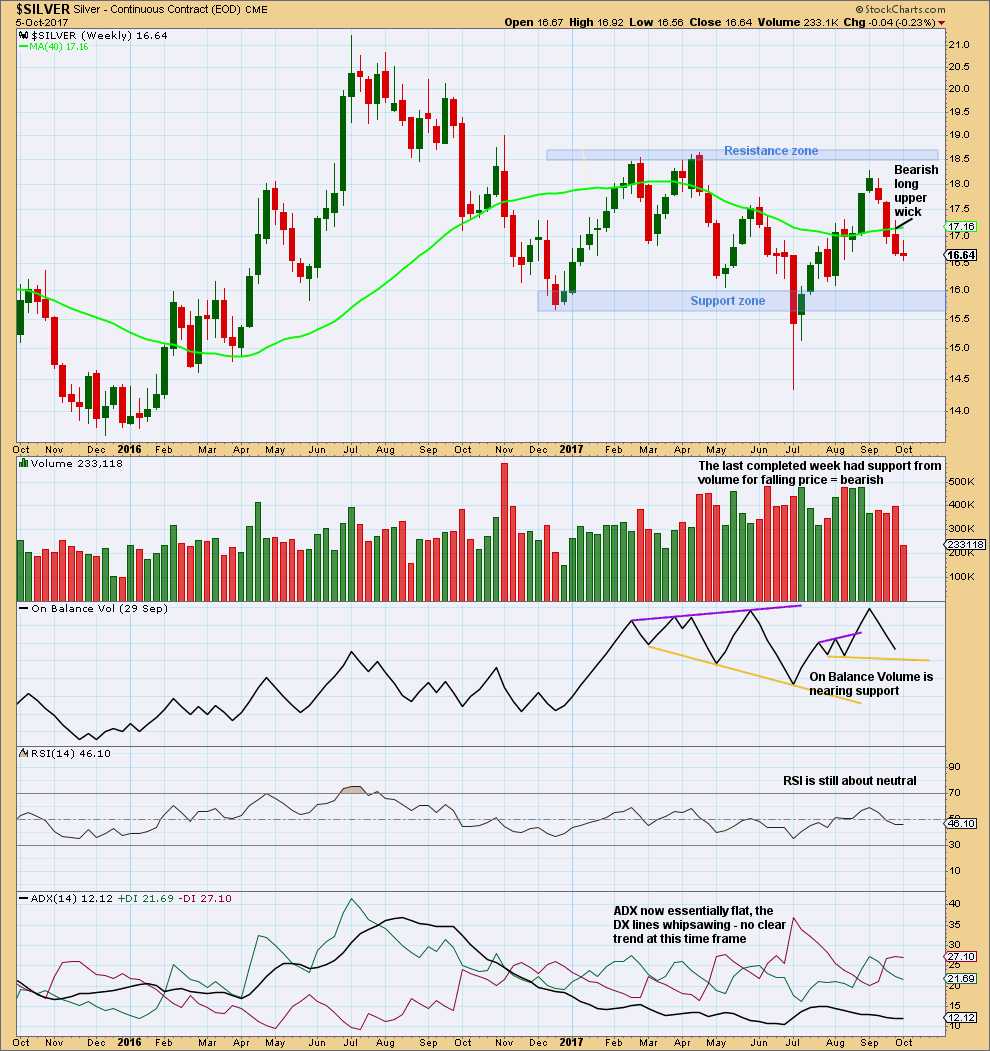
Price is still within a large consolidation zone. Volume remains relatively strong. So far, within the consolidation, it is only now one downwards week that has strongest volume suggesting a downwards breakout eventually is more likely than upwards. However, the difference is very slight between this week and the next strongest week which was an upwards week, so the signal is not a clear one.
Support is some distance away. There is room for price to fall further here.
The bearishness of the long upper wick on the last completed weekly candlestick may now be resolved by this current week making a new low. How this current candlestick closes may offer a clue as to how next week may unfold.
DAILY CHART
Click chart to enlarge. Chart courtesy of StockCharts.com.
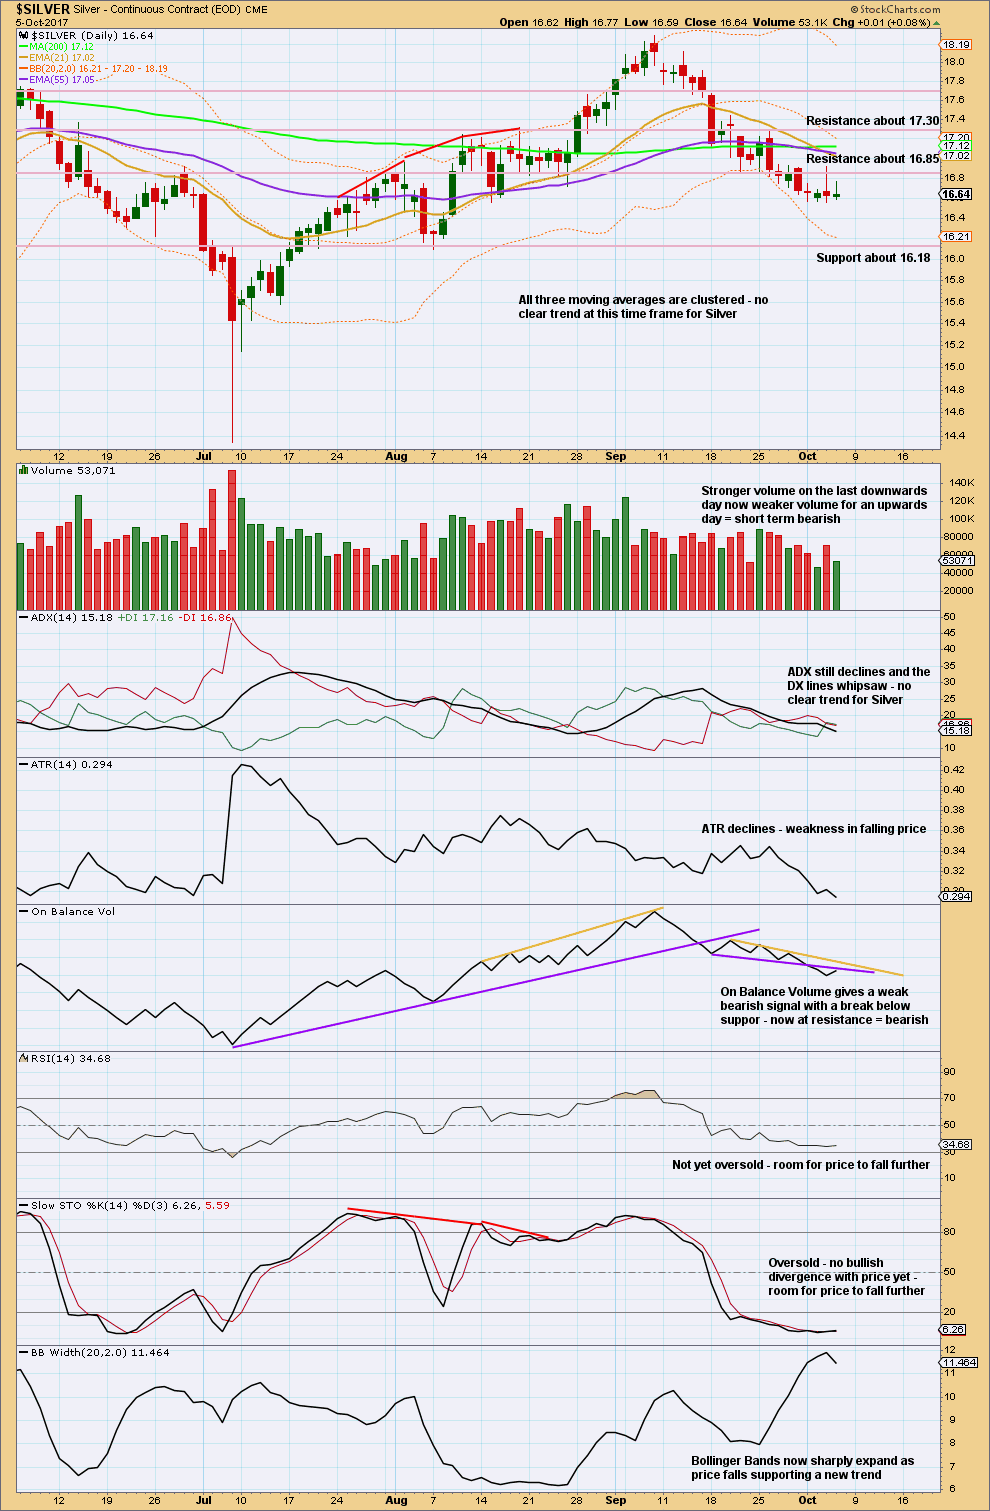
At the daily chart level, during the most recent consolidation which began back in July, it is an upwards day of the 5th of September that has strongest volume suggesting an upwards breakout is more likely than downwards.
The volume profile is bearish for the very short term, but overall as price falls volume is declining. The low does not look to be in place yet, but it may be near.
For the short term, On Balance Volume is also bearish.
Published @ 10:52 p.m. EST.
[Note: Analysis is public today for promotional purposes. Specific trading advice and comments will remain private for members only.]