
Last week’s analysis expected more upwards movement from US Oil. Price moved higher, falling a little short of the target, before turning down for a pullback which so far has remained within the channel.
Summary: Oil may continue to rise for the short to mid term. The target for the rise to end is now widened to a zone at 60.1 to 62.5.
Use the blue channel on the main daily Elliott wave chart. Expect upwards movement while price remains within or above it. If that channel is breached by downwards movement, then expect a deeper pullback.
New updates to this analysis are in bold.
MONTHLY ELLIOTT WAVE COUNT
Click chart to enlarge.
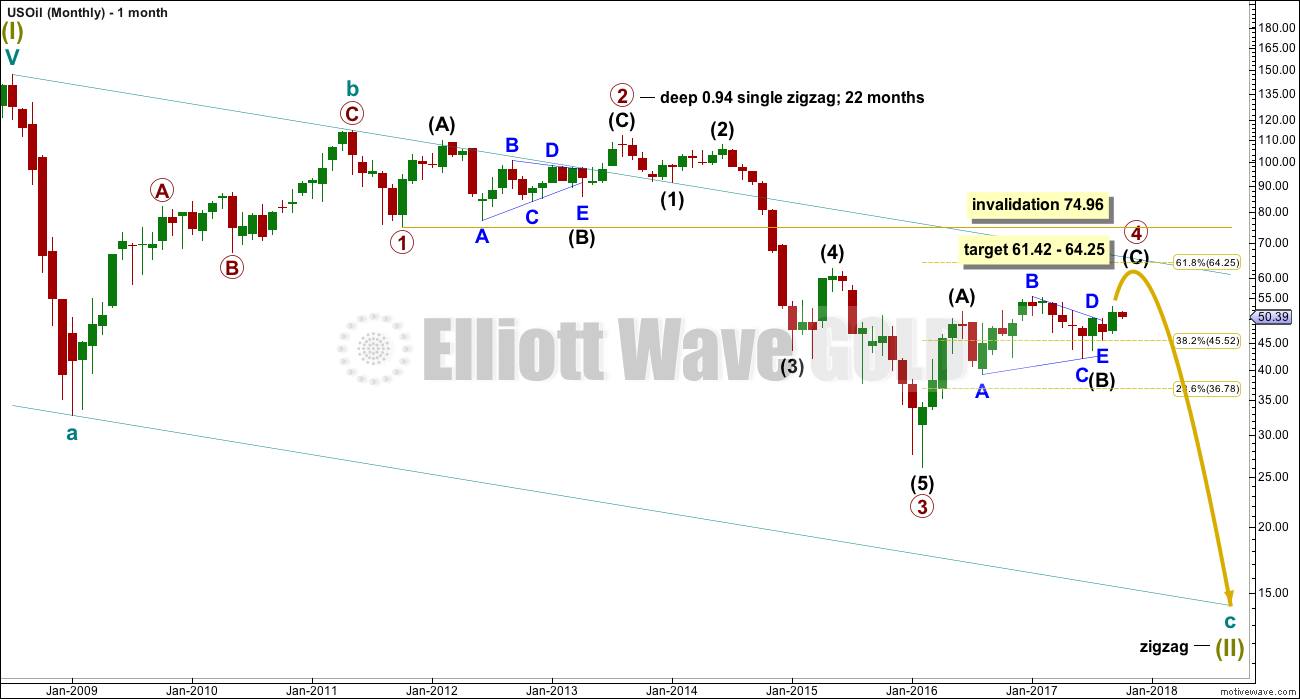
Within the bear market, cycle wave b is seen as ending in May 2011. Thereafter, a five wave structure downwards for cycle wave c begins.
Primary wave 1 is a short impulse lasting five months. Primary wave 2 is a very deep 0.94 zigzag lasting 22 months. Primary wave 3 is a complete impulse with no Fibonacci ratio to primary wave 1. It lasted 30 months.
There is alternation in depth with primary wave 2 very deep and primary wave 4 relatively shallow. There is inadequate alternation in structure, both are zigzags. So far primary wave 4 has lasted 19 months. So far there is good proportion between primary waves 2 and 4.
Primary wave 4 may not move into primary wave 1 price territory above 74.96.
WEEKLY ELLIOTT WAVE COUNT
Click chart to enlarge.
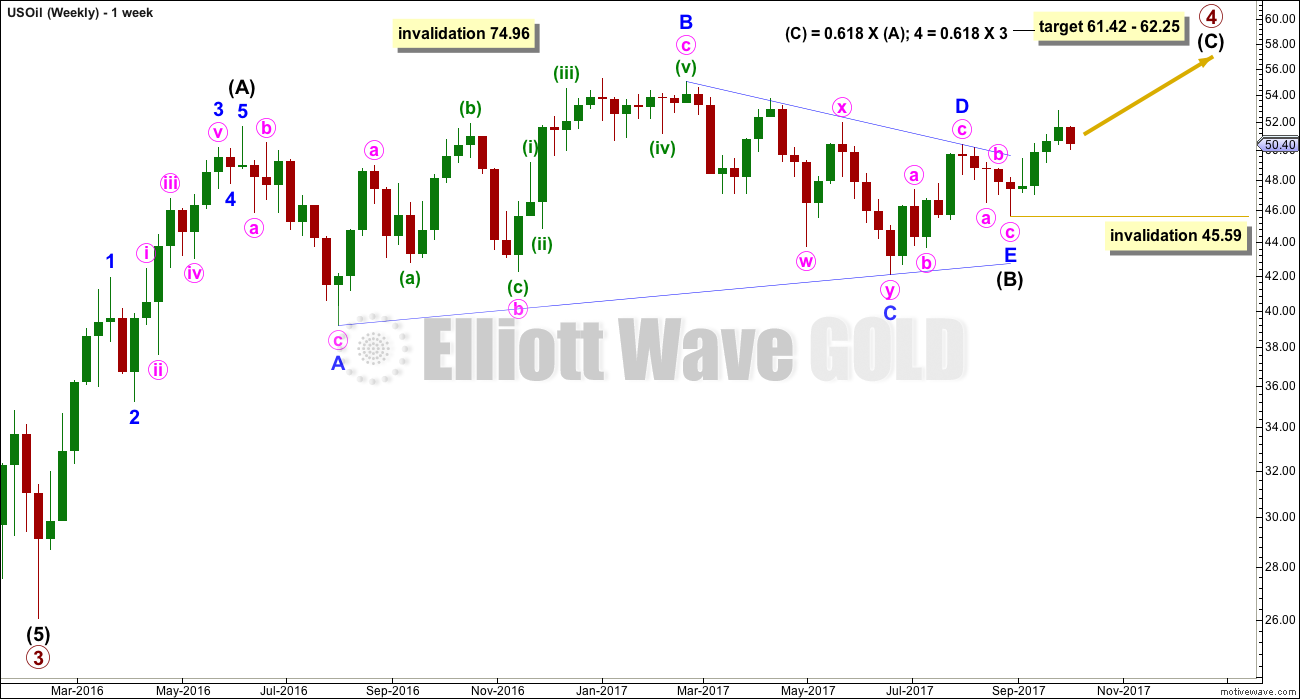
This wave count now sees primary wave 4 incomplete as a relatively shallow zigzag.
Intermediate wave (A) will subdivide as a five wave impulse. Intermediate wave (B) fits as a running contracting triangle. Intermediate wave (C) has now moved above the end of intermediate wave (A) at 51.67 avoiding a truncation. As soon as the structure of intermediate wave (C) could be complete, then an end to primary wave 4 may be considered. This can be seen at the daily chart level.
Within intermediate wave (C), no second wave correction may move beyond the start of its first wave below 45.59.
DAILY ELLIOTT WAVE COUNT
Click chart to enlarge.
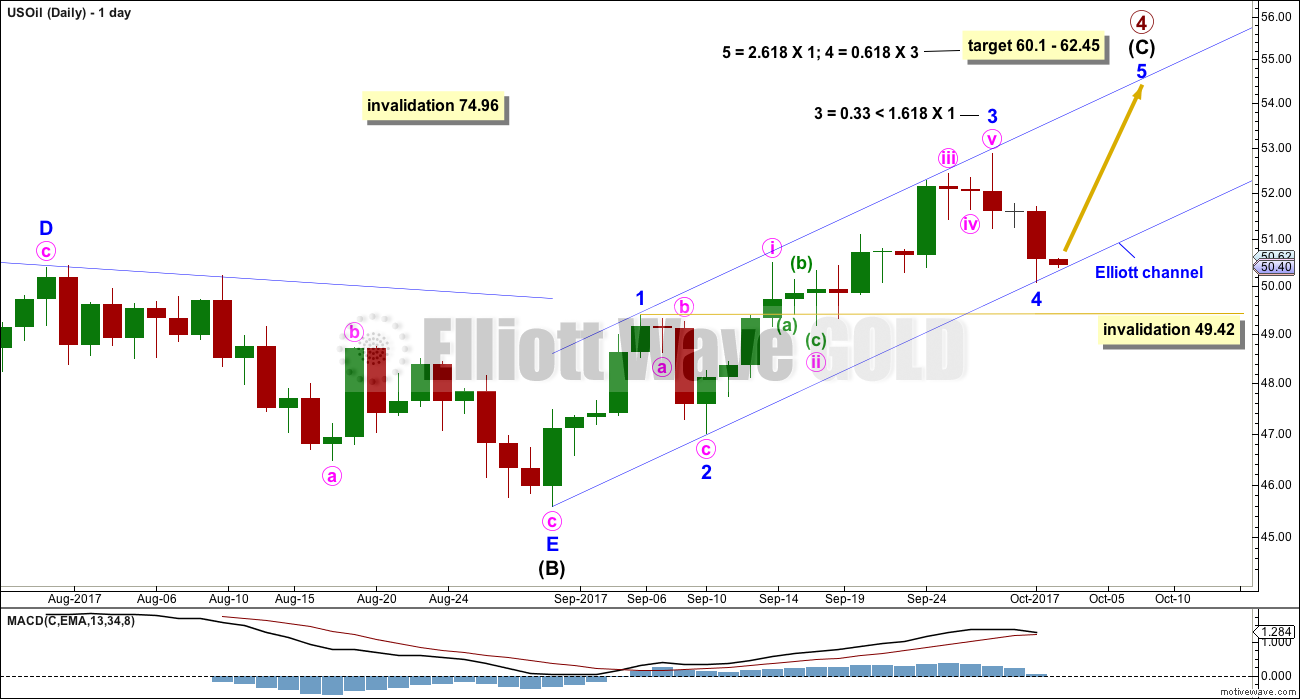
Intermediate wave (C) must subdivide as a five wave structure. It looks like it is subdividing as the more common impulse.
So far, within the impulse, there is now a Fibonacci ratio between minor waves 1 and 3.
US Oil behaves like a typical commodity, which exhibit swift strong and extended fifth waves. This is a common tendency and the target will expect it.
The target is now calculated at three wave degrees at the daily chart level, so it is widened into a zone. If price reaches up into this zone, then there would be Fibonacci ratios at primary, intermediate and minor degrees.
Minor wave 4 so far is finding support exactly at the lower edge of the Elliott channel. In the first instance expect a bounce up from here. If this channel is breached, then it would need to be redrawn using Elliott’s second technique.
Minor wave 4 may not move into minor wave 1 price territory below 49.42.
ALTERNATE WEEKLY ELLIOTT WAVE COUNT
Click chart to enlarge.
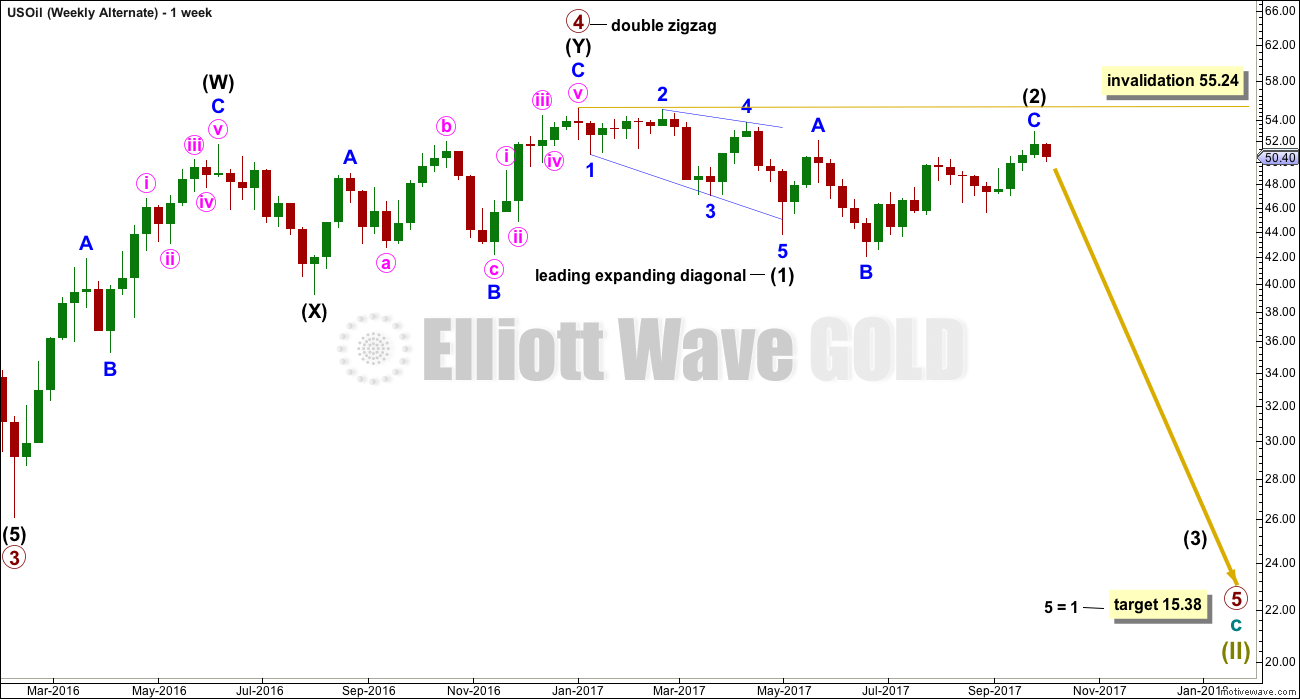
This alternate wave count considers the possibility that primary wave 4 is over and primary wave 5 has begun.
Primary wave 5 may have begun with a leading expanding diagonal for intermediate wave (1). The current deep bounce may be a continuation of intermediate wave (2) as an expanded flat correction.
Intermediate wave (2) may not move beyond the start of intermediate wave (1) above 55.24.
Second wave corrections following first wave leading diagonals are commonly very deep indeed.
Only the breach of the maroon trend channel is judged to give this wave count a slightly lower probability in terms of Elliott wave than the main wave count. If primary wave 4 was over, then that trend channel should have provided resistance.
ALTERNATE DAILY ELLIOTT WAVE COUNT
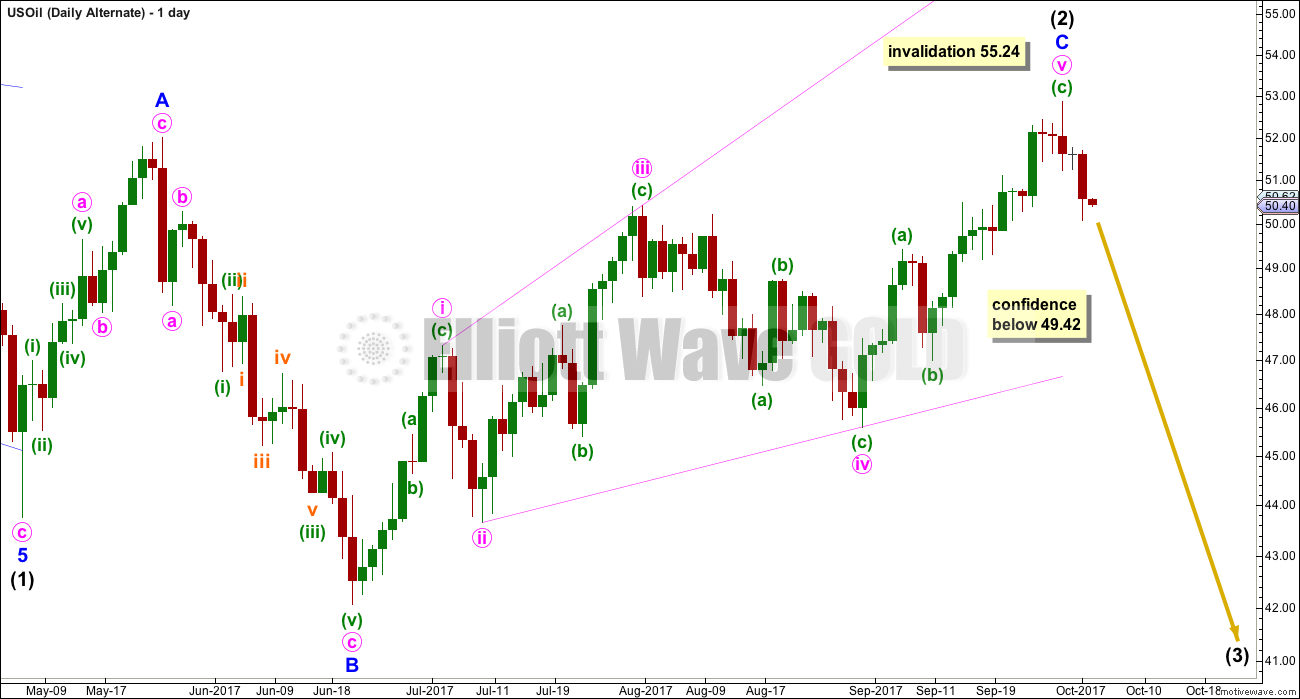
Click chart to enlarge.
Intermediate wave (2) fits so far as an expanded flat correction that may now be complete.
Minor wave C may be another expanding diagonal, this one ending. Within ending diagonals, all sub-waves must subdivide as zigzags and the fourth wave should overlap first wave price territory.
Minute wave v must be longer than minute wave iii within an expanding diagonal, so that the rule regarding wave lengths is met. This rule is now met.
Minor wave C has moved above the end of minor wave A at 52.00 avoiding a truncation and a very rare running flat.
A new low now below 49.42 would invalidate the main daily wave count, so at that stage the invalidation would provide some confidence in this alternate.
TECHNICAL ANALYSIS
DAILY CHART
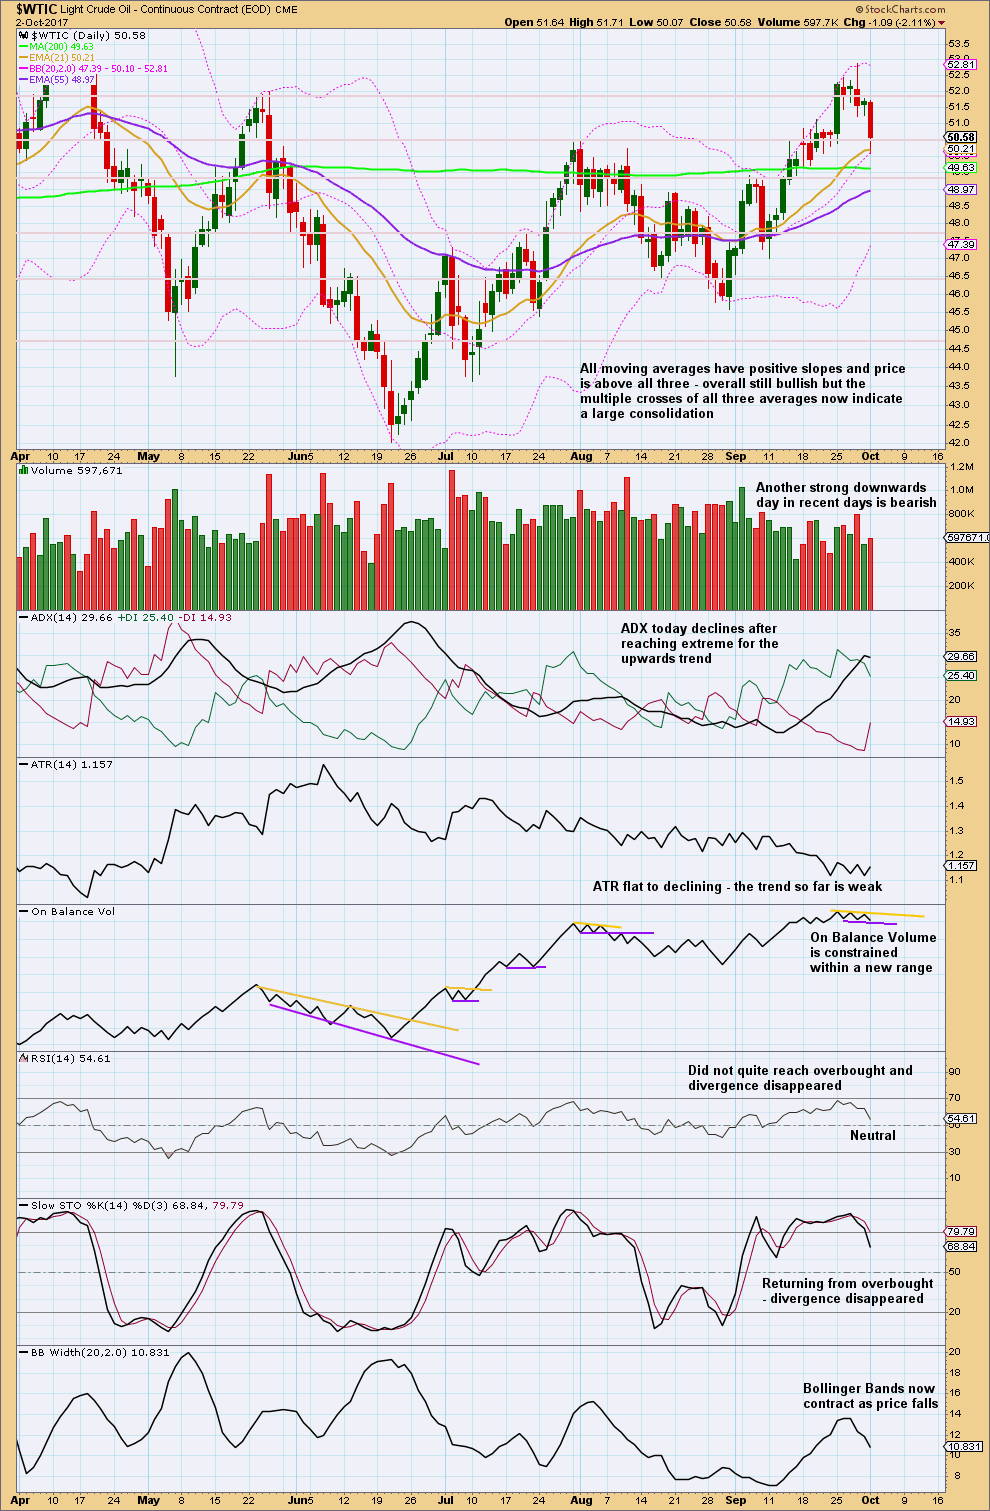
Click chart to enlarge. Chart courtesy of StockCharts.com.
The long upper wick at the last high is bearish, but this does not tell us how far price may fall. It is often an indication of a trend change to sideways, or a trend reversal from up to down or vice versa.
The long lower wick on the last daily candlestick is bullish. Downwards movement may be over for now.
The downwards day at the high had support for downwards movement from volume. The last downwards day does not. This supports the idea that downwards movement over the last two days is a small pullback within an ongoing upwards trend, which is what the main Elliott wave count expects to see.
Watch On Balance Volume very carefully in coming days. A breakout here may be a leading indicator for the next direction for price.
With RSI not oversold and Stochastics exhibiting no divergence with price at highs, there is still room for price to rise.
VOLATILITY INDEX
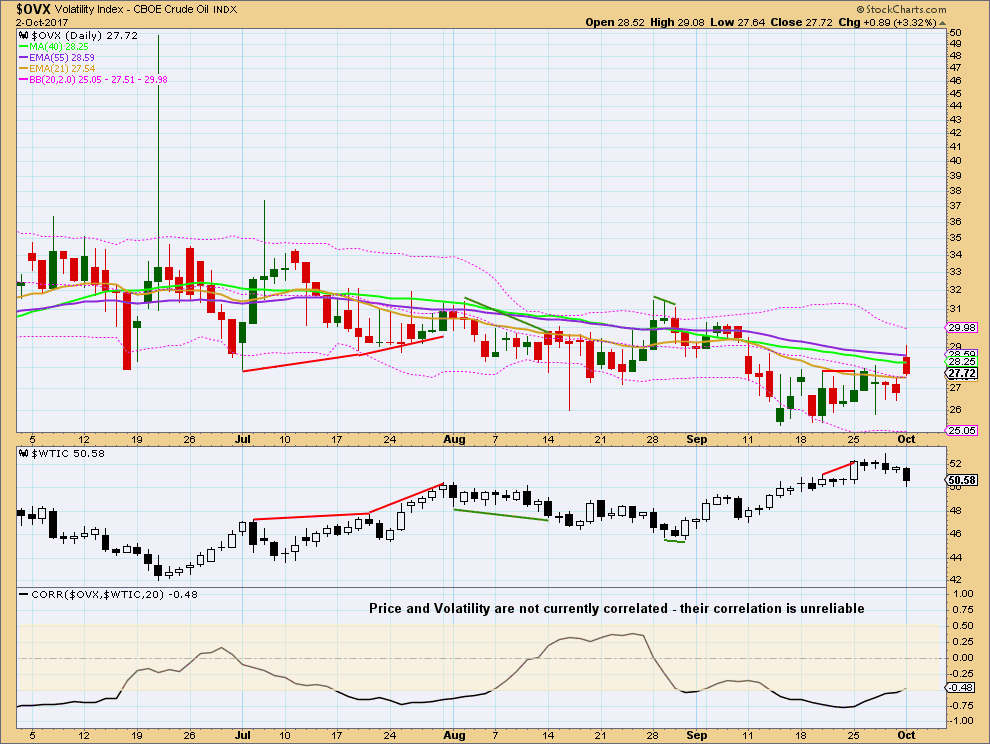
Click chart to enlarge. Chart courtesy of StockCharts.com.
Normally, volatility should decline as price rises and volatility should increase as price falls. Divergence from this normal can provide a bullish or bearish signal for Oil. However, it is noted that this signal occurs both in minor and major lows and it cannot be used to distinguish between them.
These markets are no longer currently correlated. There is no divergence between the low for price and volatility.
Published @ 12:15 a.m. EST.