
Last analysis warned Elliott Wave Gold members that gold may continue sideways in the current consolidation for a while yet. Another very small range day moves price essentially sideways on very light volume.
This market is consolidating. Volume will be used to guide as to which direction the breakout is most likely. Stochastics along with support and resistance will be used to indicate when one swing with the consolation ends and the next begins.
Summary: Price may continue to move sideways in an ever decreasing range for another one to three weeks.
It is still possible, but less likely now, that an upwards swing may continue here to end about resistance at 1,305 to 1,310.
Only the most experienced of traders should be trading the small swings within a consolidation. If trading the small swings, reduce risk to 1-3% of equity for any one trade and always trade with stops.
New updates to this analysis are in bold.
Last monthly charts for the main wave count are here, another monthly alternate is here, and video is here.
Grand SuperCycle analysis is here.
The wave counts will be labelled first and second. Classic technical analysis will be used to determine which wave count looks to be more likely. In terms of Elliott wave structure the second wave count has a better fit and fewer problems. The second wave count is my preferred wave count.
FIRST ELLIOTT WAVE COUNT
WEEKLY CHART
Click chart to enlarge.
Both wave counts expect that Gold completed a large five down from the all time high in November 2011 to the low of December 2015, which is seen on the left hand side of both weekly charts.
If this analysis is correct, then the five down may not be the completion of the correction. Corrective waves do not subdivide as fives; they subdivide as threes. The five down is seen as cycle wave a within a Super Cycle wave (a).
Both wave counts then expect cycle wave b began in December 2015.
There are more than 23 possible corrective structures that B waves may take. It is important to always have multiple wave counts when B waves are expected.
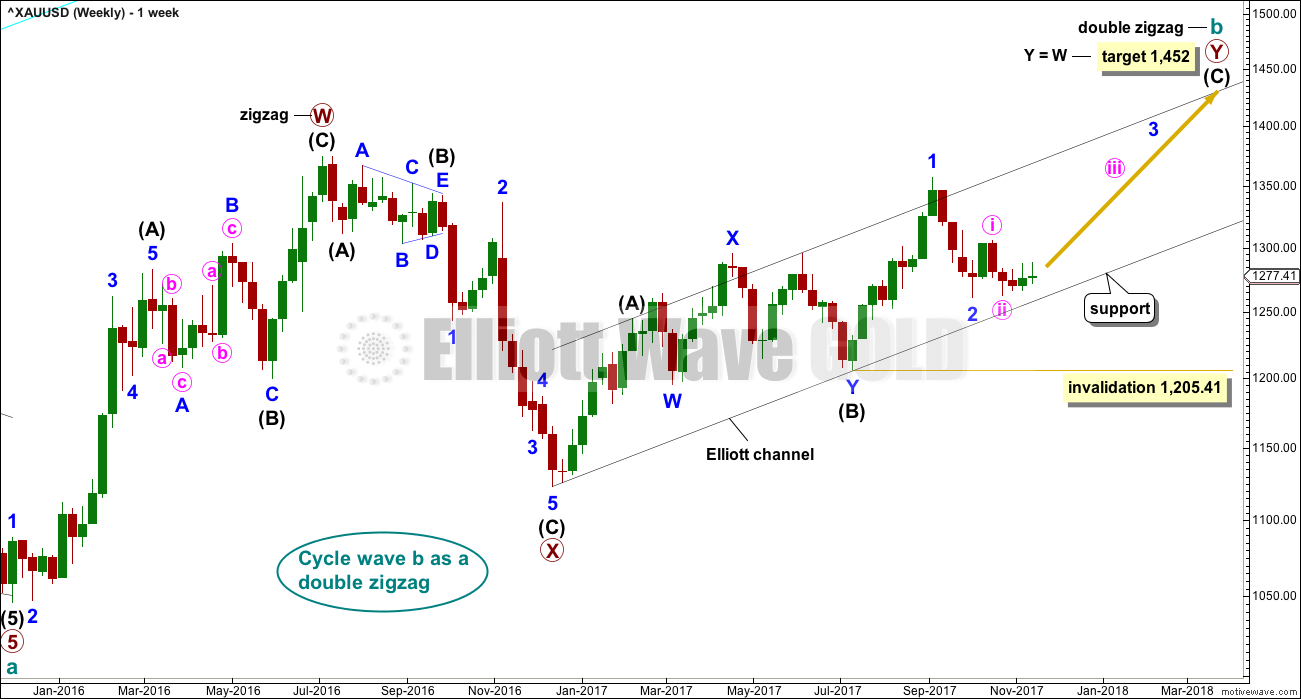
It looks unlikely that cycle wave b may have been over at the high labelled primary wave W. Primary wave W lasted less than one year at only 31 weeks. Cycle waves should last one to several years and B waves tend to be more time consuming than other Elliott waves, so this movement would be too brief for cycle wave b.
This first wave count expects that cycle wave b may be an incomplete double zigzag.
While this first wave count is entirely possible, there are three problems now which reduce its probability.
1. Cycle wave b is a double zigzag, but primary wave X within the double is deep and time consuming. While this is possible, it is much more common for X waves within double zigzags to be brief and shallow.
2. Intermediate wave (B) within the zigzag of primary wave Y is a double flat correction. These are extremely rare, even rarer than running flats. The rarity of this structure must further reduce the probability of this wave count.
3. Although intermediate wave (C) should be continuing so that primary wave Y ends substantially above the end of primary wave W, the duration and depth of minor wave 2 within it now looks to be too large at the weekly time frame.
Within intermediate wave (C), no second wave correction may move beyond the start of its first wave below 1,205.41. However, prior to invalidation, this wave count may be discarded if price breaks below the lower edge of the black Elliott channel. If this wave count is correct, then intermediate wave (C) should not break below the Elliott channel which contains the zigzag of primary wave Y upwards.
DAILY CHART
Click chart to enlarge.
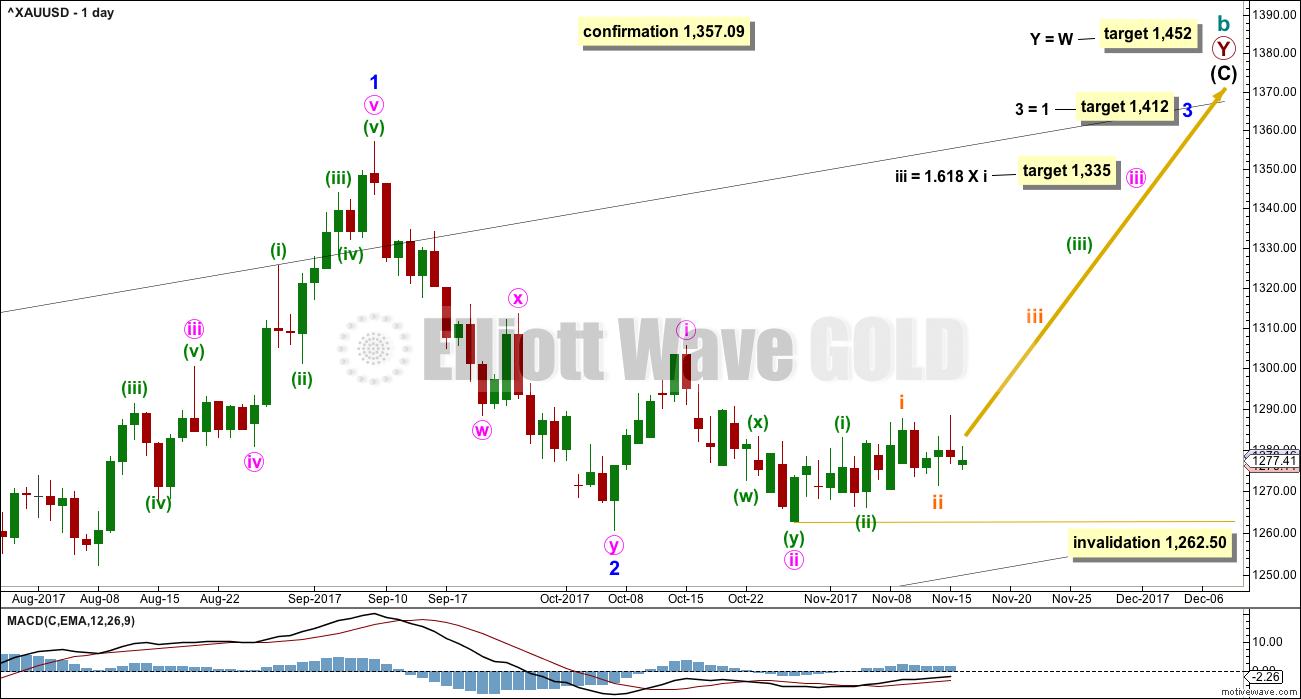
The analysis will focus on the structure of intermediate wave (C). To see details of all the bull movement for this year see daily charts here.
Intermediate wave (C) must be a five wave structure, either an impulse or an ending diagonal. It is unfolding as the more common impulse.
Minor wave 1 was a long extension. The target for minor wave 3 expects that too to be a long extension. If this is the case, then minor wave 5 may be shorter (only two actionary waves in an impulse may be extended).
The target for minute wave iii fits with higher targets and expects it to exhibit the most common Fibonacci ratio to minute wave i.
If price makes a new high above 1,357.09, then the second wave count below would be discarded and more confidence may be had in this first wave count.
This first wave count expects now that recent movement should be the start of a third wave. Price is not behaving like it is within a third wave at minor degree, it is too slow and weak. This first wave count is further reduced in probability.
HOURLY CHART
Click chart to enlarge.
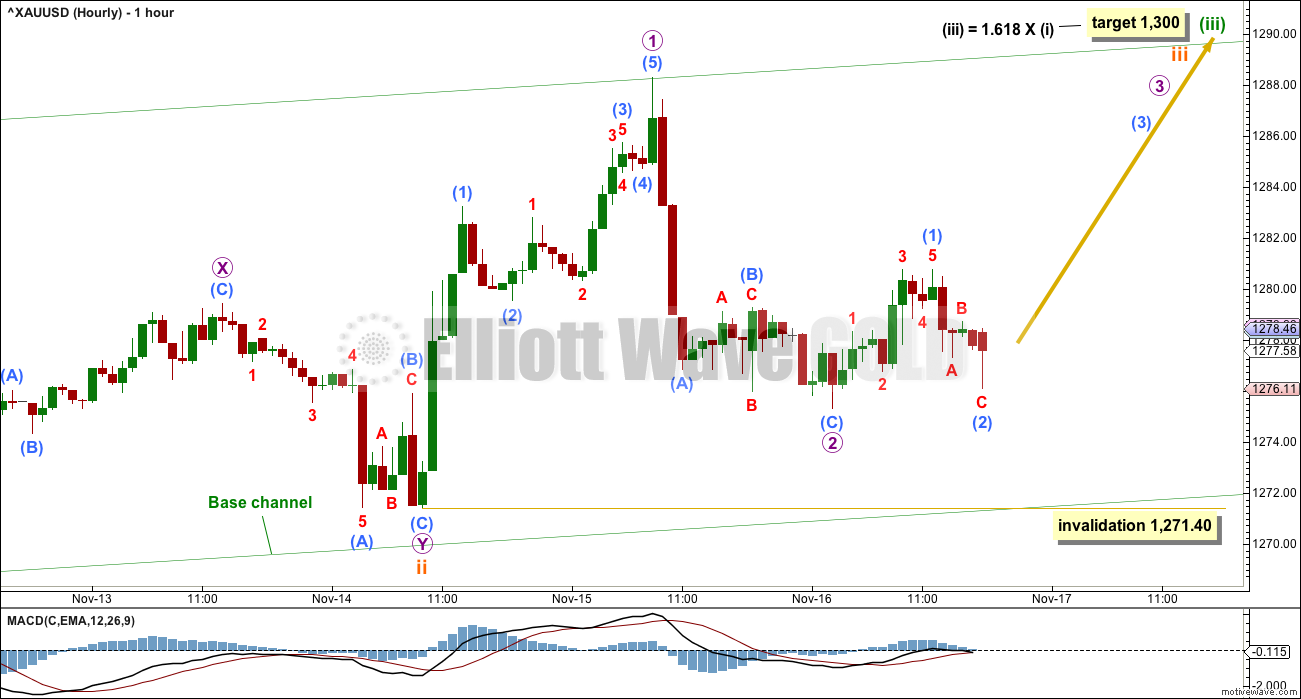
Minuette wave (iii) may have begun with a leading contracting diagonal for subminuette wave i. Leading diagonals in first wave positions are commonly followed by very deep second waves. Here, subminuette wave ii is a 0.76 correction of subminuette wave i, meeting the definition of very deep. The structure is now complete as a double zigzag.
Subminuette wave iii may only subdivide as an impulse. This first wave count now expects that there should be a series of six overlapping first and second waves. At this stage, within minor wave 3, price should not be moving this slowly. Although this wave count is published first, it is my judgement today that this wave count has the lowest probability.
SECOND ELLIOTT WAVE COUNT
WEEKLY CHART
Click chart to enlarge.
Both wave counts are identical to the low labelled cycle wave a. Thereafter, they look at different possible structures for cycle wave b.
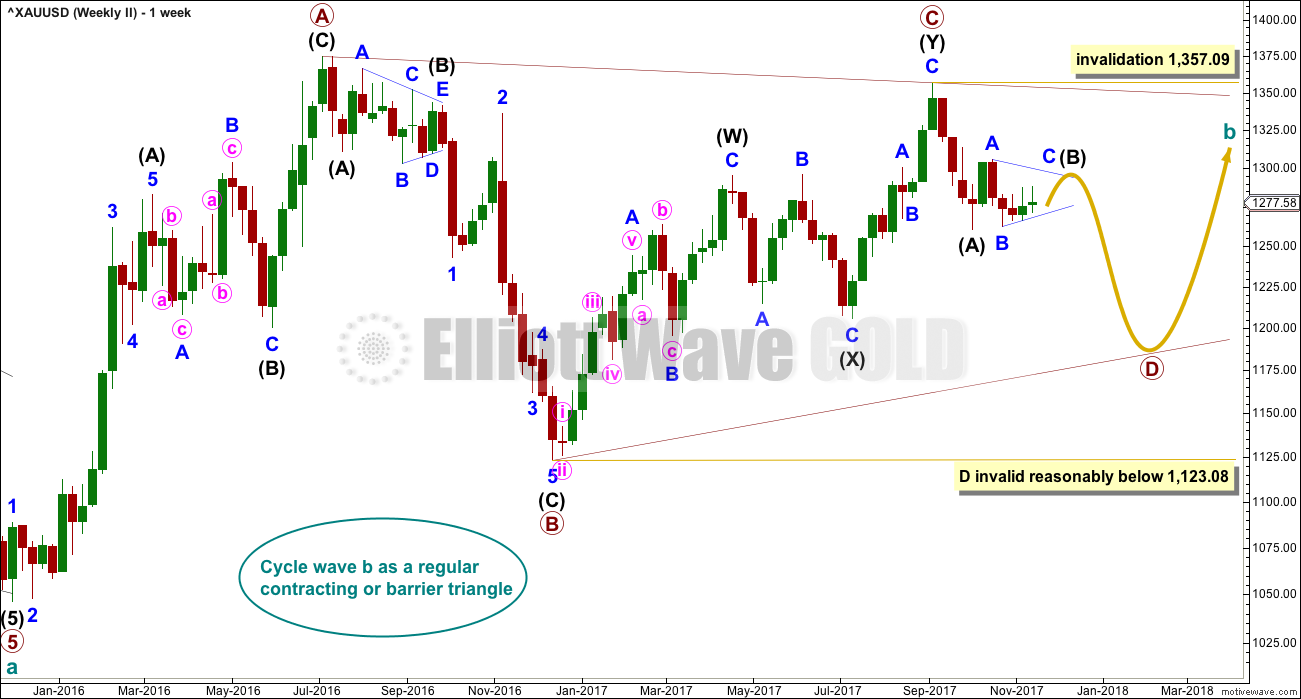
This wave count looks at cycle wave b to be most likely a regular contracting triangle.
The B-D trend line should have a reasonable slope for this triangle to have the right look, because the A-C trend line does not have a strong slope. A barrier triangle has a B-D trend line that is essentially flat; if that happened here, then the triangle trend lines would not converge with a normal look and that looks unlikely.
Primary wave D should be a single zigzag. Only one triangle sub-wave may be a more complicated multiple, and here primary wave C has completed as a double zigzag. This is the most common triangle sub-wave to subdivide as a multiple.
Primary wave D of a contracting triangle may not move beyond the end of primary wave B below 1,123.08.
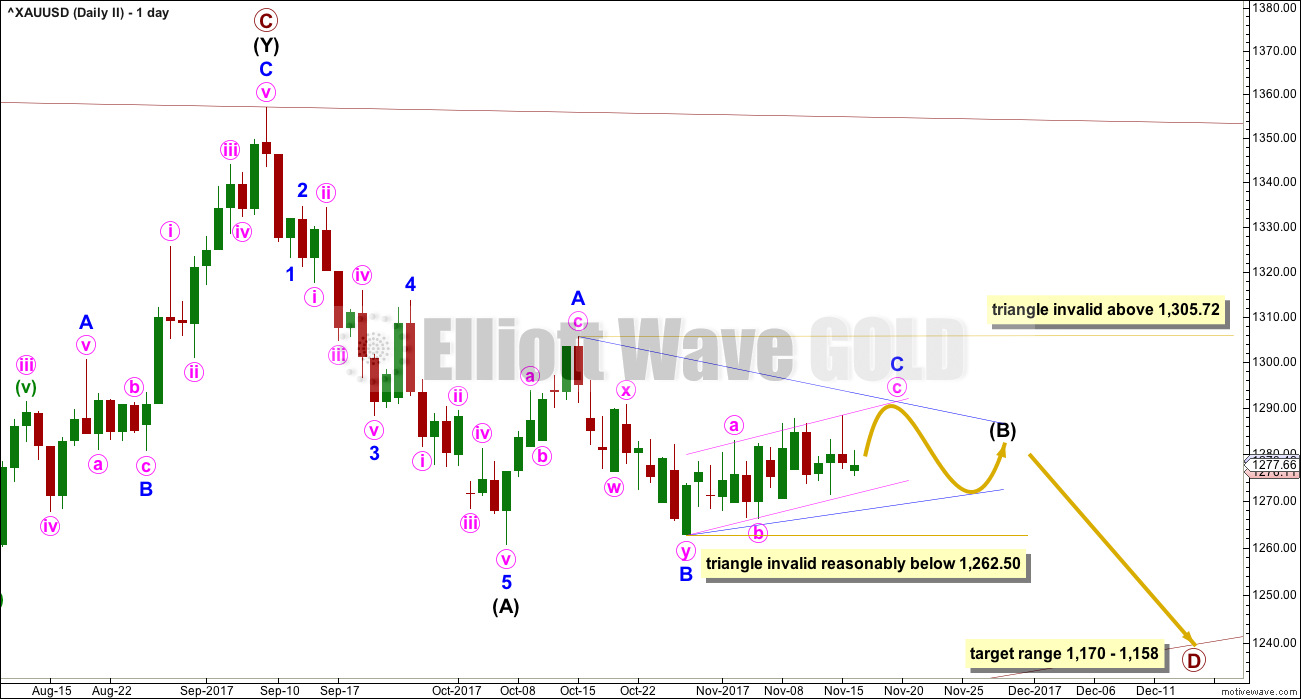
At its completion, primary wave D should be an obvious three wave structure at the weekly chart level. Within primary wave D, intermediate wave (B) is incomplete. At this stage, it looks like intermediate wave (B) may be unfolding as a triangle. This now has a better fit at the daily and hourly chart level. At its conclusion, intermediate wave (B) should look like a corrective structure at the weekly chart level.
DAILY CHART
Click chart to enlarge.
At this stage, intermediate wave (B) looks incomplete.
A common length for triangle sub-waves is from 0.8 to 0.85 the length of the prior wave. Primary wave D would reach this range from 1,170 to 1,158.
Intermediate wave (A) lasted twenty days, just one short of a Fibonacci twenty-one. Intermediate wave (B) may be about the same duration, so that this wave count has good proportions, or it may be longer because B waves tend to be more complicated and time consuming.
So far intermediate wave (B) has lasted twenty-nine sessions, it is incomplete and needs several more sessions now to complete. The next Fibonacci ratio in the sequence is thirty four. If intermediate wave (B) completes as a triangle, then it may not end within a total Fibonacci thirty-four sessions and may need longer than that for the structure to complete. It may either not exhibit a Fibonacci duration, or it may last a total Fibonacci fifty-five sessions.
At this stage, intermediate wave (B) will be labelled as a triangle.
HOURLY CHART
Click chart to enlarge.
Within the possible triangle for intermediate wave (B), so far it is minor wave B that subdivides best as a double zigzag. This means that all remaining sub-waves of the triangle for intermediate wave (B) must be simple A-B-C structures, most likely zigzags, if that portion of the analysis is correct.
Minor wave C may be a zigzag. The pink Elliott channel is copied over from the daily chart. It is neatly so far showing where price is currently finding resistance and support. Expect this may continue while minor wave C completes.
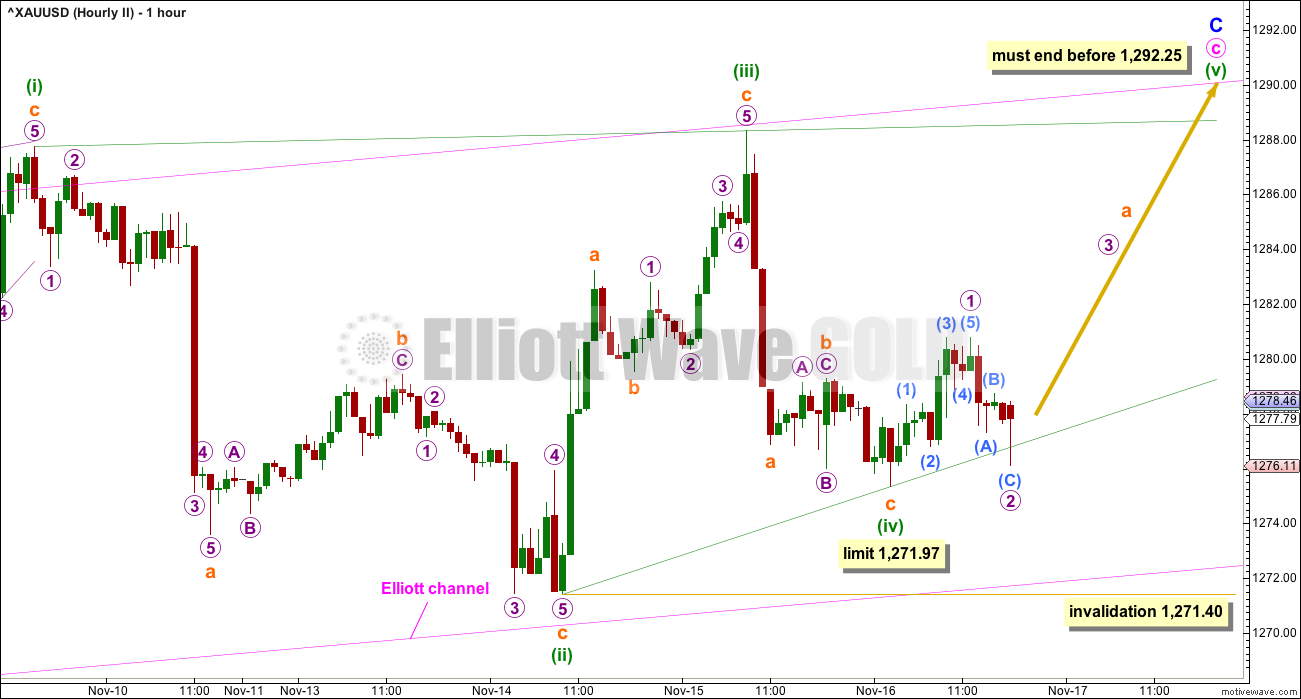
Within minor wave C, minute wave a subdivided as a leading contracting diagonal. Minute wave c may now be completing as an ending contracting diagonal. This neatly explains the overlapping in recent days, while price has been generally trending upwards.
Within ending diagonals, all sub-waves must subdivide as zigzags and the fourth wave must overlap first wave price territory. The fourth wave may not move beyond the end of the second wave below 1,271.40.
Here, minuette wave (iii) is a little shorter than minuette wave (i) indicating a contracting diagonal, which is the most common type. This gives a limit to minuette wave (iv): it may not be longer than minuette wave (ii) for the diagonal wave lengths to meet rules for a contracting diagonal.
The classic pattern equivalent here is a rising wedge. This is the same as an Elliott wave ending diagonal, only the rules for the Elliott wave structure are more clearly defined.
If minuette wave (iv) does move lower here, it must end before 1,271.97.
Thereafter, minuette wave (v) would be extremely likely to end above the end of minuette wave (iii) at 1,288.32 to avoid a truncation. Fifth waves of ending diagonals are almost never truncated. Minuette wave (v) may not be longer than minuette wave (iii), so it has a maximum length of 16.92. If it has already begun, as labelled, then that maximum would be at 1,292.25.
Fifth waves of contracting diagonals almost always end with an overshoot of the 1-3 trend line. The overshoot is often small. If price slightly overshoots the green (i)-(iii) trend line, then look out for a quick sharp reversal.
At this stage, the last hourly candlestick has a very long lower wick, which is very bullish. This indicates a green hourly candlestick to follow for the very short term; if this wave count is correct, then price may move upwards for long enough here to print a green daily candlestick. The last hourly candlestick gives a signal for an entry point at this time.
ALTERNATE HOURLY CHART
Click chart to enlarge.
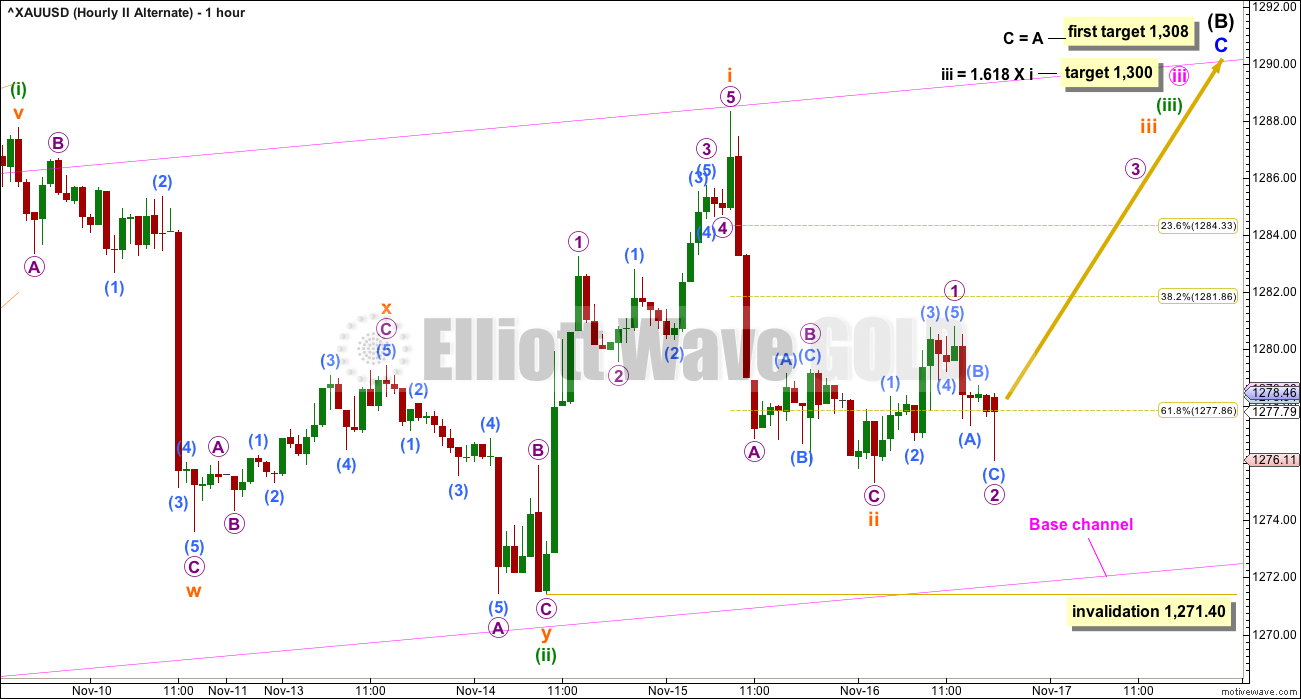
If intermediate wave (B) is unfolding as a flat correction, then minor wave C upwards must subdivide as a five wave structure. It may be either an impulse or an ending diagonal. An impulse is more common, and that will be how it will be labelled until it proves otherwise. If it looks like a rising wedge is unfolding, then an ending diagonal will be published also.
If minor wave C is an impulse, then it would have begun now with four overlapping first and second waves. The slow upwards movement over the last nearly three weeks here is now only somewhat acceptable.
If minor wave C is an impulse, then at this stage it should have begun to show some increase in upwards momentum.
Subminuette wave ii may not move beyond the start of subminuette wave i below 1,271.40.
TECHNICAL ANALYSIS
WEEKLY CHART
Click chart to enlarge. Chart courtesy of StockCharts.com.
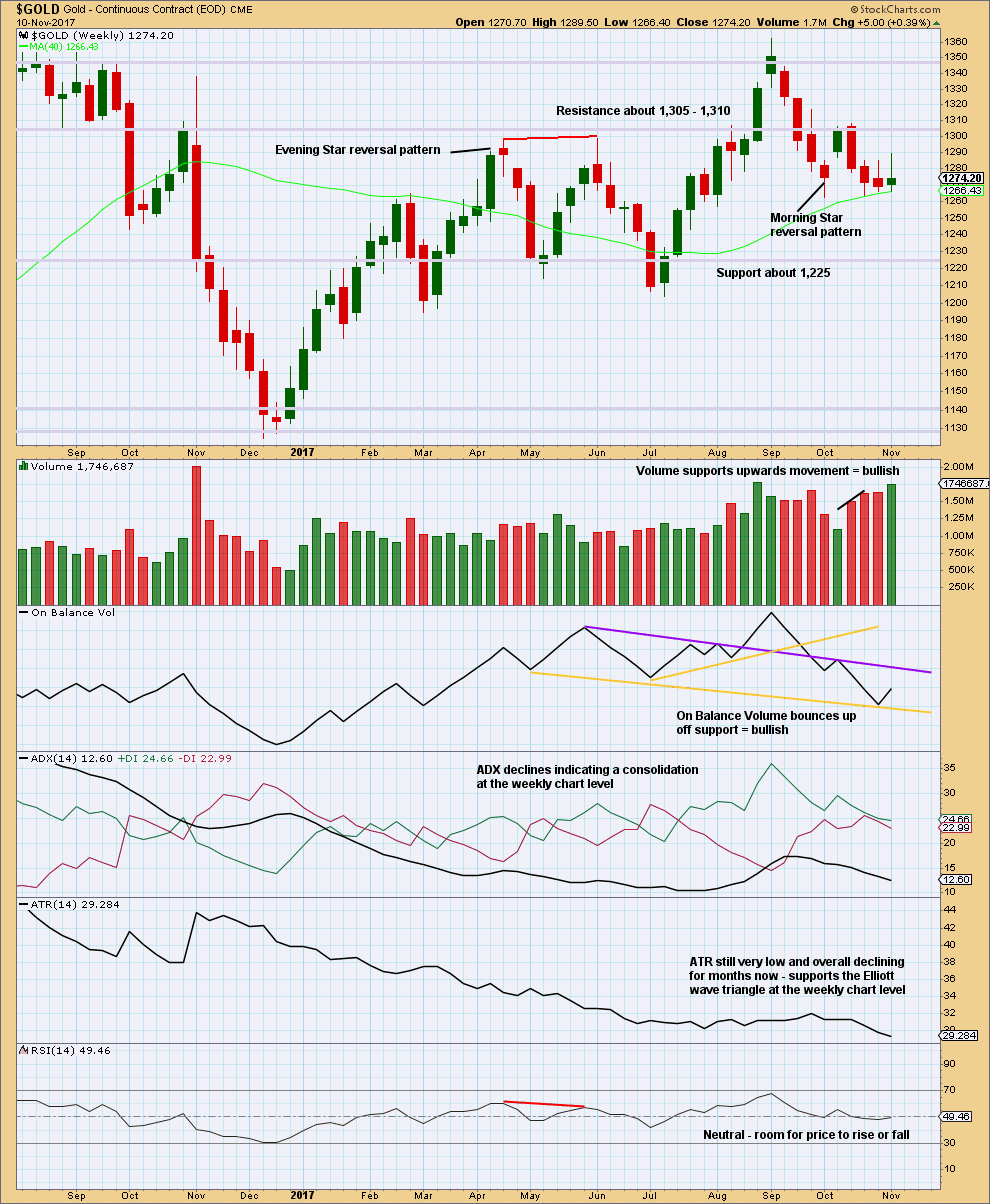
Price has again made a higher high and a higher low for the week and this upwards movement has support from volume.
The long upper wick on this weekly candlestick is bearish.
On Balance Volume gave a weak bearish signal last week with a break below a yellow support line. But then On Balance Volume returned back above that line this week, so the line is adjusted to better show where On Balance Volume is finding support. This may now be read as a weak bullish signal.
DAILY CHART

Click chart to enlarge. Chart courtesy of StockCharts.com.
Price is very clearly consolidating. Expect swings from support to resistance and back again. Use Stochastics in conjunction with support and resistance to signal when each swing ends. When price is at support or resistance and Stochastcis is oversold or overbought at the same time, then expect one swing to end and the next to begin.
Be aware that trading a consolidating market is much more risky than trading a trending market, and reduce risk accordingly. Only experienced traders should consider trading the swings within a consolidation. Reduce risk to 1-3% of equity. Always trade with stops. Here, move stops to a little below support and above resistance to allow for overshoots; give the market room to move.
Consolidating markets are risky because support and resistance may be overshot before price returns to within the consolidation. Price does not move in straight lines during each swing; it is often choppy and overlapping. Consolidations are characterised by declining ATR, as this one is, which makes profitable trades much more difficult.
Patience is required to stand aside and wait for a breakout. Sometimes it is the trades that you do not take that make the difference between profit and loss.
The strongest volume day within the current smaller consolidation delineated by blue trend lines is a downwards day. This suggests a downwards breakout may be more likely. This supports the second wave count.
GDX DAILY CHART
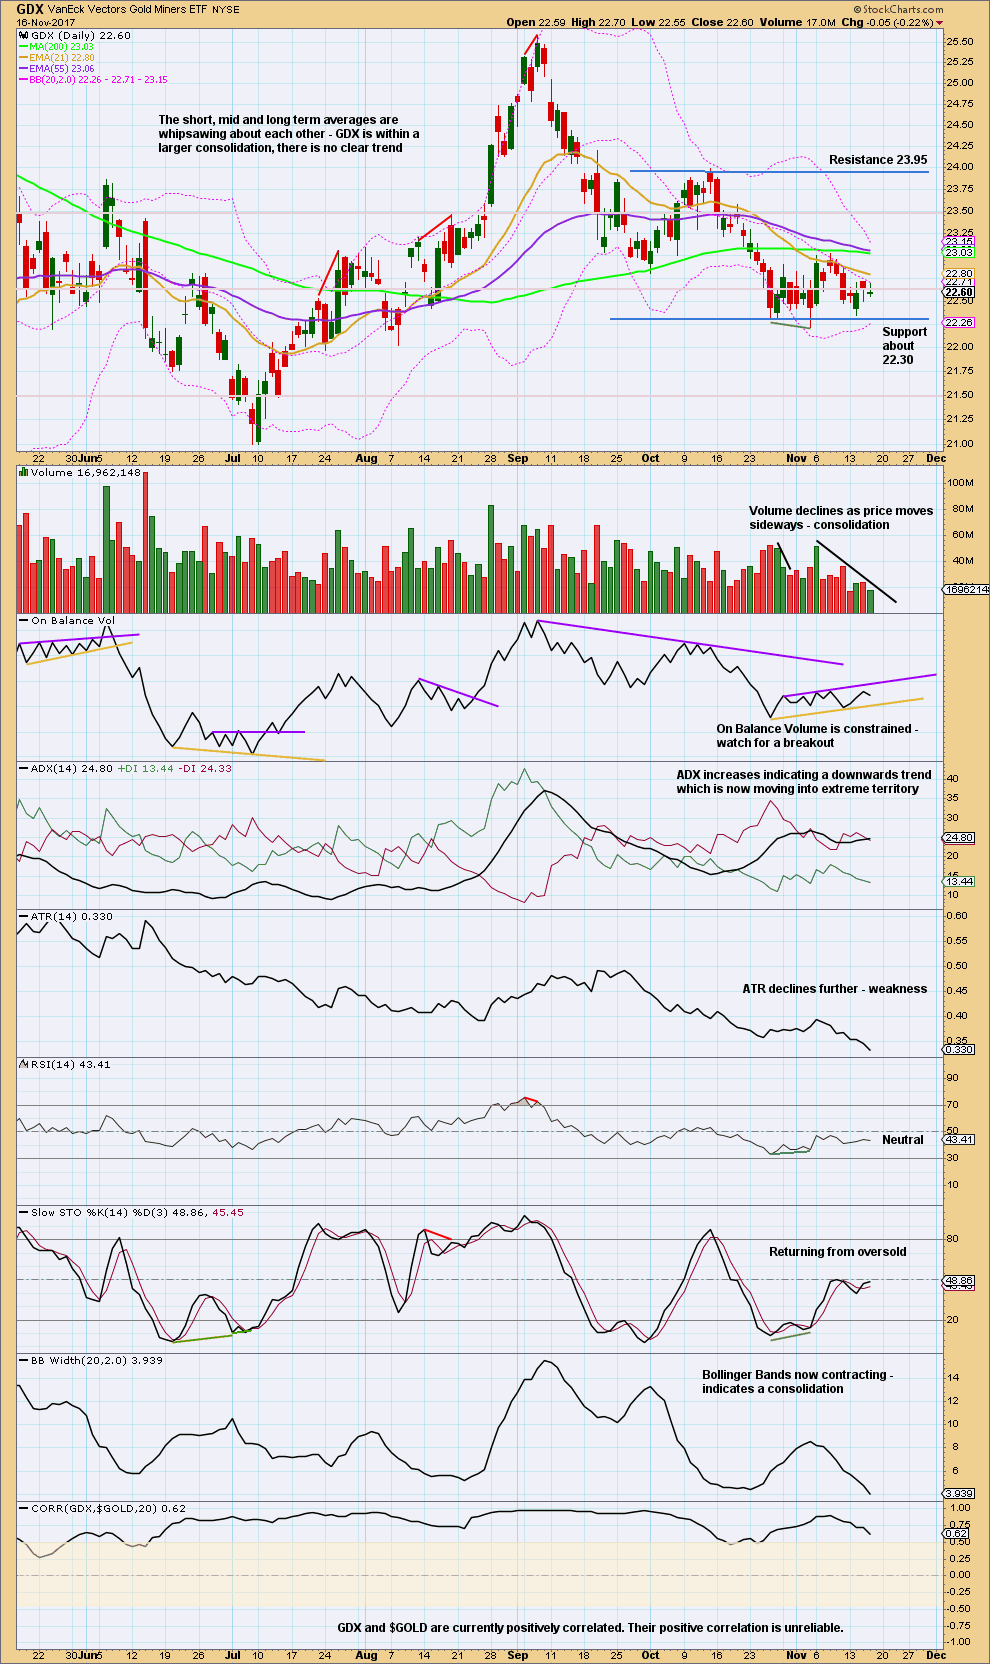
Click chart to enlarge. Chart courtesy of StockCharts.com.
An upwards swing may be expected to continue to resistance about 23.95.
Price does not move in straight lines within consolidations, making them poor trading opportunities. If trading this upwards swing, then reduce risk to only 1-3% of equity to acknowledge higher risk.
Published @ 06:25 p.m. EST..
Updated hourly chart for the second wave count. Labelled alternate in the analysis above, will now revert to being the only hourly count for the second. This is the preferred count.
Subminuette iii may be close to completion. Subminuette iv may not move into submineutte i price territory.
Keep that pink base channel on charts. The upper edge may now provide some support when minute iv turns up.
Minute iv may last one to a few days. Then a final fifth wave up to end minor C.
Well, all wave counts expected price to go up and so finally now we have that movement I’ve been waiting for.
My triangle idea doesn’t look right. I’m reverting to the original now for the second wave count.
And as Nick rightly notes below, I’ve got the preferred wave count in second place. Now, I’ll swap them over again…. but TBH that makes me a bit nervous to try and pick a winner. Because this is a B wave. Swapping wave counts over sometimes draws criticism that I can’t make up my mind or I got it wrong. So I kinda wanted to just present a range of possibilities and let TA guide us as to which is most likely. Changing probability as the structure unfolds and market conditions change.
Rather than presenting in order of probability and then having to swap and swap again as the B wave continues…. because that’s what it will do. Change. Too many structural possibilities still.
Gold moving up nicely today. Hourly for the second count invalidated. Going above 1,300 is very likely now 😀
😀 😀 😀
Lara, why do you publish your highest probability chart as your second count?
Because I published them in the order they were developed, and didn’t want to try and pick a winner. I did that before, and had to switch.
Some signs of life from the Juniors:
> Positive RSI divergence
> Positive STOC divergence
> Bullish OBV
Narrow Bollinger Bands suggest a big move is coming. Just maybe it will be up…
Yeah baby! BIG move. YUGE! Believe me… 😀
Weekly higher lows, higher highs since October 23, 2017 for the last 4 weeks. Possible huge bear flag? Makes sense if Gold price were to fall before getting past 1292! Wonder if Gold price can presently get to and past 1287 and hold above there…. difficult to even put in a nimble scalp trade lol…. 🙂 GL folks and have a great weekend!
Yes, and I did see that possibility. I think that could fit somewhat with the second wave count, although that requires more sideways movement first before a downwards breakout.