
Some downwards movement for the very short term was expected by the preferred Elliott wave count. This is exactly what has happened to end the trading week.
Summary: Members please note: the second wave count is now strongly preferred. It expects sideways movement to continue probably for much of next week, and then a downwards breakout. If this wave count is correct, then the high for Friday may have been a good entry opportunity for a short position. There may be one more entry point on the next upwards swing to come next week.
Always trade with stops and invest only 1-5% of equity on any one trade.
New updates to this analysis are in bold.
Last monthly charts for the main wave count are here, another monthly alternate is here, and video is here.
Grand SuperCycle analysis is here.
To avoid repeatedly swapping wave counts over while cycle wave b continues, they will be labelled in the order they were developed: first, second and third. At this time, the second wave count is preferred because its Elliott wave structure has a better fit and has more support from classic technical analysis.
FIRST ELLIOTT WAVE COUNT
WEEKLY CHART
Click chart to enlarge.
Both wave counts expect that Gold completed a large five down from the all time high in November 2011 to the low of December 2015, which is seen on the left hand side of both weekly charts.
If this analysis is correct, then the five down may not be the completion of the correction. Corrective waves do not subdivide as fives; they subdivide as threes. The five down is seen as cycle wave a within Super Cycle wave (a).
Both wave counts then expect cycle wave b began in December 2015.
There are more than 23 possible corrective structures that B waves may take. It is important to always have multiple wave counts when B waves are expected.
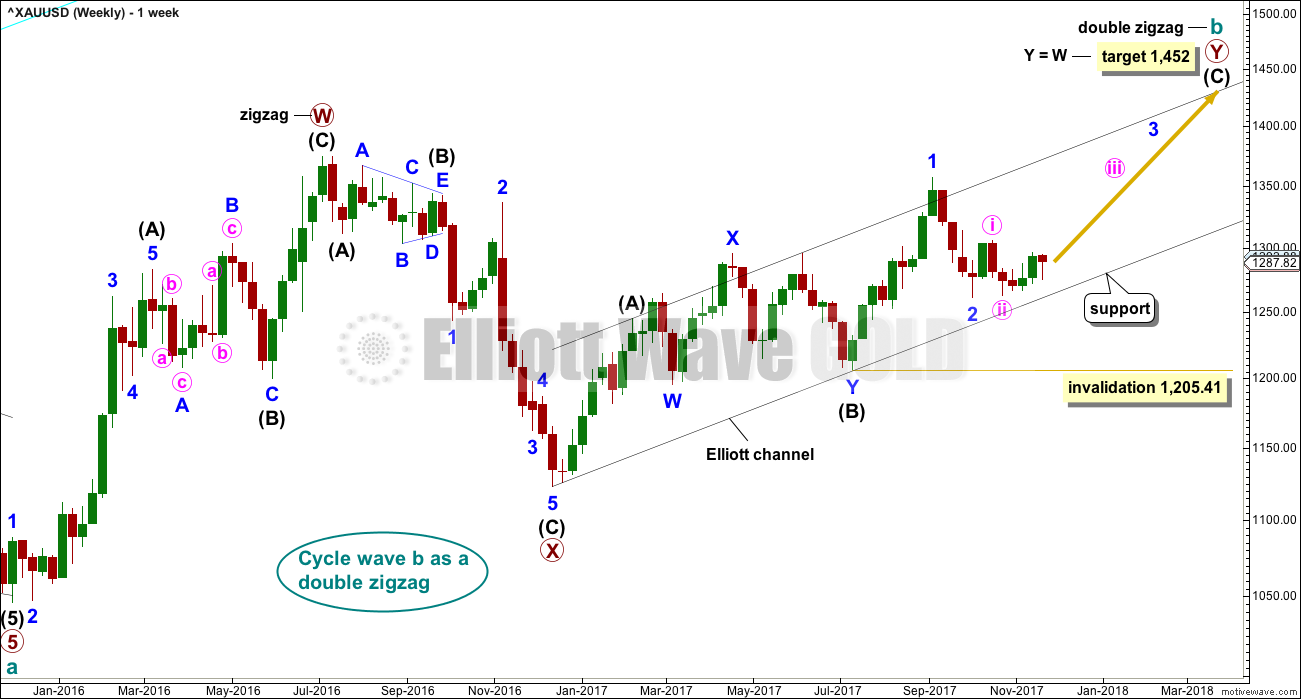
It looks unlikely that cycle wave b may have been over at the high labelled primary wave W. Primary wave W lasted less than one year at only 31 weeks. Cycle waves should last one to several years and B waves tend to be more time consuming than other Elliott waves, so this movement would be too brief for cycle wave b.
This first wave count expects that cycle wave b may be an incomplete double zigzag.
While this first wave count is entirely possible, there are three problems now which reduce its probability.
1. Cycle wave b is a double zigzag, but primary wave X within the double is deep and time consuming. While this is possible, it is much more common for X waves within double zigzags to be brief and shallow.
2. Intermediate wave (B) within the zigzag of primary wave Y is a double flat correction. These are extremely rare, even rarer than running flats. The rarity of this structure must further reduce the probability of this wave count.
3. Although intermediate wave (C) should be continuing so that primary wave Y ends substantially above the end of primary wave W, the duration of minor wave 2 within it now looks to be too large at the weekly time frame.
Within intermediate wave (C), no second wave correction may move beyond the start of its first wave below 1,205.41. However, prior to invalidation, this wave count may be discarded if price breaks below the lower edge of the black Elliott channel. If this wave count is correct, then intermediate wave (C) should not break below the Elliott channel which contains the zigzag of primary wave Y upwards.
DAILY CHART
Click chart to enlarge.
The analysis will focus on the structure of intermediate wave (C). To see details of all the bull movement for this year see daily charts here.
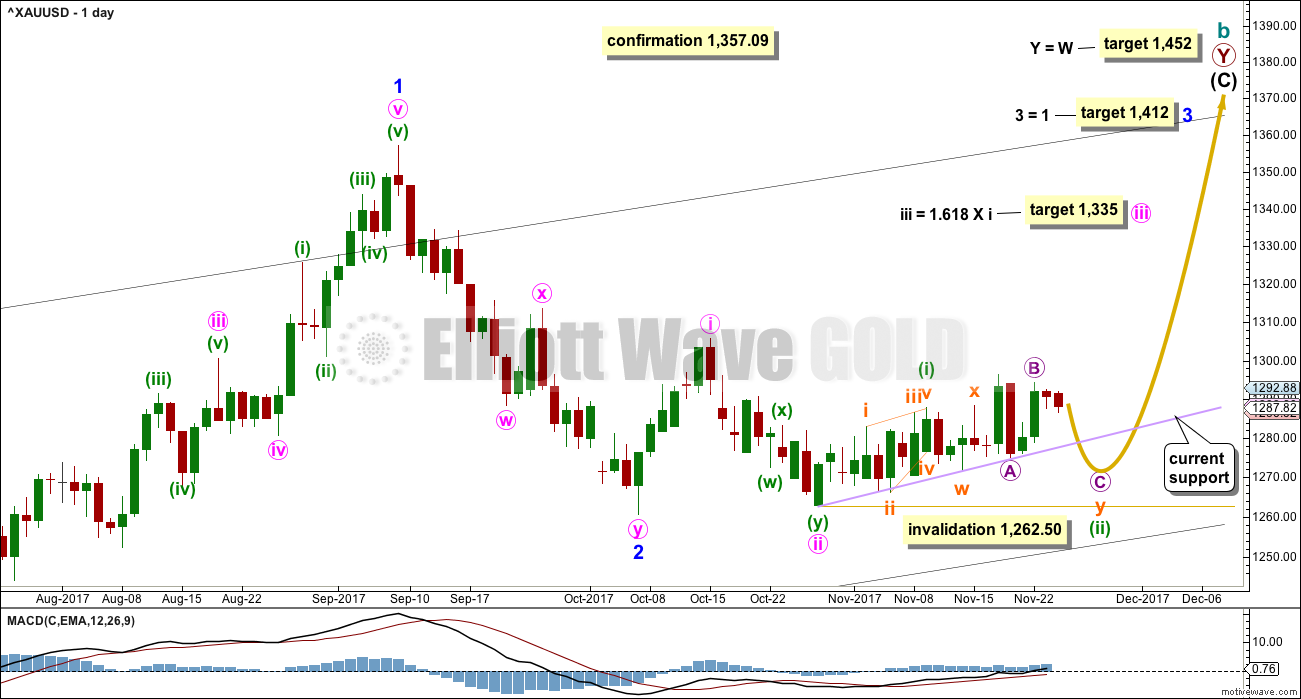
Intermediate wave (C) must be a five wave structure, either an impulse or an ending diagonal. It is unfolding as the more common impulse.
Minor wave 1 was a long extension. The target for minor wave 3 expects that too may be a long extension. If this is the case, then minor wave 5 may be shorter (only two actionary waves in an impulse may be extended).
The target for minute wave iii fits with higher targets and expects it to exhibit the most common Fibonacci ratio to minute wave i.
If price makes a new high above 1,357.09, then the second wave count below would be discarded and more confidence may be had in this first wave count.
This first wave count now expects there should be a series of three overlapping first and second waves: minor, minute, and minuette. At the end of this week, analysis of most recent movement is changed to see sideways movement over the last two weeks as a double combination for minuette wave (ii).
The base channel about minuette waves (i) and (ii) is removed; if minuette wave (ii) is incomplete, then a base channel cannot yet be drawn. A support line is added in lilac to show where price has found support for the last few weeks.
HOURLY CHART
Click chart to enlarge.
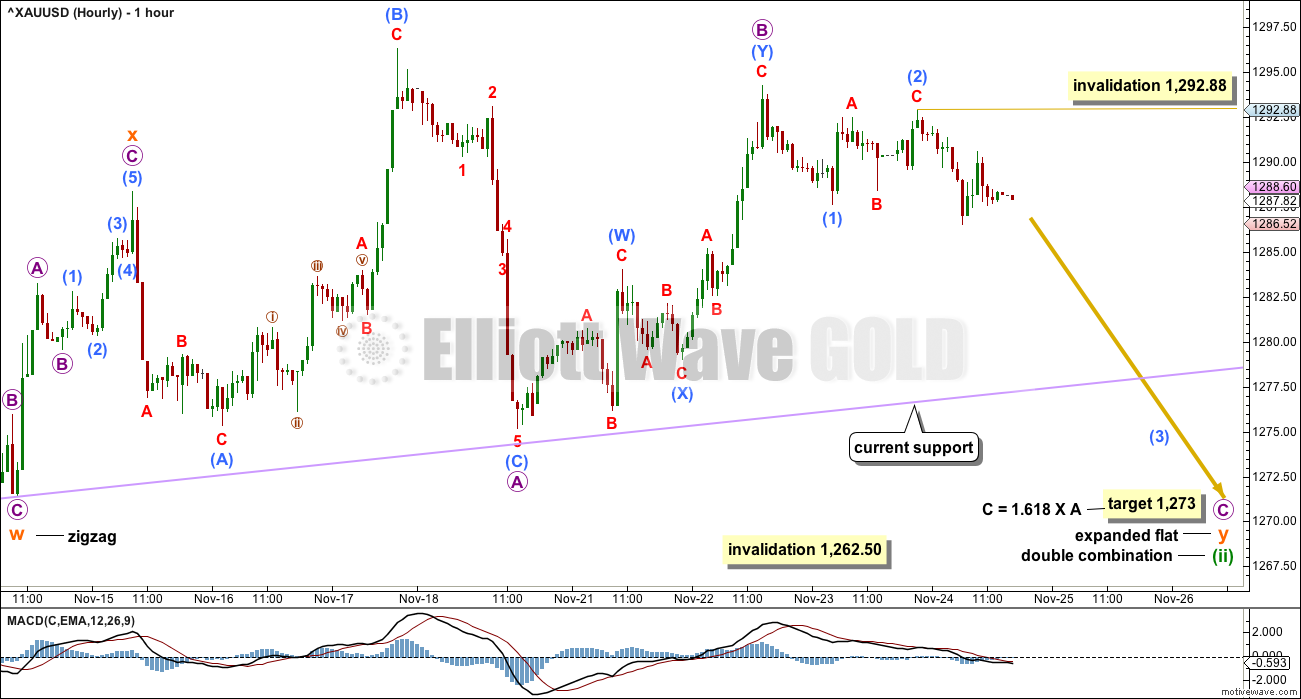
This wave count now has a better fit for recent movement.
This hourly chart shows the latter half of a possible double combination, labelled minuette wave (ii).
The first structure in a double combination may have been a zigzag labelled subminuette wave w. The double is joined by a three in the opposite direction, a zigzag labelled subminuette wave x. The second structure in the double may be an expanded flat correction labelled subminuette wave y.
The target expects micro wave C to exhibit the most common Fibonacci ratio to micro wave A. This would see subminuette wave y end close to the same level as subminuette wave w, achieving the purpose of the second structure in a double, which is to move price sideways and take up time.
If this re-analysis is correct, then the conclusion would be for some downwards movement to begin next week.
SECOND ELLIOTT WAVE COUNT
WEEKLY CHART
Click chart to enlarge.
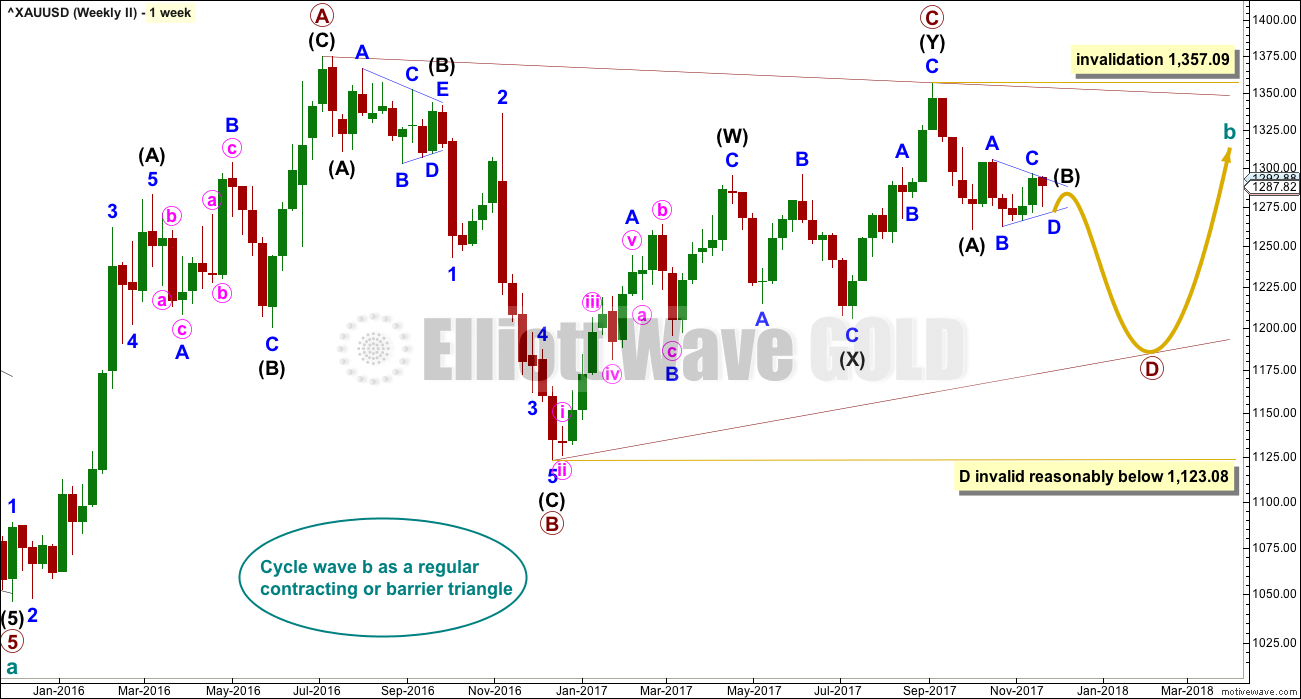
Both wave counts are identical to the low labelled cycle wave a. Thereafter, they look at different possible structures for cycle wave b.
This wave count looks at cycle wave b to be most likely a regular contracting triangle.
The B-D trend line should have a reasonable slope for this triangle to have the right look, because the A-C trend line does not have a strong slope. A barrier triangle has a B-D trend line that is essentially flat; if that happened here, then the triangle trend lines would not converge with a normal look and that looks unlikely.
Primary wave D should be a single zigzag. Only one triangle sub-wave may be a more complicated multiple, and here primary wave C has completed as a double zigzag. This is the most common triangle sub-wave to subdivide as a multiple.
Primary wave D of a contracting triangle may not move beyond the end of primary wave B below 1,123.08.
At its completion, primary wave D should be an obvious three wave structure at the weekly chart level. Within primary wave D, intermediate wave (B) is incomplete. At this stage, it looks like intermediate wave (B) may be unfolding as a triangle. This now has a better fit at the daily and hourly chart level. At its conclusion, intermediate wave (B) should look like a corrective structure at the weekly chart level.
DAILY CHART
Click chart to enlarge.
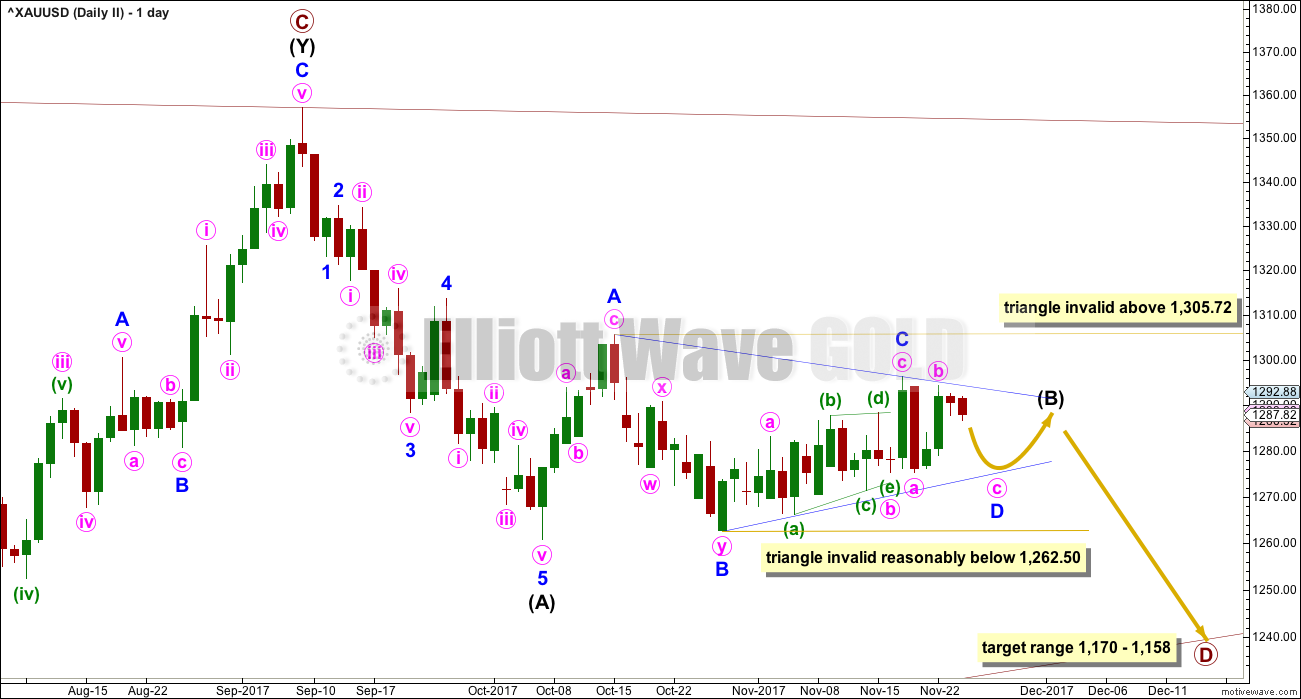
This is the preferred wave count.
A common length for triangle sub-waves is from 0.8 to 0.85 the length of the prior wave. Primary wave D would reach this range from 1,170 to 1,158.
Primary wave D should subdivide as a zigzag, and within it intermediate wave (B) looks incomplete.
So far intermediate wave (B) has lasted thirty-five sessions; it is incomplete and needs several more sessions now to complete. If intermediate wave (B) completes as a triangle, then it may either not exhibit a Fibonacci duration, or it may last a total Fibonacci fifty-five sessions.
At this stage, intermediate wave (B) will be labelled as a triangle.
Within the triangle of intermediate wave (B), the zigzag of minor wave C may now be complete.
For a contracting triangle, minor wave D may not move beyond the end of minor wave B below 1,262.50. For a barrier triangle, minor wave D may end about the same level as minor wave B at 1,262.50. The triangle for intermediate wave (B) will remain valid as long as the lower B-D trend line remains essentially flat. Unfortunately, this is the only Elliott wave rule which is not black and white; it involves a subjective grey area.
When minor wave D is complete, then a final zigzag upwards for minor wave E should unfold. Minor wave E would most likely fall short of the A-C trend line. If it does not end there, it may overshoot the trend line slightly. Minor wave E may not move beyond the end of minor wave C.
Although minor wave C now looks most likely complete, patience and flexibility are important when triangles are considered. The upper invalidation point will be left at the same point to allow for the possibility that minor wave C may not be complete and may yet move higher. It may not move beyond the end of minor wave A above 1,305.72.
Triangles normally adhere very well to their trend lines and fairly often the trend lines are tested within the triangle sub-waves. This so far looks typical. If this wave count is correct, then price should find very strong resistance at this stage at the A-C trend line.
HOURLY CHART
Click chart to enlarge.
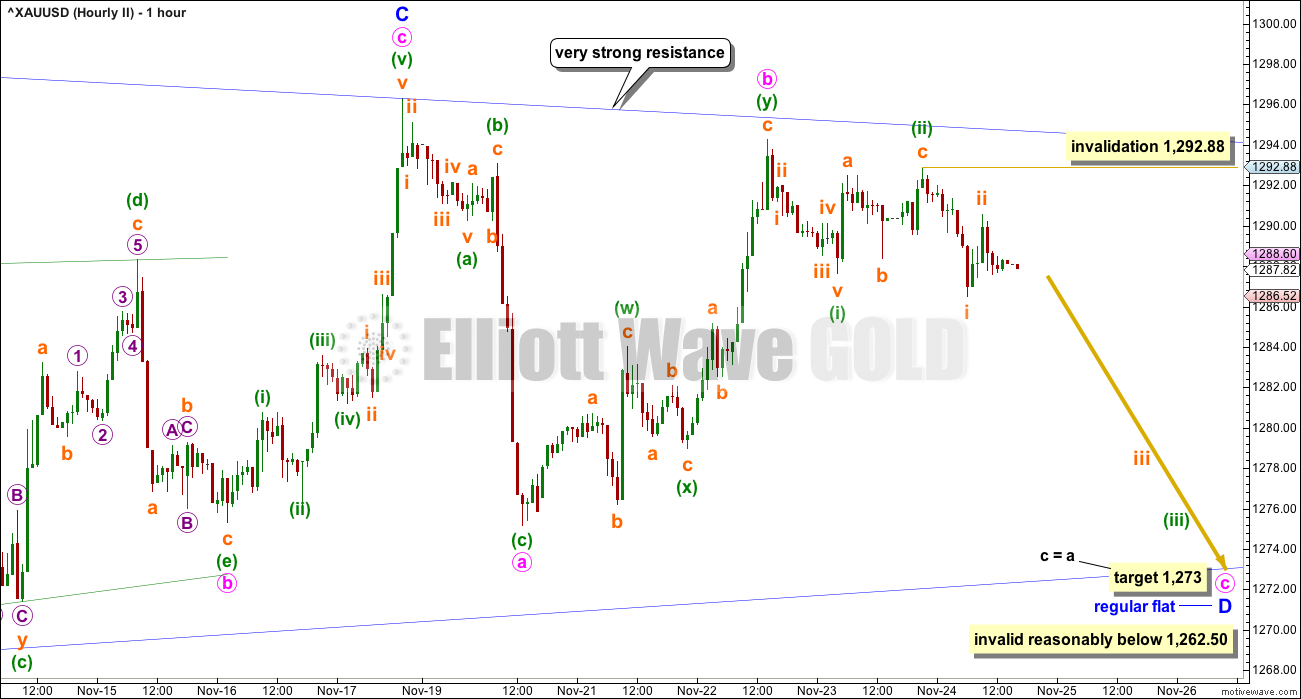
Within the possible triangle for intermediate wave (B), so far it is minor wave B that subdivides best as a double zigzag. This means that all remaining sub-waves of the triangle for intermediate wave (B) must be simple A-B-C structures, most likely zigzags, if that portion of the analysis is correct.
Minor wave C now looks complete. Minor wave D downwards should have begun and must subdivide as a simple A-B-C structure; the most common structure would be a zigzag by a reasonable margin.
While minor wave D would most likely be a zigzag, it does not have to be. A regular flat correction has a better fit at this stage, and will still meet Elliott wave rules for a triangle.
Within the possible regular flat, both minute waves a and b subdivide as threes: minute wave a as a single zigzag and minute wave b as a double zigzag. This portion of the wave count still has a better fit than the first and third Elliott wave counts.
Minute wave b may have ended almost at the upper A-C triangle trend line. Minute wave b is a 0.90 length of minute wave a, meeting the minimum requirement for B waves within flats.
A target is calculated for minute wave c.
Minute wave c must subdivide as a five wave structure. So far minuette waves (i) and now also (ii) may be complete. Minuette wave (iii) downwards must subdivide as an impulse.
Within minuette wave (iii), the correction for subminuette wave ii may not move beyond the start of subminuette wave i above 1,292.88.
Minor wave D may not move reasonably below 1,262.50.
THIRD ELLIOTT WAVE COUNT
DAILY CHART
Click chart to enlarge.
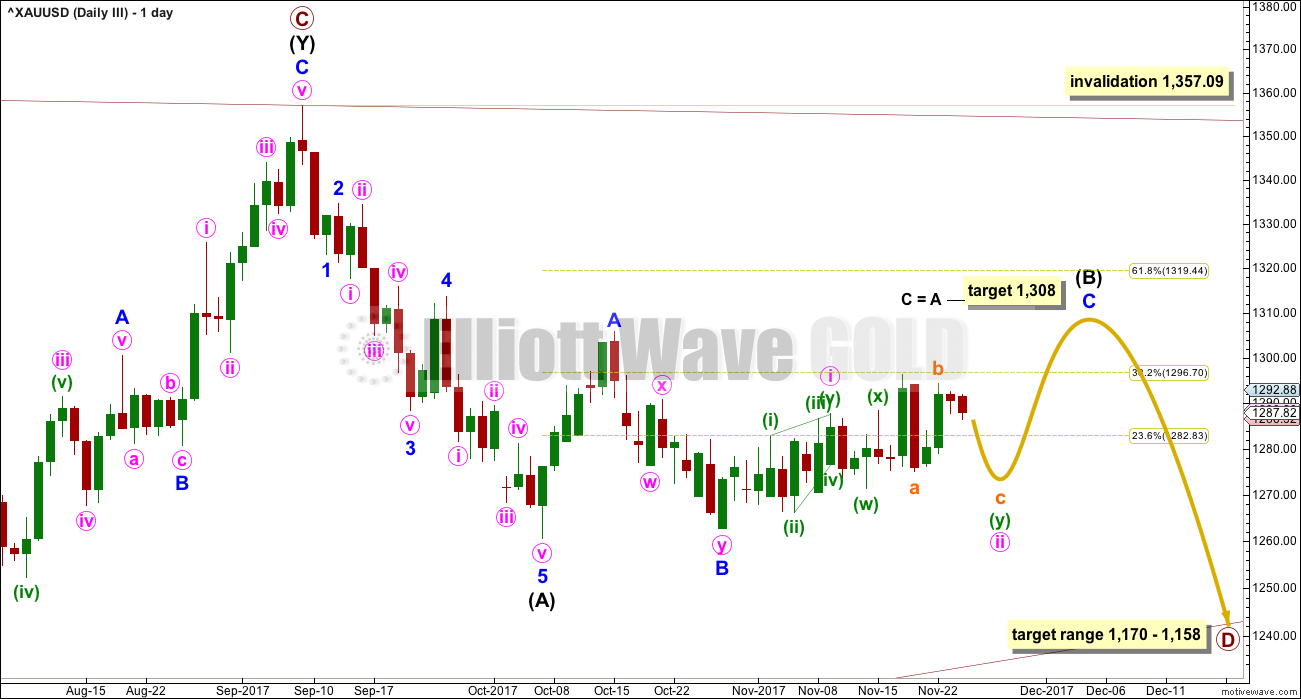
This third wave count looks at intermediate wave (B) as a flat correction. Within a zigzag, minor wave C would need further upwards movement for the structure to complete. The target at 1,308 remains the same.
Minor wave C must subdivide as a five wave structure. So far within it, minute waves i and ii, and minuette waves (i) and (ii), may be complete.
Analysis of most recent movement is seen in the same way as for the first wave count.
This wave count would now expect a breach of the upper edge of the pink base channel. Third waves should have the power to break through base channels in the direction of the trend.
At the hourly chart level, this third wave count sees subdivisions for most recent movement of the last few weeks in the same way as the first wave count. The degree of labelling would be one degree higher.
Because this third and the first wave count are the same at the hourly chart level, only one will be published at this time.
TECHNICAL ANALYSIS
WEEKLY CHART
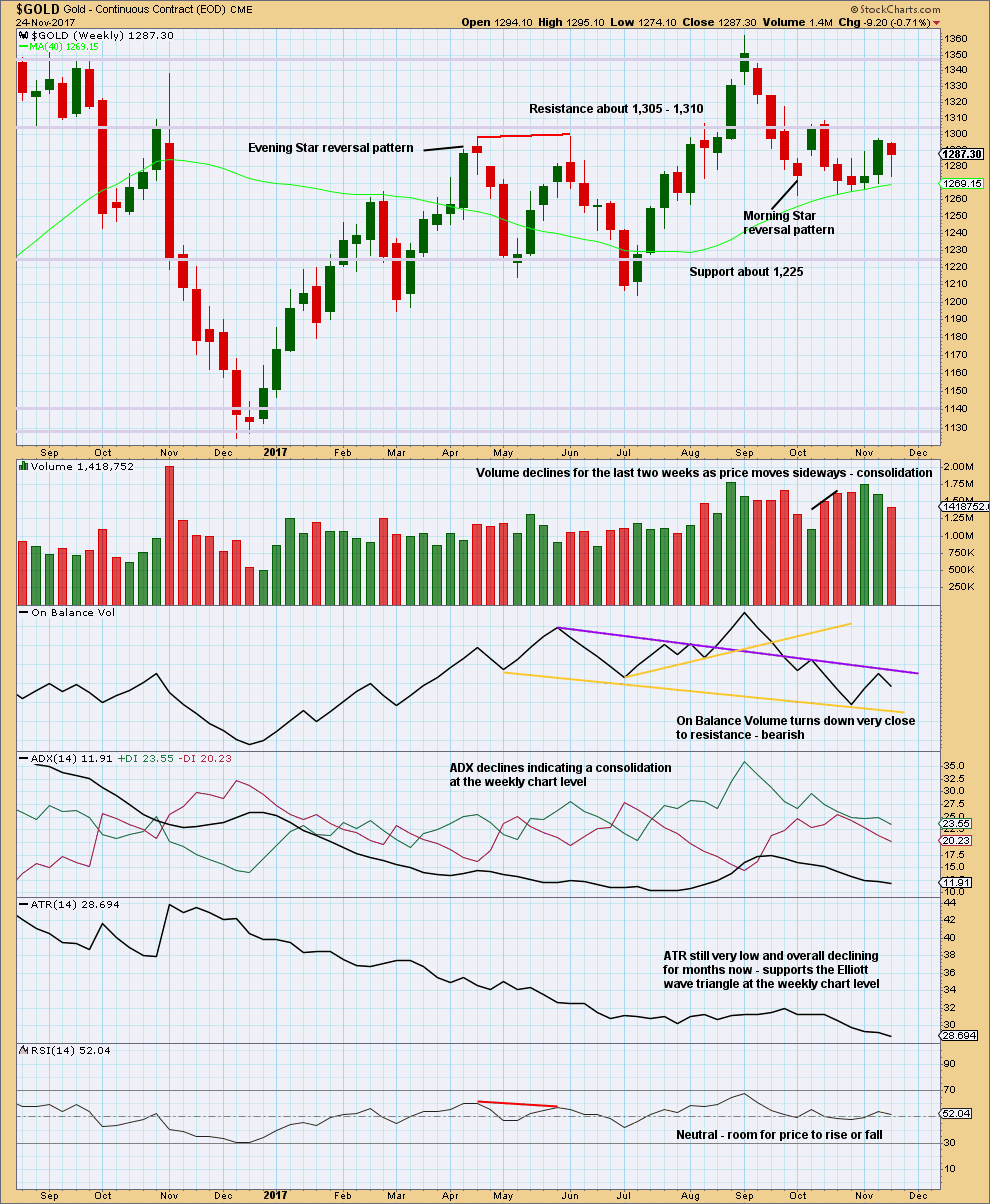
Click chart to enlarge. Chart courtesy of StockCharts.com.
On Balance Volume is constrained, but this week it gives a bearish signal. This supports the idea for the short term that some downwards movement may begin next week.
DAILY CHART
Click chart to enlarge. Chart courtesy of StockCharts.com.
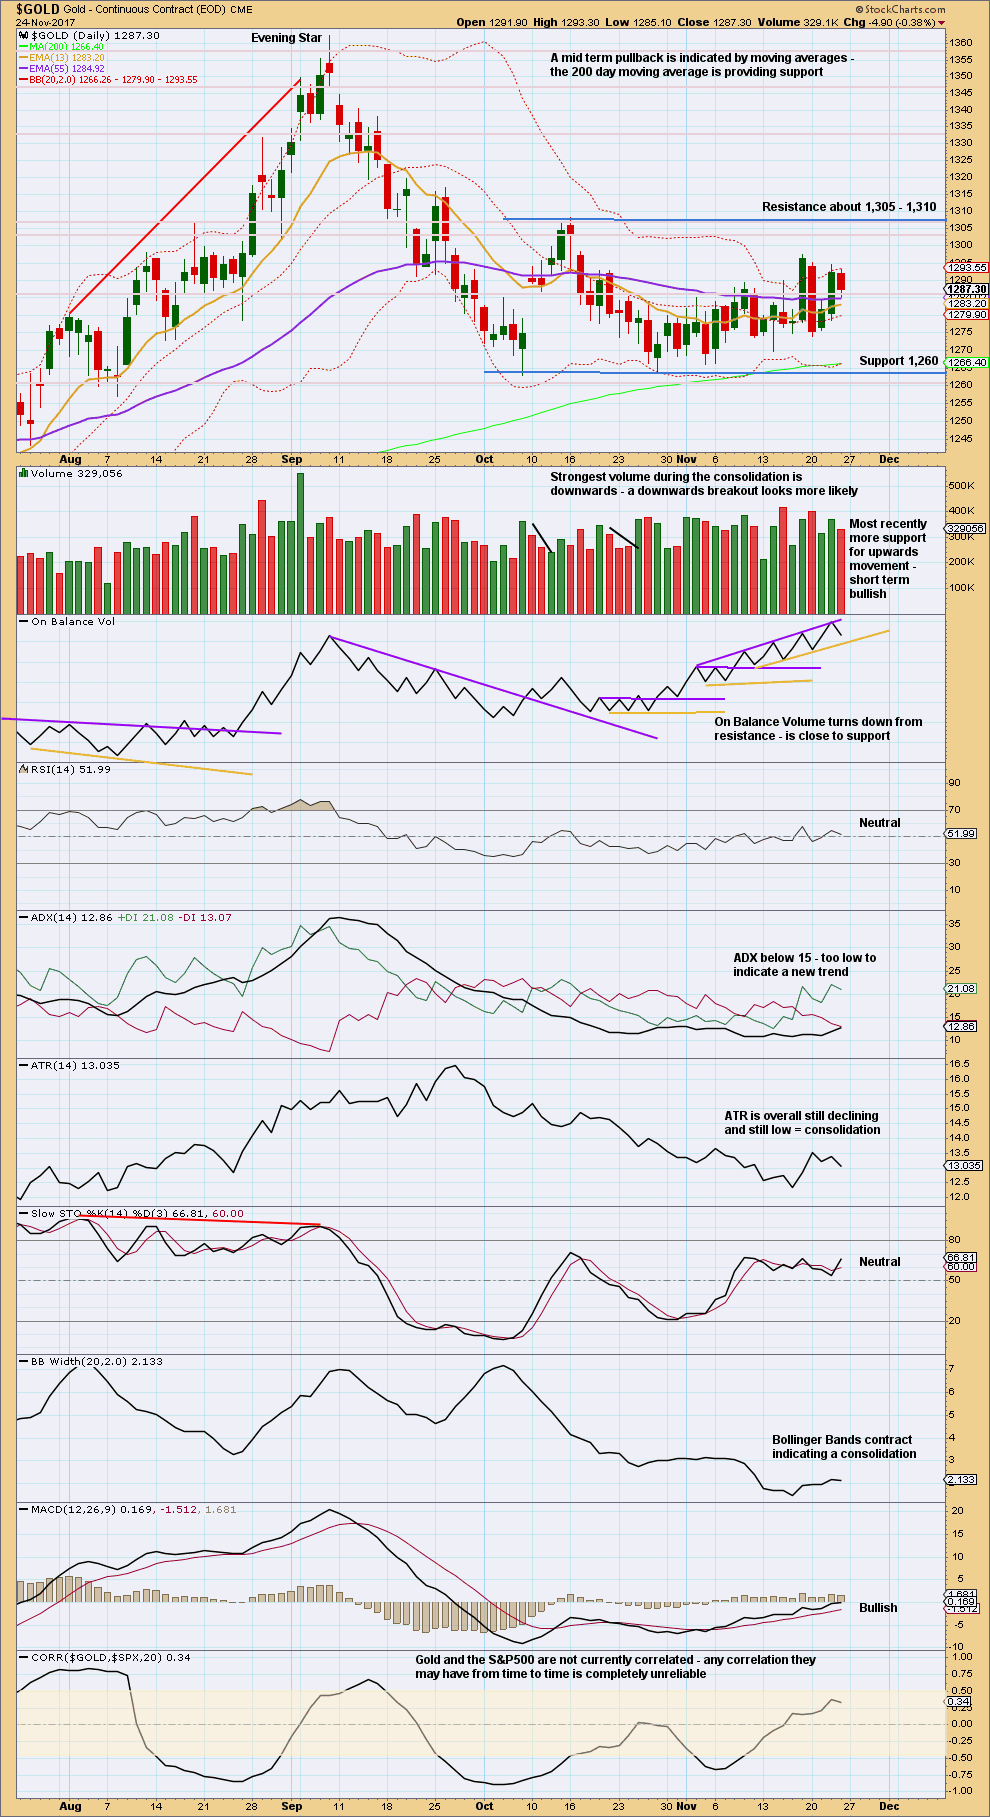
While volume for the very short term is bullish, the last signal here from On Balance Volume is bearish. On Balance Volume is constrained, but there is a little room here for some more downwards movement. This may fit with the hourly Elliott wave counts.
Towards the conclusion of Elliott wave triangles, MACD will often come to the zero line and remain flat there for some time. That may be happening now; when this happens, it offers just a little confidence to a triangle wave count. But because MACD can also behave like this during combinations, it is not conclusive.
GDX DAILY CHART
Click chart to enlarge. Chart courtesy of StockCharts.com.
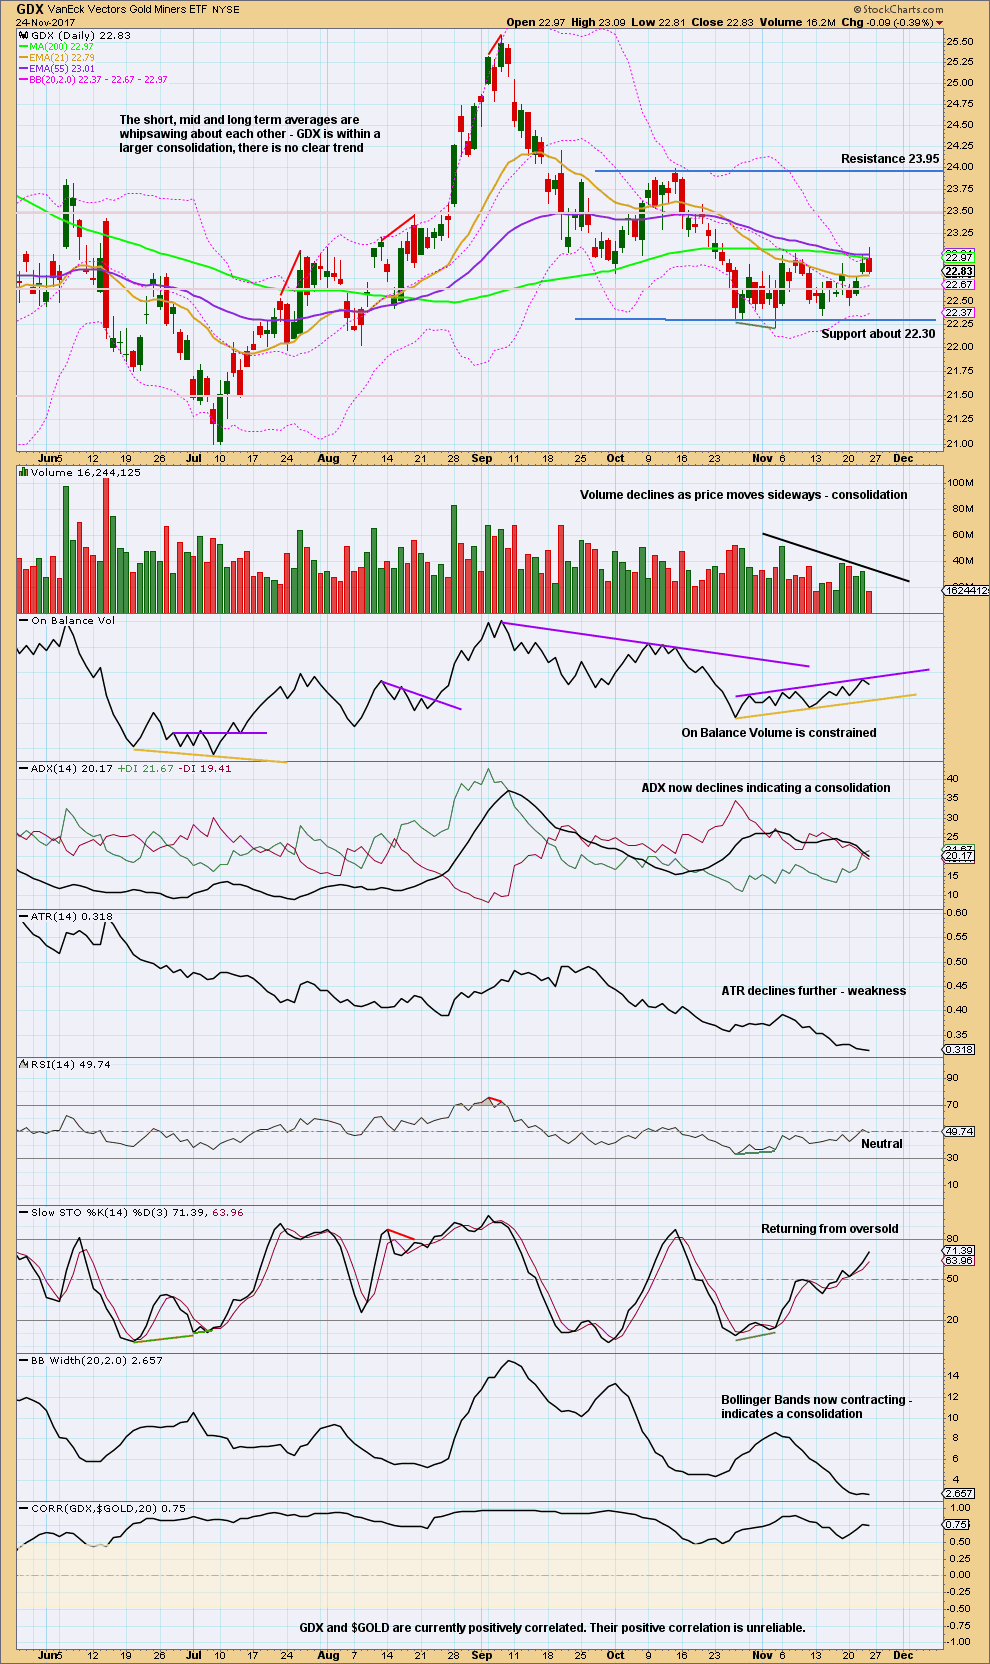
An upwards swing may be expected to continue to resistance about 23.95.
Price does not move in straight lines within consolidations, making them poor trading opportunities. If trading this upwards swing, then reduce risk to only 1-3% of equity to acknowledge higher risk.
The bullish signal from On Balance Volume noted in last analysis was negated. The resistance line is redrawn.
Published @ 02:55 p.m. EST on 25th November, 2017.
IMO Bullish momentum and ROC suggest another leg up for Gold price to break above 1298 for 1305-1313 range and possible topping. There is no reason yet for Gold price to break below 1292-91. Gold price has systematically ploughed upwards through the major moving averages which appear to now be providing solid support….
Hi Lara,
Yes one move up I think which looks compatible with GBP/USD and EUR/USD which I believe are also in the last throws of their corrections.
With the invalidation at the hourly chart level I’m going back to the daily chart level to see what could be happening here within this messy chop.
Minor C (this is for the second wave count, the preferred one) may be continuing as a double zigzag. Which means minor B may have been a single zigzag. That will work with an ending diagonal in it for minute c.
Now down to the hourly chart level, the question becomes is this upwards movement over yet?
Looking further at the 5 minute chart level I can’t yet see a complete structure for minuette wave (c) to end minute wave y to end minor wave C. So one slight new high may be required for submineutte v.
If it moves only very slightly above the end of submineutte wave iii to avoid a truncation then minuette wave (c) would exhibit a 0.618 Fibonacci ratio to minuette wave (a).
The bottom line still remains: Gold is tightly range bound. The structure is some kind of B wave most likely. The breakout when it is done is still expected to be down. It may continue sideways all week again.
Hi Lara,
how do you know the C wave leg is over it may top around the 1310 or even 1320 level before the D leg comes down, the C does not have to be confined to within the triangle.
Rules for contracting and barrier triangles: C may not move beyond the end of A.
A is at 1,305.72.
If C ended at 1,310 or 1,320 as you suggest, that would invalidate the triangle.
Take a look at the video on triangles on the education page. It tries to outline visually the different triangles and the EW rules for them.
Note, I’m not considering an expanding triangle here. That would see C move above A. I’m not considering it because expanding triangles are one of the rarest EW structures. I think I’ve only ever seen one before.
Looks like everything breaking down against the dollar!?
GDX hourly also expects downward movement Mon / Tues to a deep Minute 2 retrace target for the Minute 1 leading expanding diagonal. Likely targets are between 22.63 (.618 retrace) and 22.51 (.786 retrace).
https://www.tradingview.com/x/lE9XEVmt/
Awesome. Thank you Dreamer!
One question: why have you labelled minute c within minor B within primary B as an a-b-c structure? You have trend lines indicating an ending expanding diagonal, but it’s not 1-2-3-4-5.
I know Motive Wave will do that, but it’s wrong. They shouldn’t be doing that.
Nice catch. Looks like I got a little sloppy. I think this zoomed in look will fix the issue. Thanks,
https://www.tradingview.com/x/ZbZed4oH/
Lara, I like what you did with the first count since a leading diagonal wouldn’t fit with your Barchart data. It’s interesting how Trading View and Barchart often produce different patterns, yet the same end result is possible.
With all counts now expecting some down, then up in the coming week or two, it’s going to be a little while longer before we see a clear picture.
https://www.tradingview.com/x/n47JWvQ2/
Lara, Looking at longer term OBV, there appears to be bullish divergences forming.
From Stockcharts Chartschool:
“Divergences
Bullish and bearish divergence signals can be used to anticipate a trend reversal. These signals are truly based on the theory that volume precedes prices. A bullish divergence forms when OBV moves higher or forms a higher low even as prices move lower or forge a lower low. A bearish divergence forms when OBV moves lower or forms a lower low even as prices move higher or forge a higher high. The divergence between OBV and price should alert chartists that a price reversal could be in the making.”
Might this be a strong signal that your First count is correct?
And this view looks like an OBV bullish breakout
Dreamer,
All interesting, strong and valid points .
The divergences are pretty clear. Your point regarding increasing volume also deserves much reflection.
As well, RSI has been closer to the bullish range of 60 plus.
Time will tell – soon, at that!
It’s a signal, yes. But I would not give it too much weight. I’ve learned that OBV doesn’t work so well with divergence.
It works better with trend lines.
In taking a look at a longer term picture on the daily chart for Gold to see your trend line, I come up with this.
For your purple line I think it needs to be redrawn. The prior breach and quick return below the line indicates the line needs adjusting. When you do that I think you may find that OBV has just again turned down from resistance at that line.
I come up with a rising wedge kind of trend lines for OBV long term. We would want a breakout here for a signal.
I notice the steady increase in volume, yes. Which is interesting even as ATR declines.
Within more recent movement (since the low in December 2016) it is an upwards day which has strongest volume. That suggests an upwards breakout.
But looking at the entire sideways chop since December 2015 it is a downwards day which has strongest volume. Suggesting a downwards breakout.
So, which chunk of price to take as the consolidation? Probably, TBH, the sideways mess since February 2017. That’s pretty much when Gold began to swing and move sideways, with so far an upwards bias. Which means the the upwards day of the 5th of September is indicating an upwards breakout.
As for divergence, I think that yes, StockCharts Chart School is right and Baby Pips divergence cheat sheet is wrong. I think that like the AD line, OBV should be read as a leading indicator. And so yes, that would be bullish.
But again, I’ve found it to be not so reliable. But maybe that’s because I’ve been interpreting it wrongly. I’ve been following the conventional method as outlined here.
Thinking this through further, I’m going to change how I read divergence with OBV. I’m going to read it as a leading indicator, just like Lowrys have taught me to read the AD line as a leading indicator (for the S&P that is. Gold doesn’t have an AD line).
Thanks for sharing Baby Pips. Looks like another good reference site 🙂
Thanks for taking the time to look deeper. There’s often more than one way to look at it. We likely need to wait for a clearer breakout.
One thing I think this exercise shows is that there is a benefit to looking at OBV on a longer timeframe as sometimes the daily and shorter term weekly looks don’t give us the bigger picture signals.
Thanks again!