
Price was expected to move higher, but sideways movement suggests a triangle is forming for the short term.
Two Elliott wave triangle counts are considered, and the classic symmetrical triangle is examined in this analysis.
Summary: A triangle may be either complete or complete very soon. Watch for the breakout; it may come within a few days. Some trading guidance for triangles is given from Dhalquist and Kirkpatrick in the classic technical analysis section.
New updates to this analysis are in bold.
Last monthly chart is here.
ELLIOTT WAVE COUNTS
FIRST WAVE COUNT
WEEKLY CHART
Click chart to enlarge.
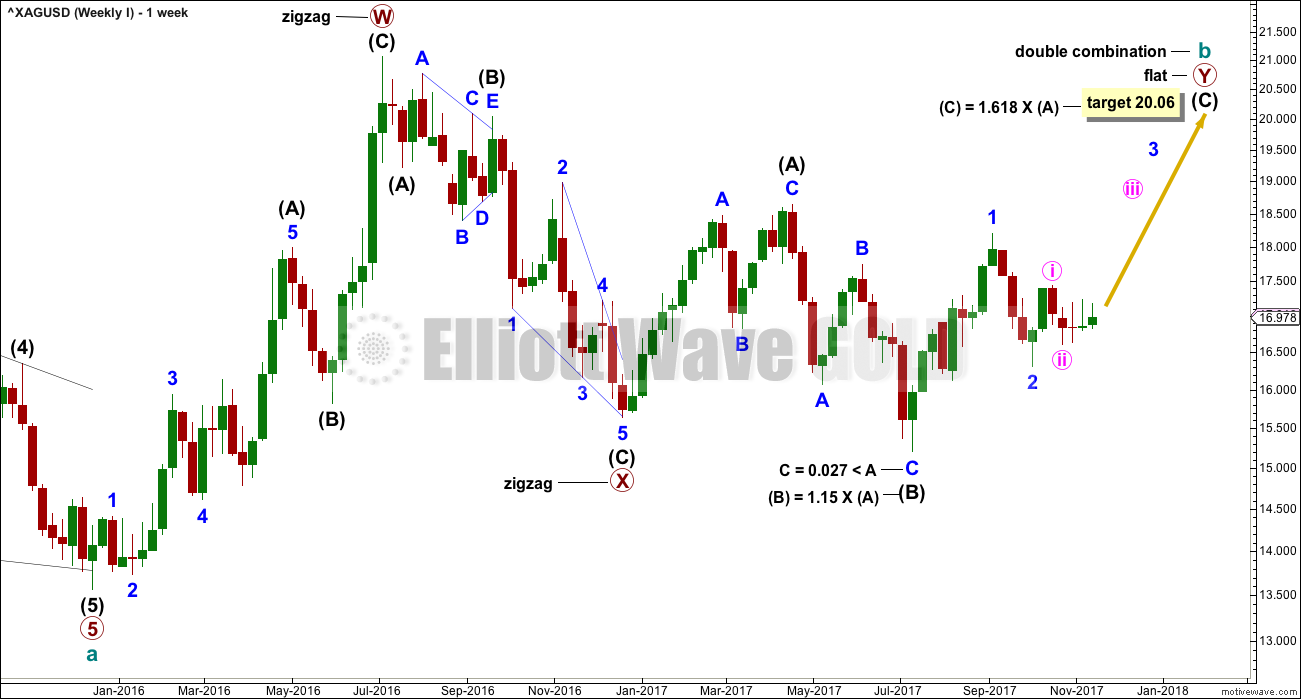
Cycle wave b may be completing as a double combination: zigzag – X – flat. The second structure, a flat correction for primary wave Y, may be underway.
Within a flat correction, intermediate wave (B) must retrace a minimum 0.9 length of intermediate wave (A) at 15.938. Intermediate wave (B) has met this minimum requirement; the rule for a flat correction is met. Intermediate wave (B) is longer than 1.05 times the length of intermediate wave (A) indicating this may be an expanded flat. Expanded flat corrections are the most common type. Normally their C waves are 1.618 or 2.618 the length of their A waves.
The target calculated would see primary wave Y to end close to same level as primary wave W about 21.062. The purpose of combinations is to take up time and move price sideways. To achieve this purpose the second structure in the double normally ends about the same level as the first.
While the combination wave count at the weekly chart level does not currently work for Gold, it does still work for Silver. They do not have to complete the same structures for cycle wave b, and fairly often their structures are different.
DAILY CHART
Click chart to enlarge.
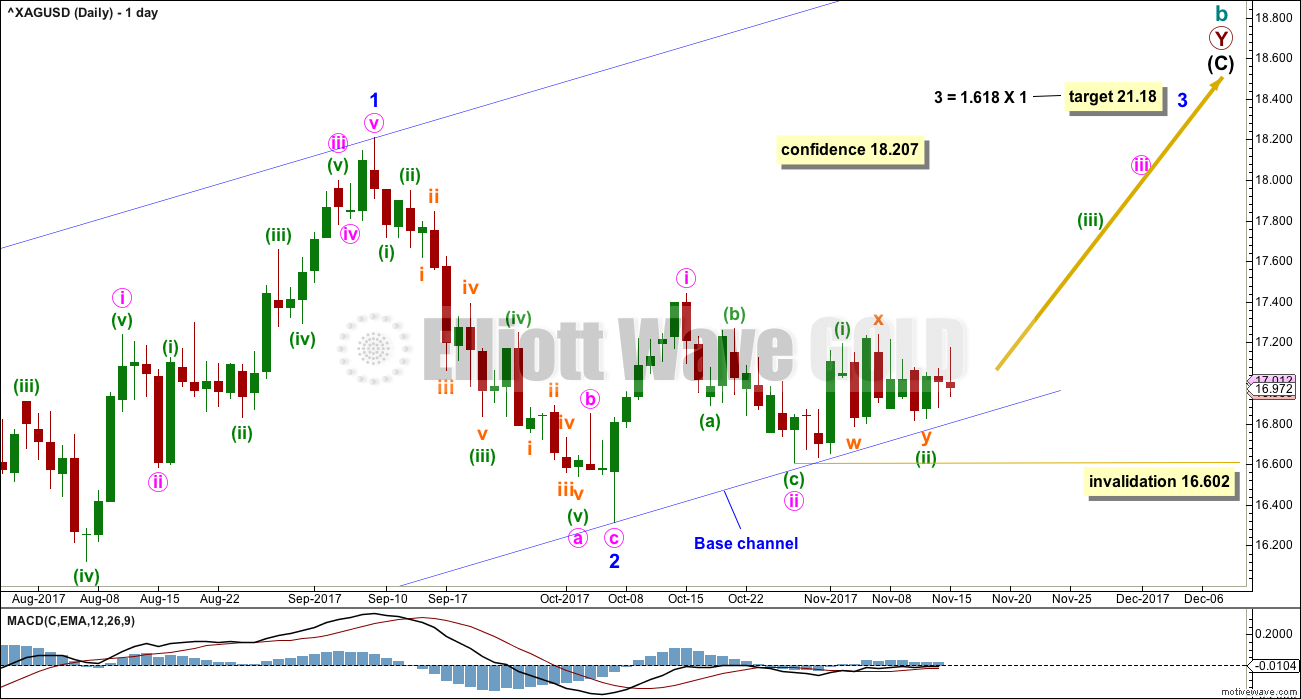
For this first wave count, upwards movement for intermediate wave (C) must subdivide as a five wave structure. It may be unfolding as an impulse.
Within the impulse of intermediate wave (C), only minor wave 1 was over at the last high and now minor wave 2 may now be complete.
Minor wave 2 may have ended very close to the most likely point of the 0.618 Fibonacci ratio of minor wave 1 at 16.347.
Minor wave 1 lasted 44 days. Minor wave 2 may have completed in 20 days, just one short of a Fibonacci 21.
Minor wave 3 may only subdivide as an impulse. It would be very likely to show its subdivisions clearly at the daily chart level. Minute waves ii and iv within it should show up as multi day pullbacks or sideways consolidations. Minute wave ii now shows up at the weekly and daily chart levels.
Within minute wave iii, no second wave correction may move beyond its start below 16.602.
A base channel is added to minor waves 1 and 2. Downwards movement is finding very strong support at the lower edge of this base channel. If price breaks below the base channel, then the probability of this wave count would substantially reduce prior to invalidation.
This wave count now expects to see a strong increase in upwards momentum as a third wave up at three degrees unfolds. The fact that strong upwards movement has failed so far to materialise must reduce the probability now of this wave count.
SECOND WAVE COUNT
WEEKLY CHART
Click chart to enlarge.
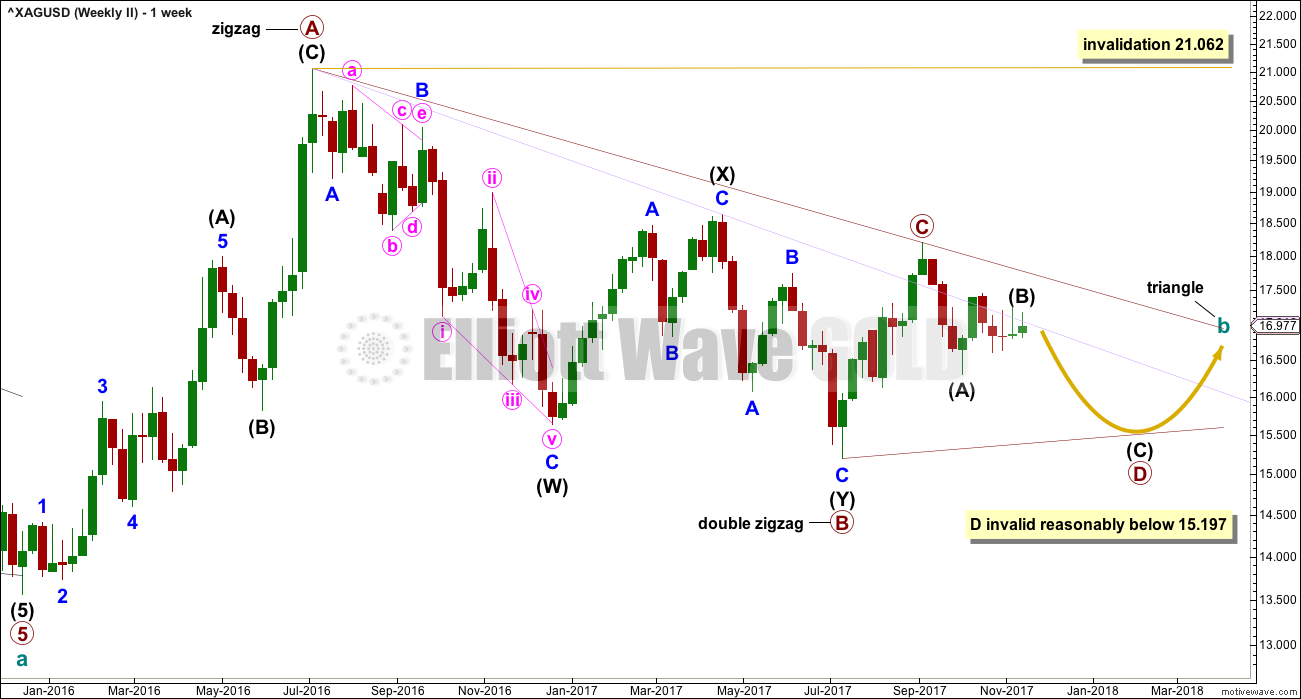
It remains possible for Silver that a large regular contracting or regular barrier triangle may be completing.
Within a triangle, one of the sub-waves must be a more complicated multiple, usually a multiple zigzag. This may be complete for primary wave B.
Primary wave C upwards may now be complete. The upper A-C trend line does have a fairly steep slope though, so it must be accepted that primary wave C may not be over and may continue higher. If it does, it may not move beyond the end of primary wave A above 21.062.
Primary wave C must subdivide as a three wave zigzag.
This triangle wave count now expects that primary wave D downwards may now be underway. Two scenarios for how it subdivides are presented below at the daily chart level.
Primary wave D of a contracting triangle may not move beyond the end of primary wave B below 15.197.
Primary wave D of a barrier triangle may end about the same level as primary wave B at 15.197; as long as the B-D trend line is essentially flat, the triangle will remain valid. Unfortunately, there is some subjectivity in this rule; it is not black and white.
DAILY CHART
Click chart to enlarge.
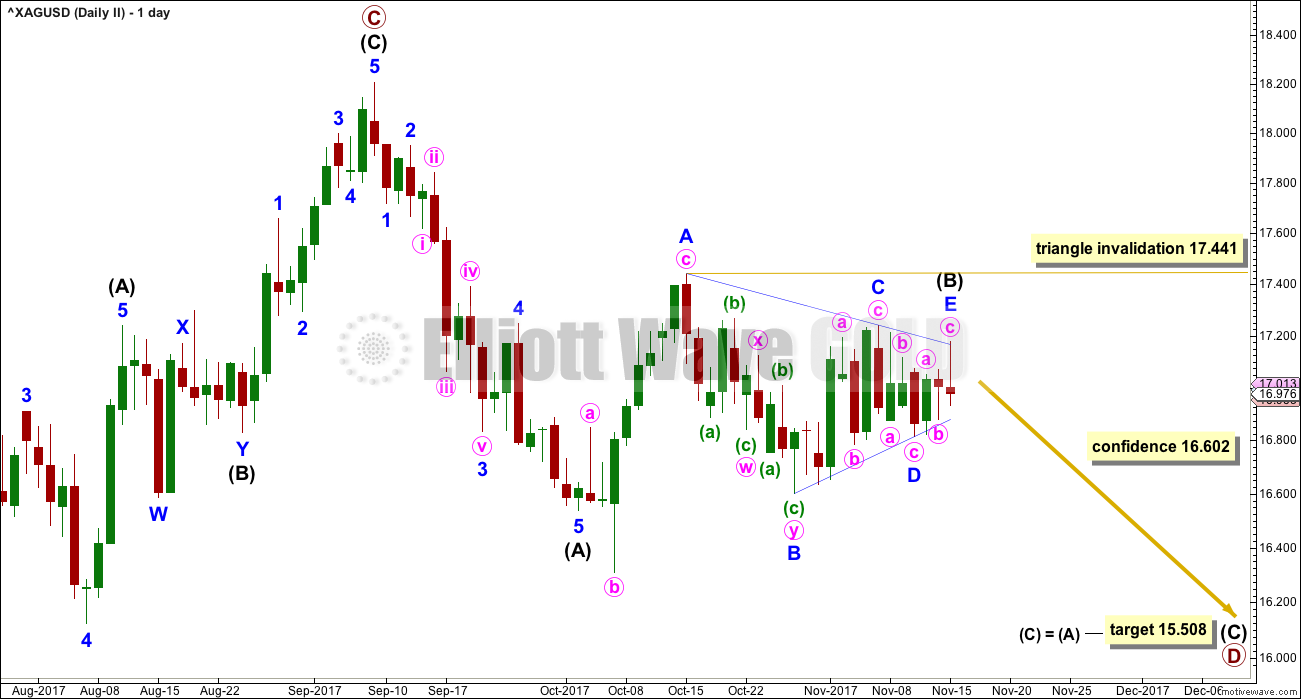
Primary wave D must subdivide as a zigzag. Within the zigzag, intermediate wave (B) may be any corrective structure. At this stage, it may be a complete regular contracting triangle.
Minor wave E slightly overshoots the A-C trend line. Sometimes triangles end with a small overshoot.
If price begins to move strongly lower and makes a new low below 16.602, then confidence may be had in this wave count.
The target for primary wave D expects to see the most common Fibonacci ratio between intermediate waves (A) and (C).
ALTERNATE DAILY CHART
Click chart to enlarge.
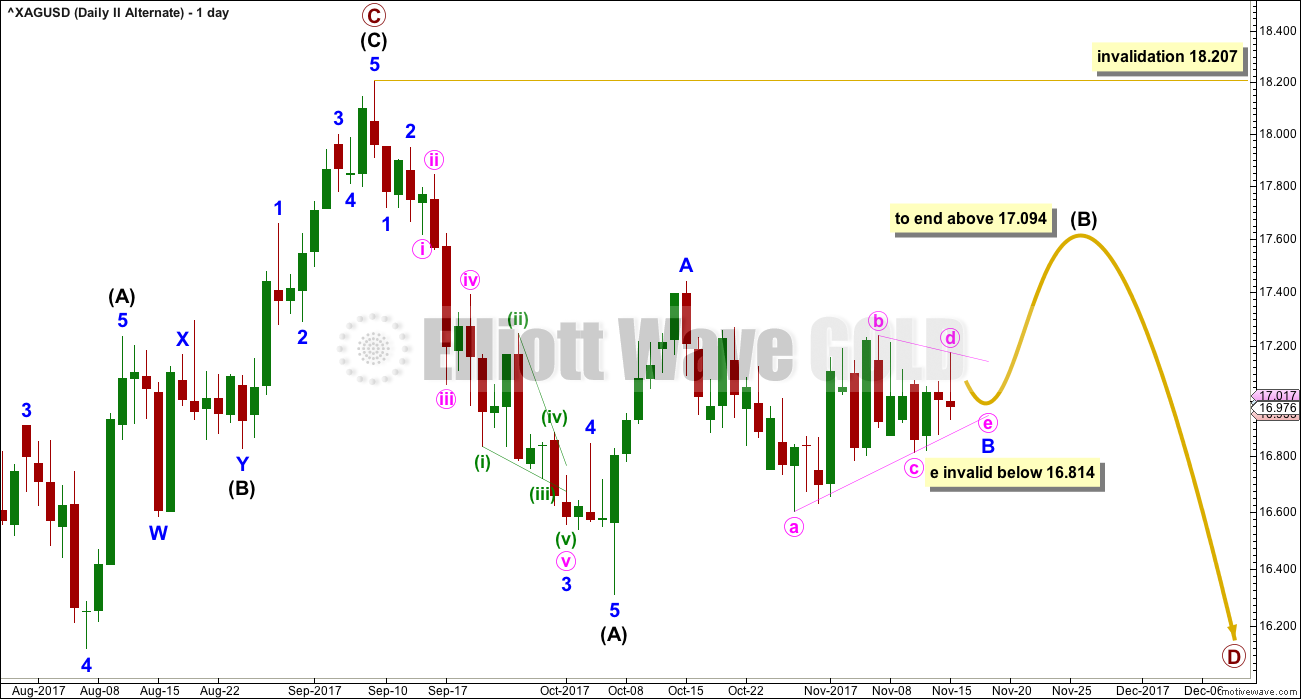
When an Elliott wave triangle is considered, it is vital to always consider alternate ways to label the triangle.
The triangle may be minor wave B within intermediate wave (B). The breakout may be upwards.
Within the triangle, minute wave e may not move beyond the end of minute wave c. A new low below 16.814 would invalidate this triangle idea and add some confidence to the main wave count above.
Within the zigzag of intermediate wave (B), minor wave C would be very likely to make at least a slight new high above the end of minor wave A at 17.094 to avoid a truncation.
TECHNICAL ANALYSIS
WEEKLY CHART
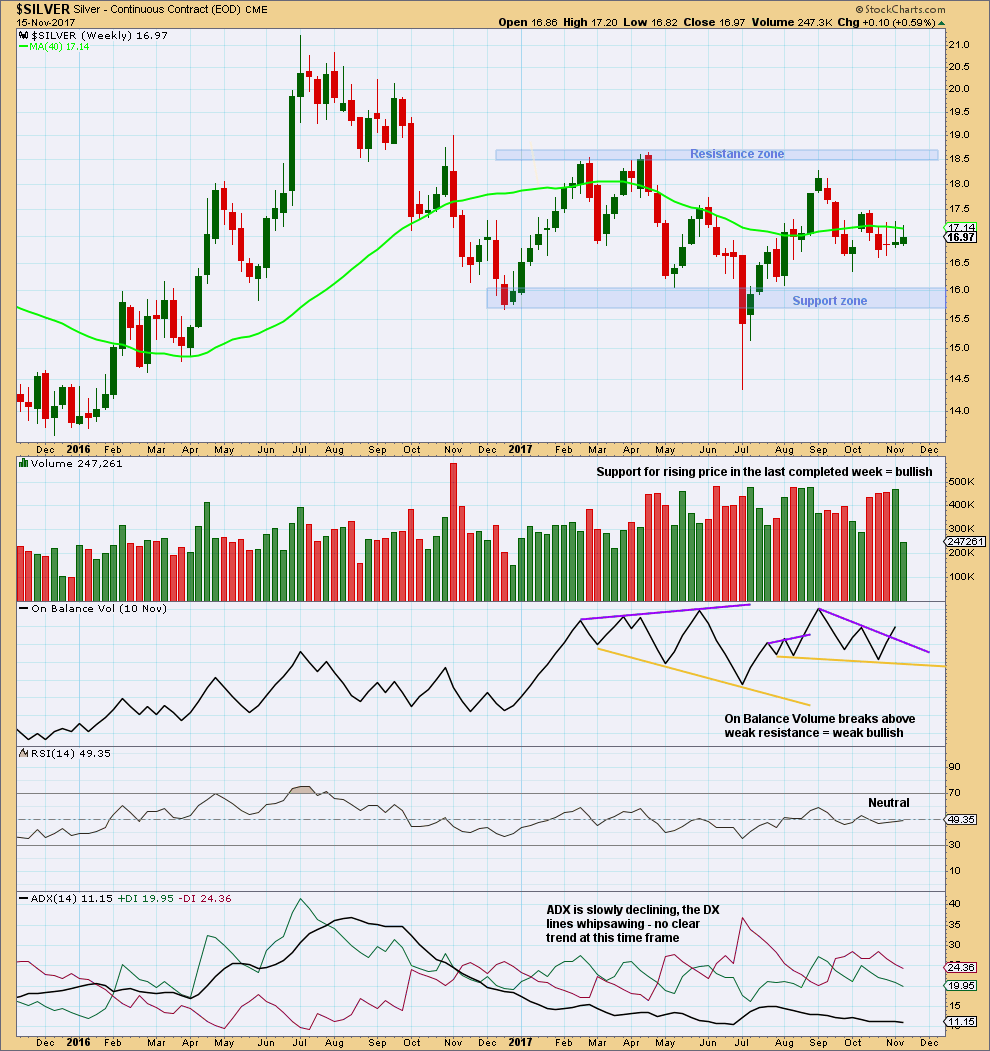
Click chart to enlarge. Chart courtesy of StockCharts.com.
The strongest week during this large consolidation is a downwards week ending 12th of June. However, this is stronger by only a small margin. The next strongest week is an upwards week. It may be better to look at daily volume bars to determine the most likely direction of a breakout from this consolidation.
The last two completed weeks moved price higher with an increase in volume. This is bullish.
Another weak bullish signal comes this week from On Balance Volume.
This chart supports the first and second alternate Elliott wave counts.
DAILY CHART
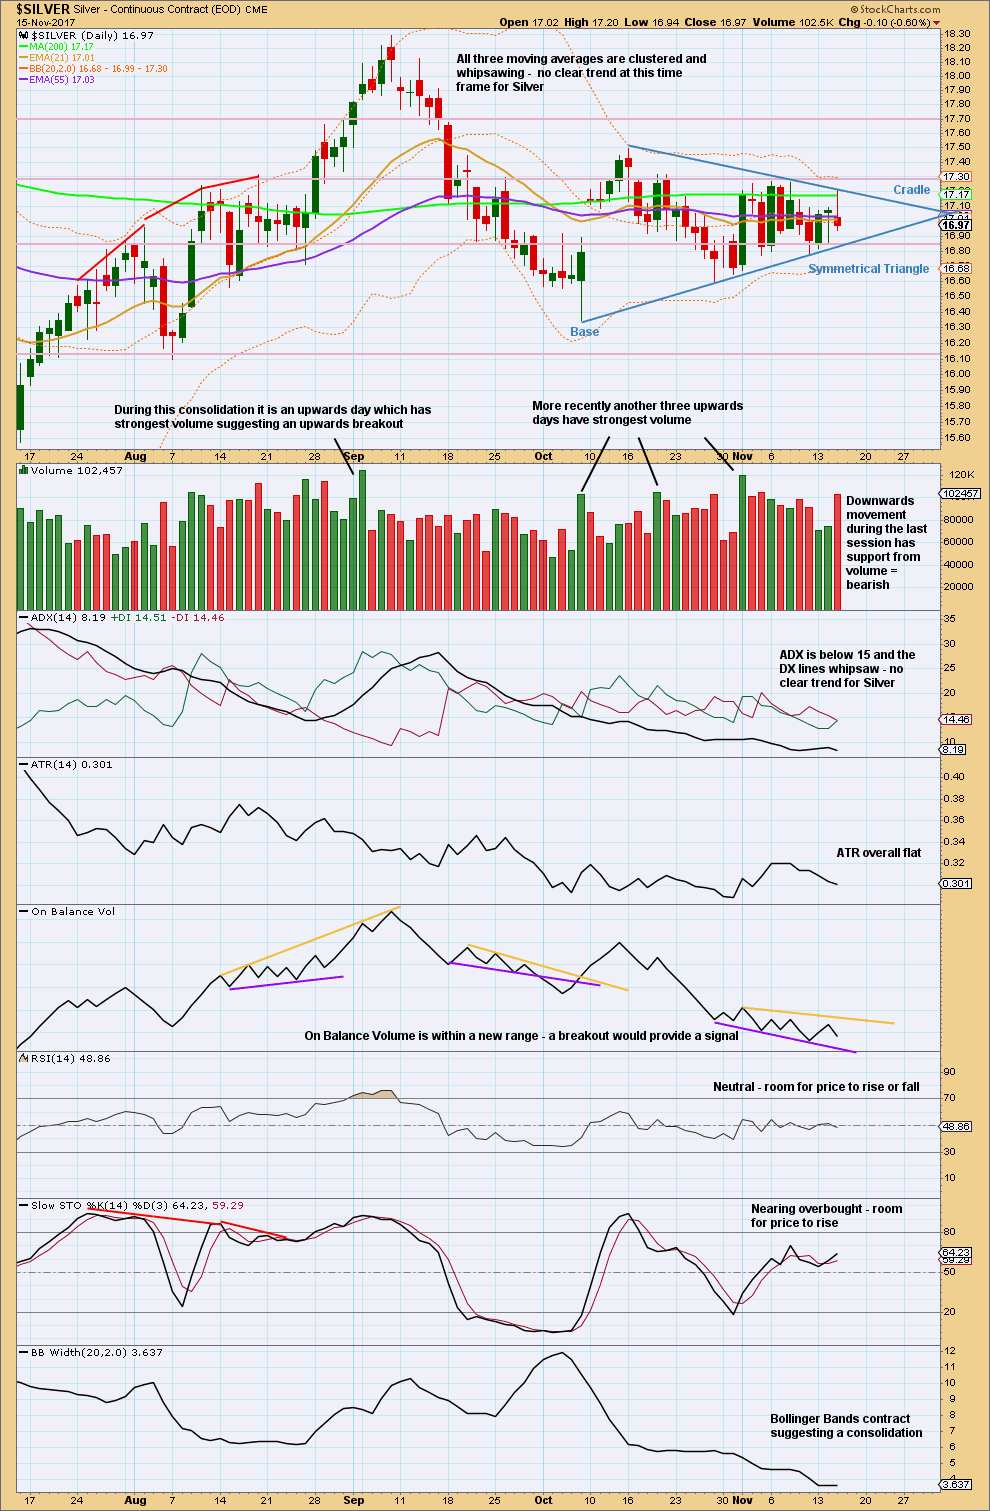
Click chart to enlarge. Chart courtesy of StockCharts.com.
Volume suggests an upwards breakout from the symmetrical triangle.
The last day though is very bearish. The long upper wick is bearish as is volume.
From Dhalquist and Kirkpatrick regarding symmetrical triangles:
“The breakout is usually upwards (54% of the time). Symmetrical triangles have many false breakouts and must be watched carefully. The breakout commonly occurs between 73% and 75% of the length of the triangle from base to cradle. Throwbacks and pullbacks occur 37% and 59% of the time respectively, and, as in most patterns, when they occur, they detract from eventual performance. This implies that for actual investment or trading, the initial breakout should be acted upon, and if a pullback or throwback occurs, the protective stop should the tightened.”
And regarding trading triangles:
“The ideal situation for trading triangles is a definite breakout, a high trading range within the triangle, an upward-sloping volume trend during the formation of the triangle, and especially a gap on the breakout.
Although triangles are plentiful, their patterns suffer from many false and premature breakouts. This requires that a very strict breakout rule be used, either a wide filter or a number of closes outside the breakout zone. It also requires a close protective stop at the breakout level in case the breakout is false. Once these defensive levels have been exceeded, and price is on its way, the trader can relax for a little while because the failure rate after a legitimate breakout is relatively low Trailing stops should then be placed at each preceding minor reversal.”
For the example in the chart above, a breakout is required either above (54% likely) or below the trend lines. It should come soon now as price is close to about 75% the length of the triangle. It will be there in about two more days.
A gap on the breakout would increase performance. Volume supporting movement would also provide confidence. Stops may be set just above or below the triangle trend lines; below if an upwards breakout or above if a downwards breakout occurs. A position should be entered on the breakout, but do not wait for a throwback or pullback as it may not come.
Published @ 01:11 a.m. EST.
[Note: Analysis is public today for promotional purposes. Specific trading advice and comments will remain private for members only.]