
Last analysis expected upwards movement, which is exactly what has happened over the last week. The Elliott wave target remains the same.
Summary: As long as price remains above 54.84, then expect this consolidation may be over here or very soon. The target for upwards movement to end is a zone at 61.42 to 62.11.
New updates to this analysis are in bold.
MONTHLY ELLIOTT WAVE COUNT
Click chart to enlarge.
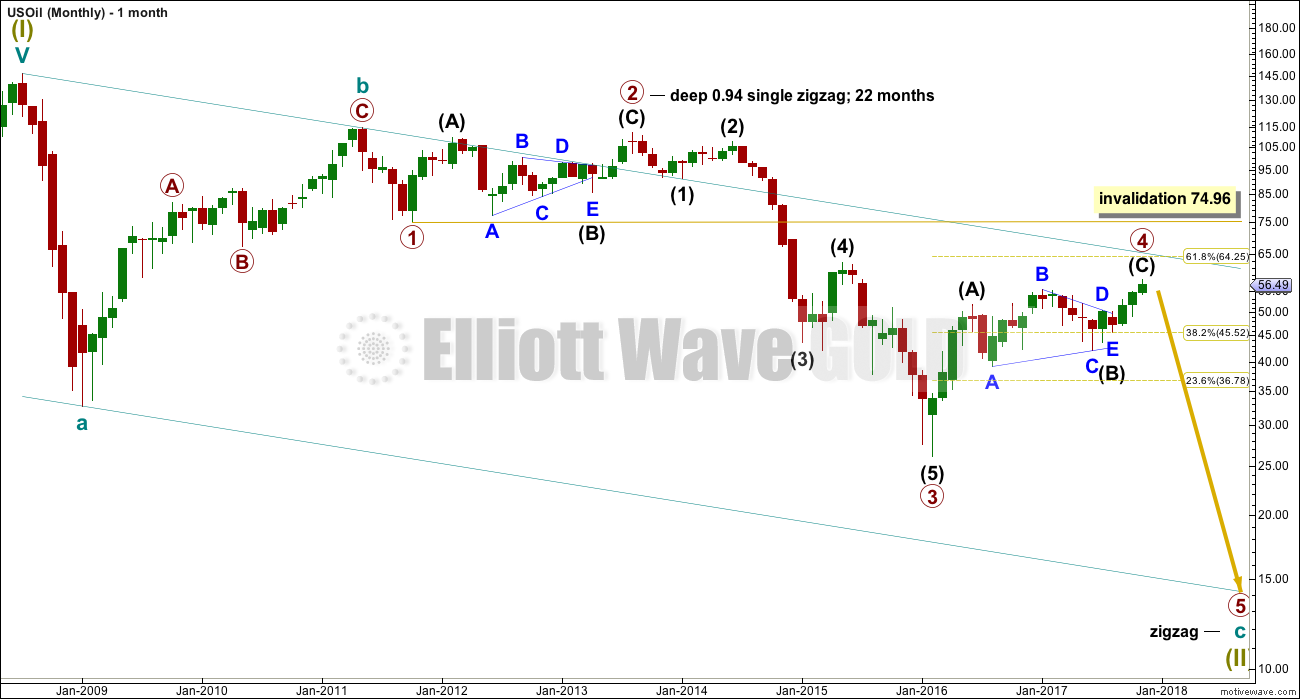
Within the bear market, cycle wave b is seen as ending in May 2011. Thereafter, a five wave structure downwards for cycle wave c begins.
Primary wave 1 is a short impulse lasting five months. Primary wave 2 is a very deep 0.94 zigzag lasting 22 months. Primary wave 3 is a complete impulse with no Fibonacci ratio to primary wave 1. It lasted 30 months.
There is alternation in depth with primary wave 2 very deep and primary wave 4 relatively shallow. There is inadequate alternation in structure, both are zigzags. So far primary wave 4 has lasted 21 months. So far there is good proportion between primary waves 2 and 4.
Primary wave 4 may not move into primary wave 1 price territory above 74.96.
WEEKLY ELLIOTT WAVE COUNT
Click chart to enlarge.
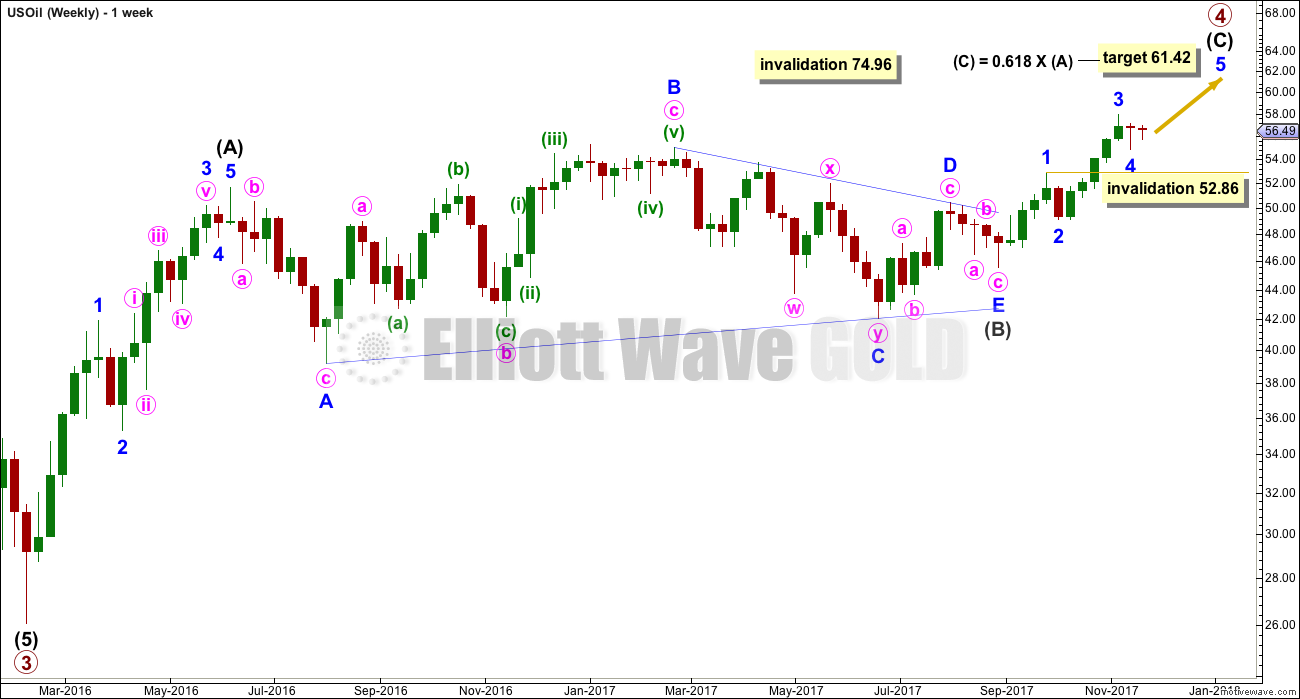
Intermediate wave (C) must subdivide as a five wave structure, either an impulse or an ending diagonal. Within intermediate wave (C), minor waves 1, 2 and now 3 may be complete. Minor wave 4 may not move into minor wave 1 price territory below 52.86.
Minor wave 4 now lasts long enough to show up at the weekly chart level, giving this part of the wave count the right look.
When intermediate wave (C) may again be seen as complete, then a trend change would be expected and a target for primary wave 5 downwards would be calculated. At this stage, for this wave count, a target cannot be calculated for it to end because the start of primary wave 5 is not known.
DAILY ELLIOTT WAVE COUNT
Click chart to enlarge.
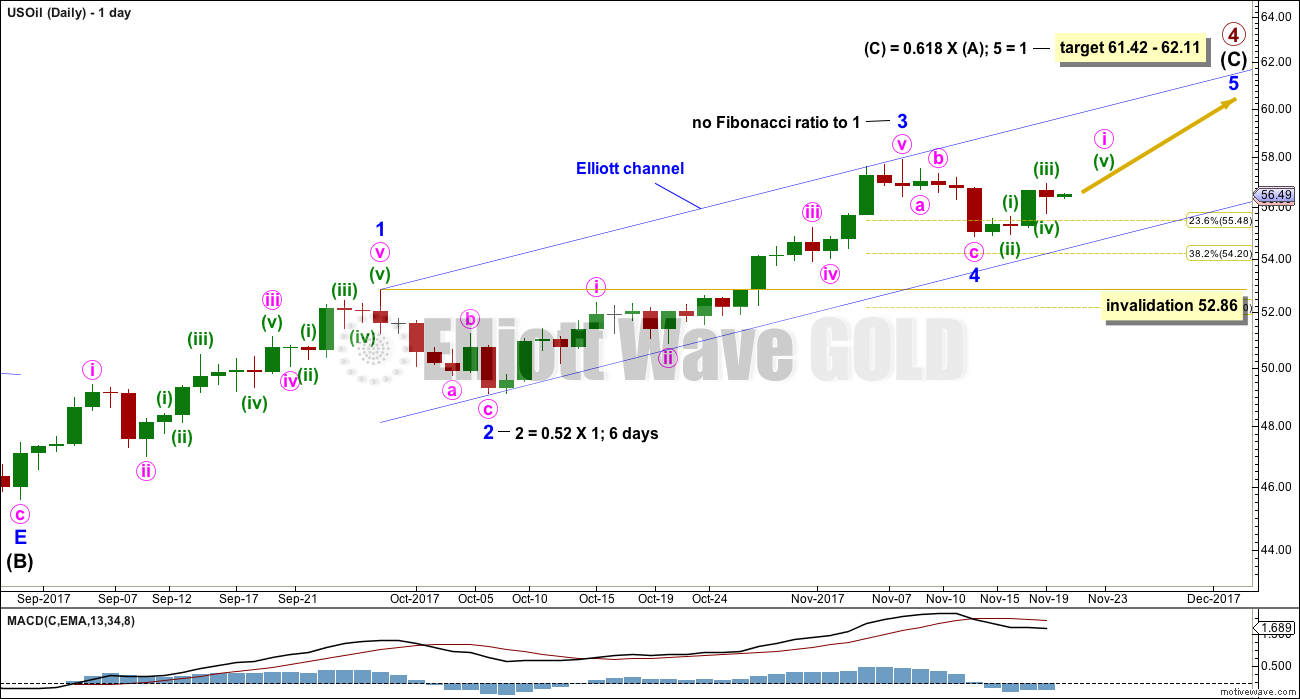
Intermediate wave (C) must complete as a five wave structure. For this wave count, it looks like a possible impulse.
Minor wave 3 is longer than minor wave 1, but it does not exhibit a Fibonacci ratio to minor wave 1. This makes it more likely that minor wave 5 may exhibit a Fibonacci ratio to either of minor waves 3 or 1, and a ratio to minor wave 1 would be more common.
It is possible that minor wave 4 is over as labeled.
Both minor waves 2 and 4 are zigzags, so there is inadequate alternation here. There is alternation within the structures though: minor wave 2 has a long minute wave a and a short minute wave c, whereas minor wave 4 has a short minute wave a and a long minute wave c. At this stage, there is alternation in depth: minor wave 2 is deep and minor wave 4 is shallow.
It is also possible that minor wave 4 may continue sideways as a triangle. If it does continue sideways, then look for strong support at the lower edge of the blue Elliott channel. If minor wave 4 does continue sideways, then it would exhibit better alternation with minor wave 2.
TECHNICAL ANALYSIS
DAILY CHART
Click chart to enlarge. Chart courtesy of StockCharts.com.
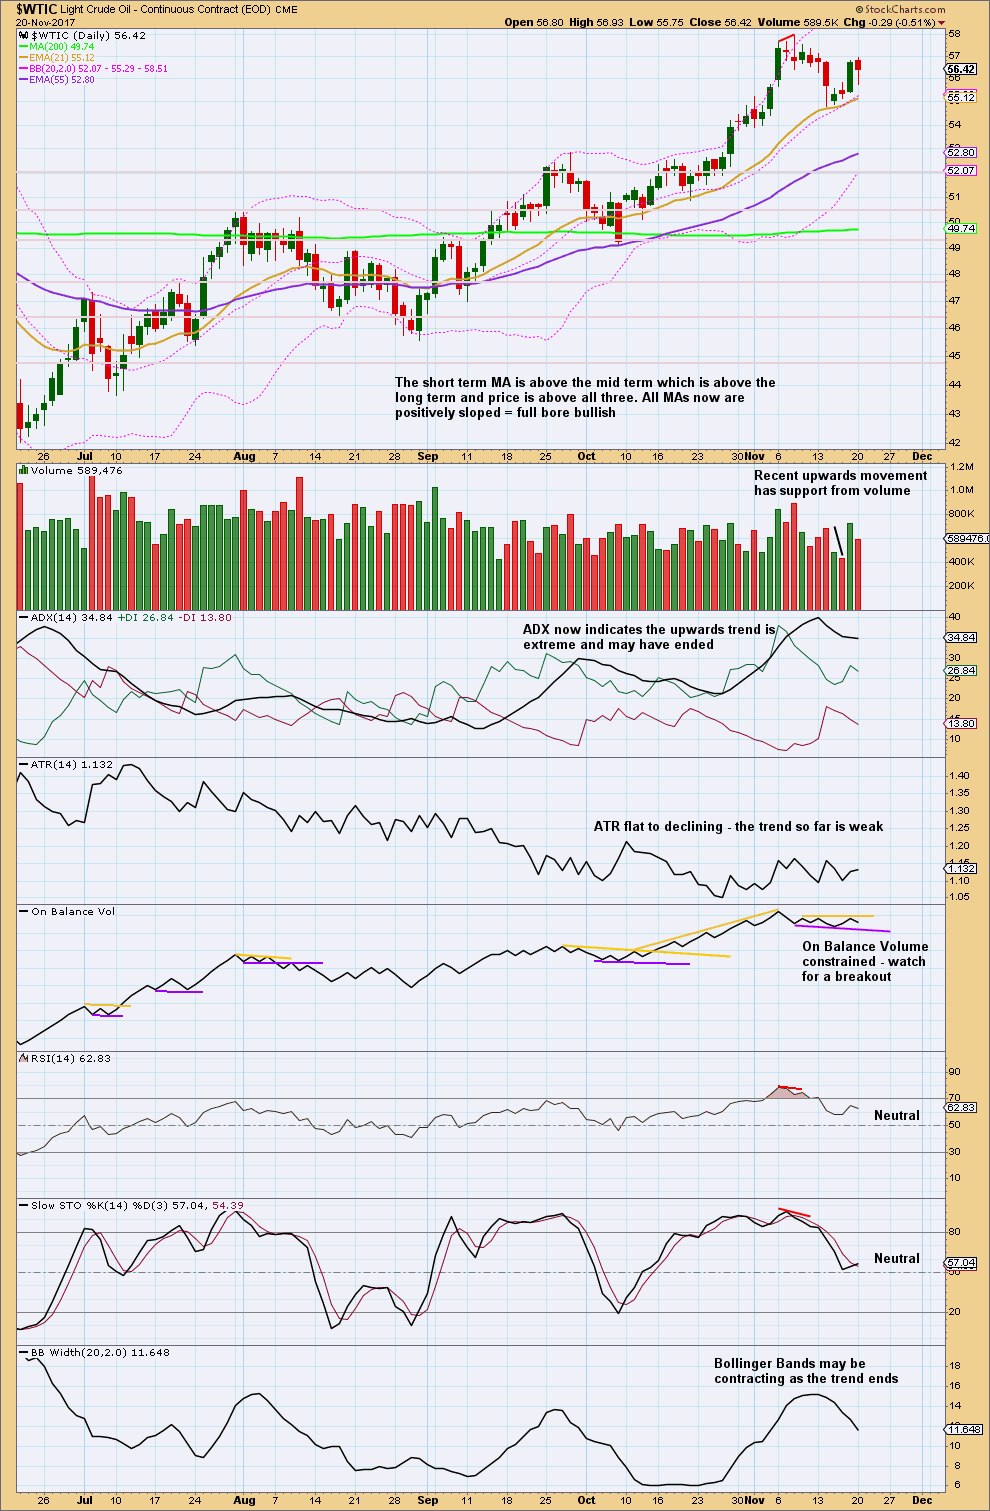
Volume short term is bullish. Price is finding support about the short term Fibonacci 13 day moving average.
Both RSI and Stochastics are returning from overbought. If price makes a new high and RSI and / or Stochastics do not, that would be bearish divergence and would indicate a high likely in place or coming very soon.
It does look like this upwards trend is nearing an end.
VOLATILITY INDEX
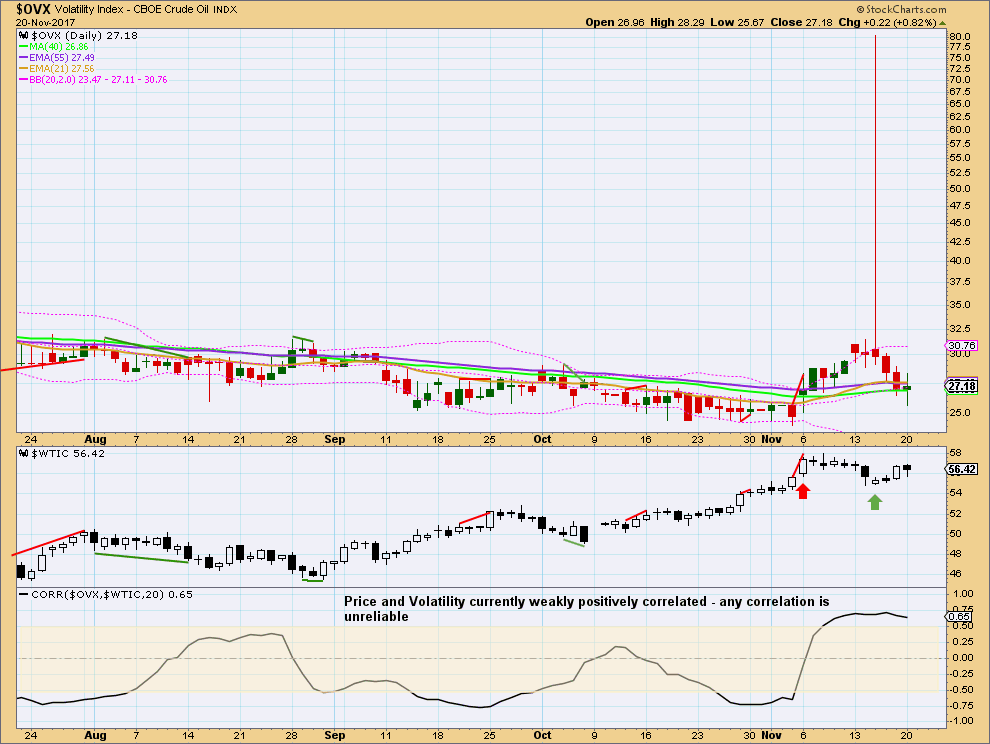
Click chart to enlarge. Chart courtesy of StockCharts.com.
The very strange volatility spike for the 15th of November is interpreted as bullish. Volatility sharply increased on that date, but price did not make new lows. There was weakness within price as it could not follow through.
Published @ 12:12 a.m. EST.