
The USD Index continued to move lower as the last Elliott wave analysis expected. The target for a low at primary degree was 94.83. The low was reached 3.01 below the target.
ELLIOTT WAVE ANALYSIS
MONTHLY CHART
Click chart to enlarge.
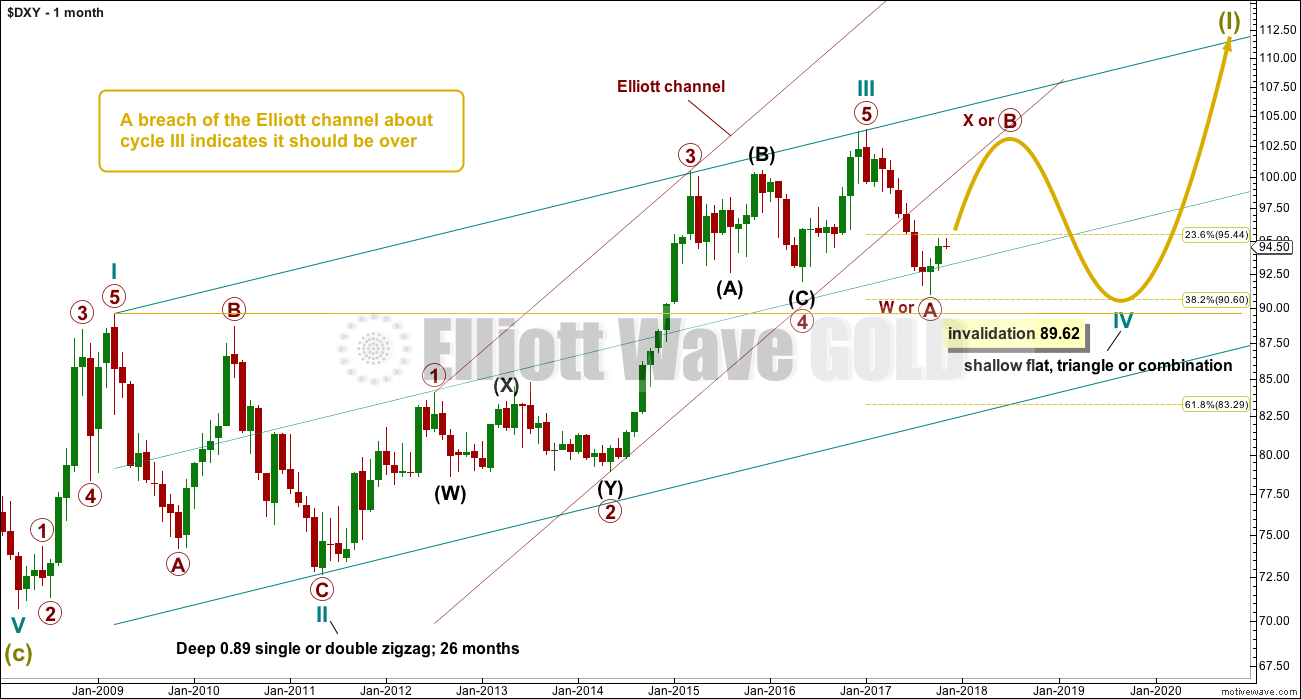
A Super Cycle degree impulse looks to be incomplete for Super Cycle wave (I).
Cycle waves I, II and now III look complete within Super Cycle wave (I) impulse. Cycle wave III is just 0.50 longer than 1.618 the length of cycle wave I.
Ratios within cycle wave III are: there is no Fibonacci ratio between primary waves 3 and 1, and primary wave 5 is just 0.5 shorter than equality in length with primary wave 1. Primary wave 3 is the longest extension and has the strongest slope.
Cycle wave II was a deep 0.89 single or double zigzag lasting 26 months. Given the guideline of alternation, cycle wave IV may be expected to be a more shallow sideways correction which would likely be longer lasting. So far it has lasted just ten months.
WEEKLY CHART
Click chart to enlarge.
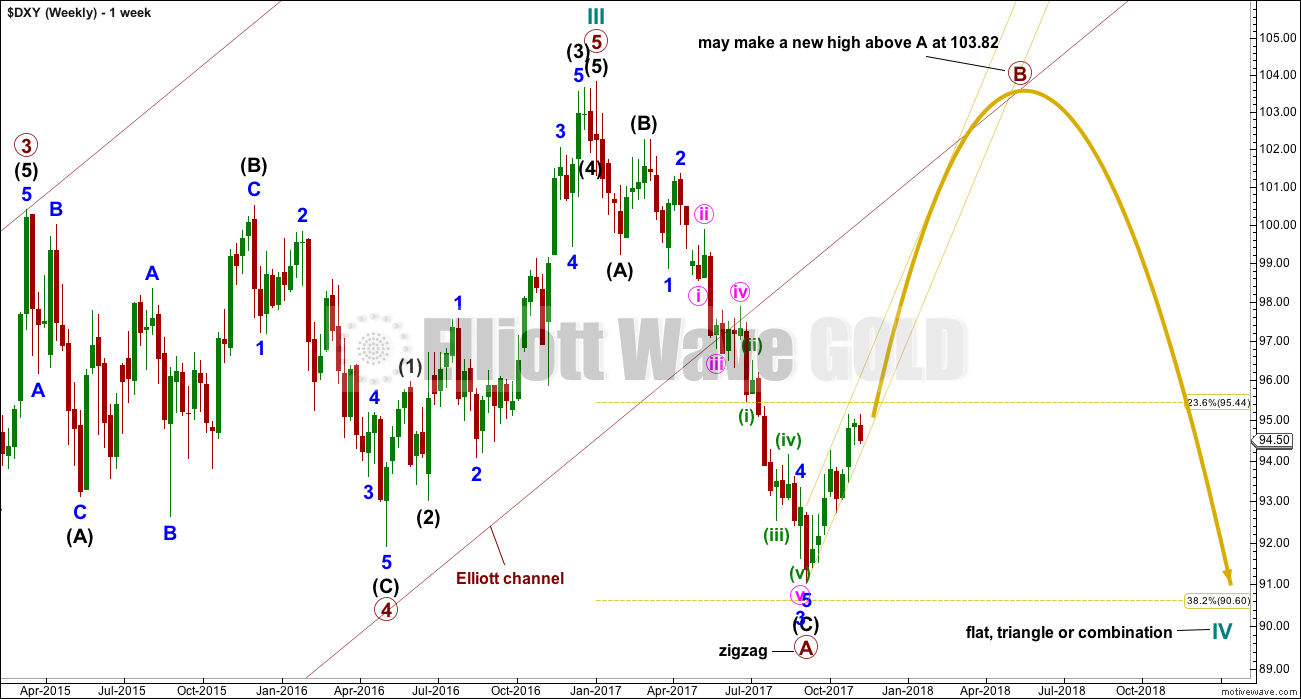
A breach of the maroon Elliott channel provided an indication that cycle wave III was over and cycle wave IV had arrived.
If cycle wave IV is an expanded flat or a running triangle or a combination, then primary wave B or X within it may make a new high above the start of primary wave A or W at 103.82.
Primary wave B or X would most likely be a zigzag, but it may be any corrective structure. It may be a sharp upwards movement or a choppy overlapping time consuming consolidation.
For the short term, while price remains within the narrow yellow channel, assume the trend remains up.
DAILY CHART
Click chart to enlarge.
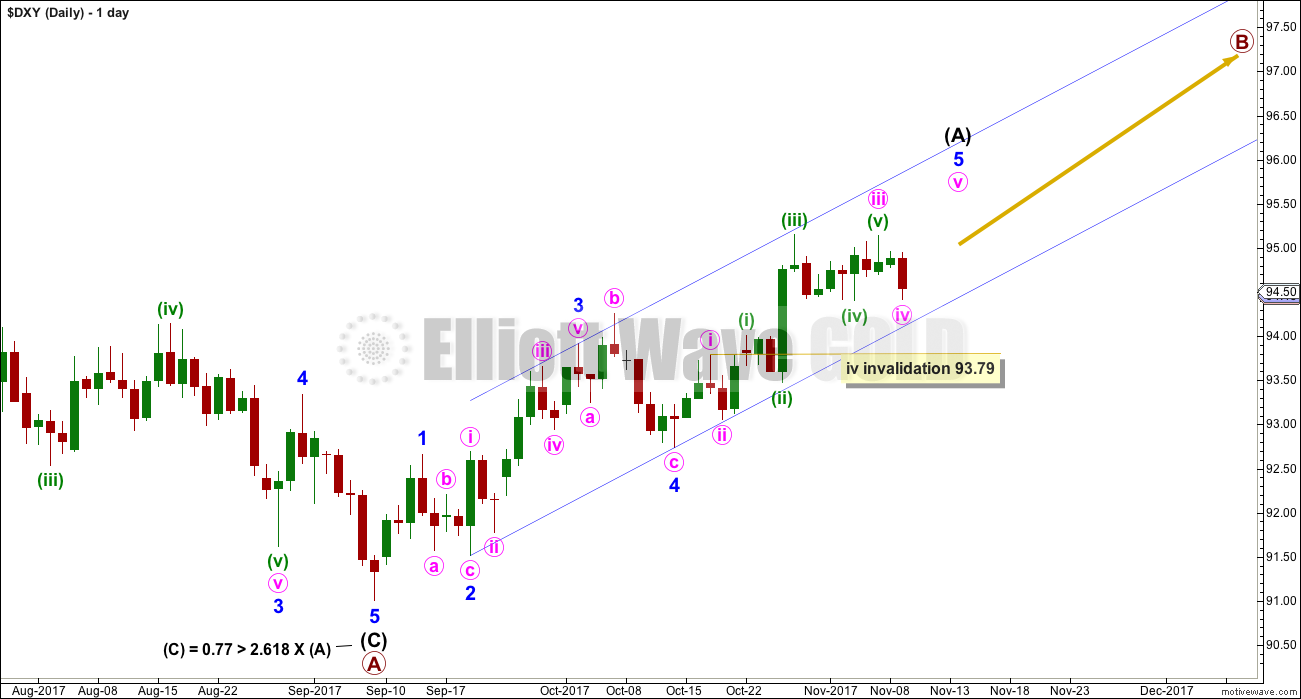
This labelling assumes that primary wave B may be a zigzag. But this labelling may need to change as primary wave B may be any one of more than 23 possible corrective structures.
The blue channel is an Elliott channel about the first five up. This may be intermediate wave (A). Assume the trend remains up while price remains within this channel.
Minute wave iv may not move into minute wave i price territory below 93.79.
TECHNICAL ANALYSIS
MONTHLY CHART
Click chart to enlarge. Chart courtesy of StockCharts.com.
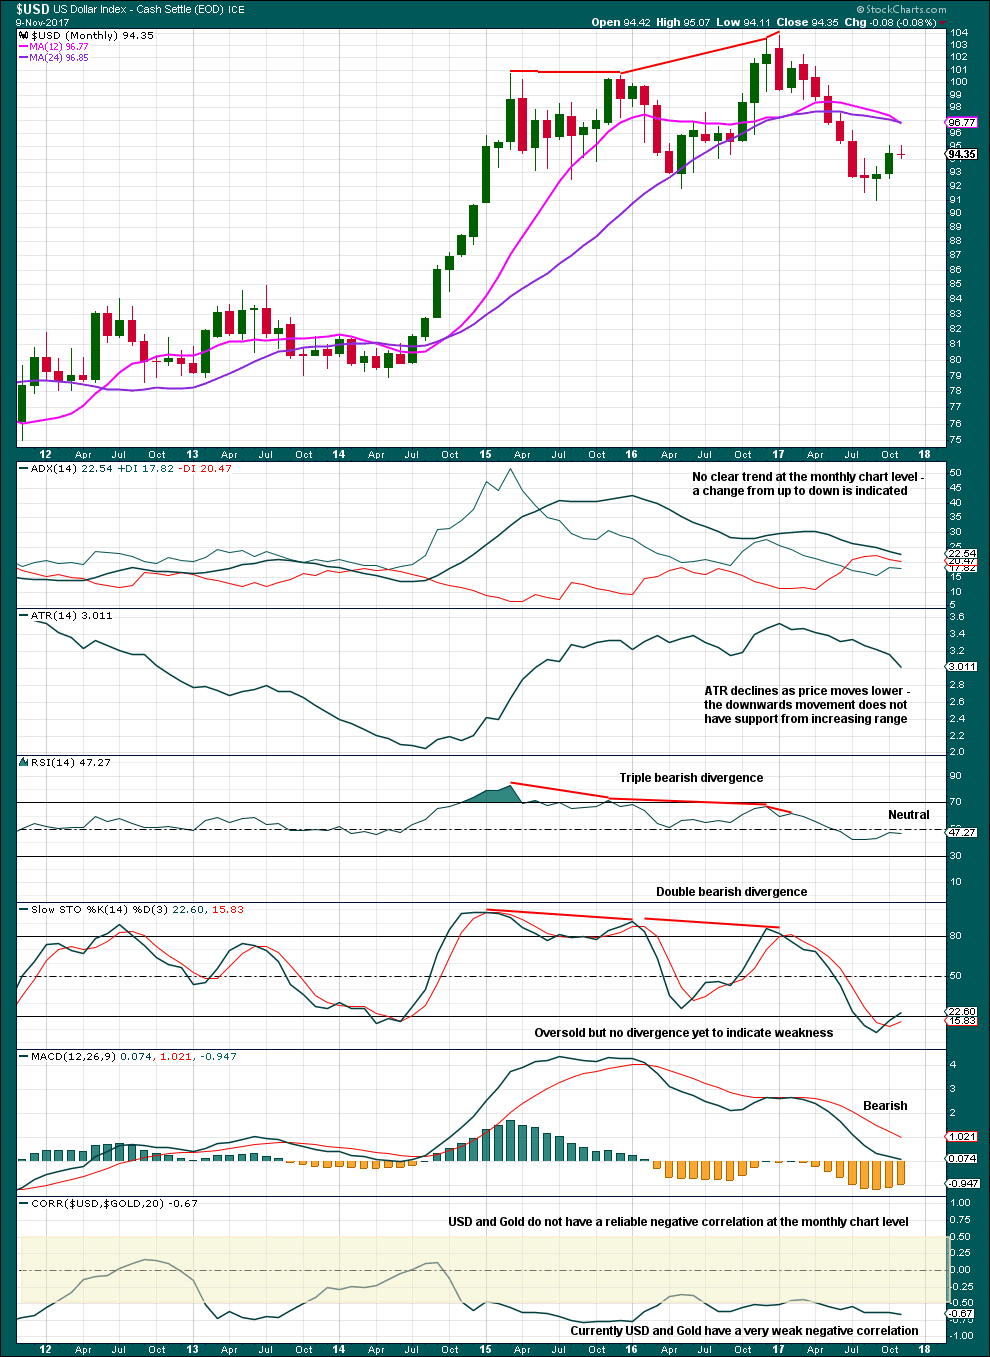
ADX is still declining, so it does not yet indicate a trend.
Both the one and two year moving averages are now negatively sloped and price is below both. The one year average may be now crossing below the two year average. This would be a full bore bearish look.
With RSI not oversold and Stochastics exhibiting no divergence with price at lows, there is room for price to fall further.
It is very important to note that at the monthly chart level Gold and the USD Index do not have a reliable negative correlation. At this high time frame, they can spend months not correlated.
Each market should be and will be analysed separately. We cannot expect that analysis of one market showing movement expected in one direction means our analysis of the other market should show it to move in the opposite direction, because the math proves that is not the case often enough. To make this correlation assumption without looking at the math is dangerous to your trading account.
DAILY CHART
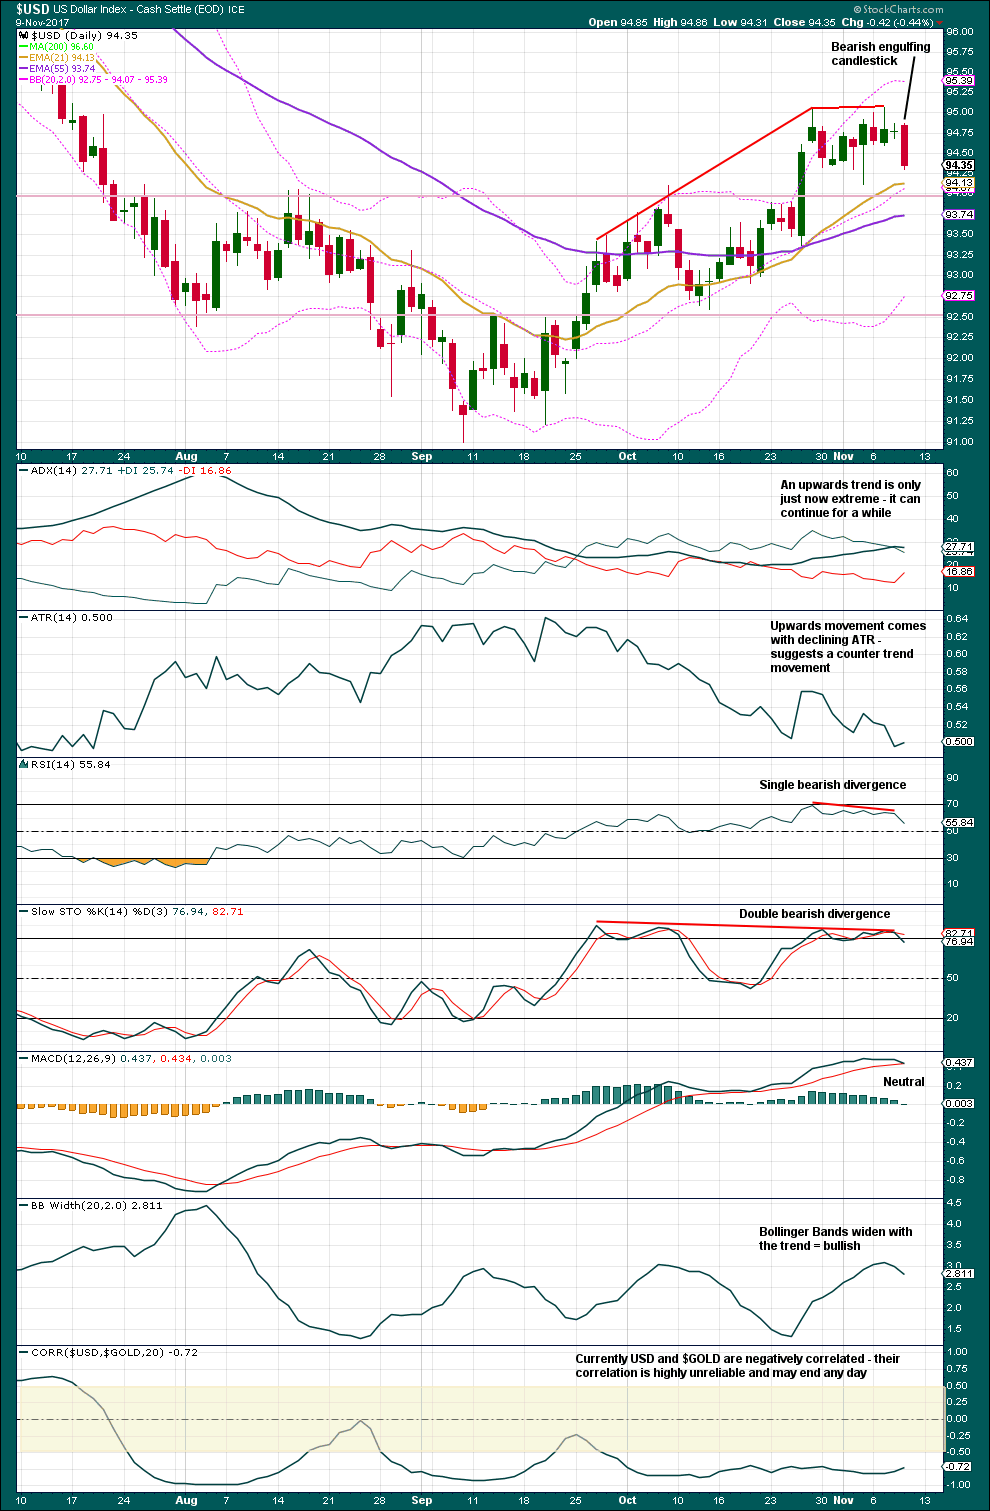
Click chart to enlarge. Chart courtesy of StockCharts.com.
Give the bearish engulfing candlestick pattern weight, because this suggests the Elliott wave count is wrong for the short term and a reasonable pullback or consolidation may develop about here.
The upwards trend here is extreme. Look out for a turn.
This analysis is published @ 03:00 a.m. EST.
Thank you Lara and thank you Dreamer.
Lara, thanks for the update. This seems to fit well with your Triangle count for gold.
Have you considered a bearish count? I’m certainly no economist, but with the US national debt growing one trillion dollars last year to a current total above 20 trillion, I just don’t see how it’s possible that the USD is in a Supercycle degree impulse up. That implies the USD continues up for several decades.
I would think the longer term trend would be sideways and down, no?
“The Fed, the Great Depression and Inflation
When the Federal Reserve was established in 1913, the price level in the U.S. was still lower than it was in 1800. Over the next 100 years, the dollar lost 96% of its value, causing nominal prices to rise nearly 2,000%.”
Above quote from this (no need to read):
https://www.investopedia.com/ask/answers/040715/were-there-any-periods-major-deflation-us-history.asp
My analysis of the US indices expects that the high there is probably 1-3 years away. And so for the USD index cycle IV may end, then a short cycle V, before it turns.
I think the whole end is going to take years to play out and cause intense frustration for bears.
Cycle wave IV is about 1/3 of the way through. It could easily end within a year.
Cycle wave V may be relatively brief and short, as cycle III was a long extension. Cycle wave V may last only a year.
So it could all be over within 2 years quite easily. But also, it could take longer than that of course.
Dreamer,
This might help.
https://en.wikipedia.org/wiki/U.S._Dollar_Index
Based on this the US$ index will do well, despite reality!