
Price continues higher towards the target for this upwards movement to end.
Two hourly charts are provided today. They both expect the same direction next, only the Elliott wave structures are different, and both have the same target.
Summary: Upwards movement may end tomorrow at 1,268. Thereafter, a third wave down may begin.
Short positions opened on or before 1st of December, and particularly any short positions opened above 1,287.61, may still be held for traders with a longer term horizon.
The trend for now is down. Bounces are opportunities to enter the trend. All trades should remain with the trend.
Always trade with stops and invest only 1-5% of equity on any one trade.
New updates to this analysis are in bold.
Last monthly charts for the main wave count are here, another monthly alternate is here, and video is here.
Grand SuperCycle analysis is here.
MAIN ELLIOTT WAVE COUNT
WEEKLY CHART
Click chart to enlarge.
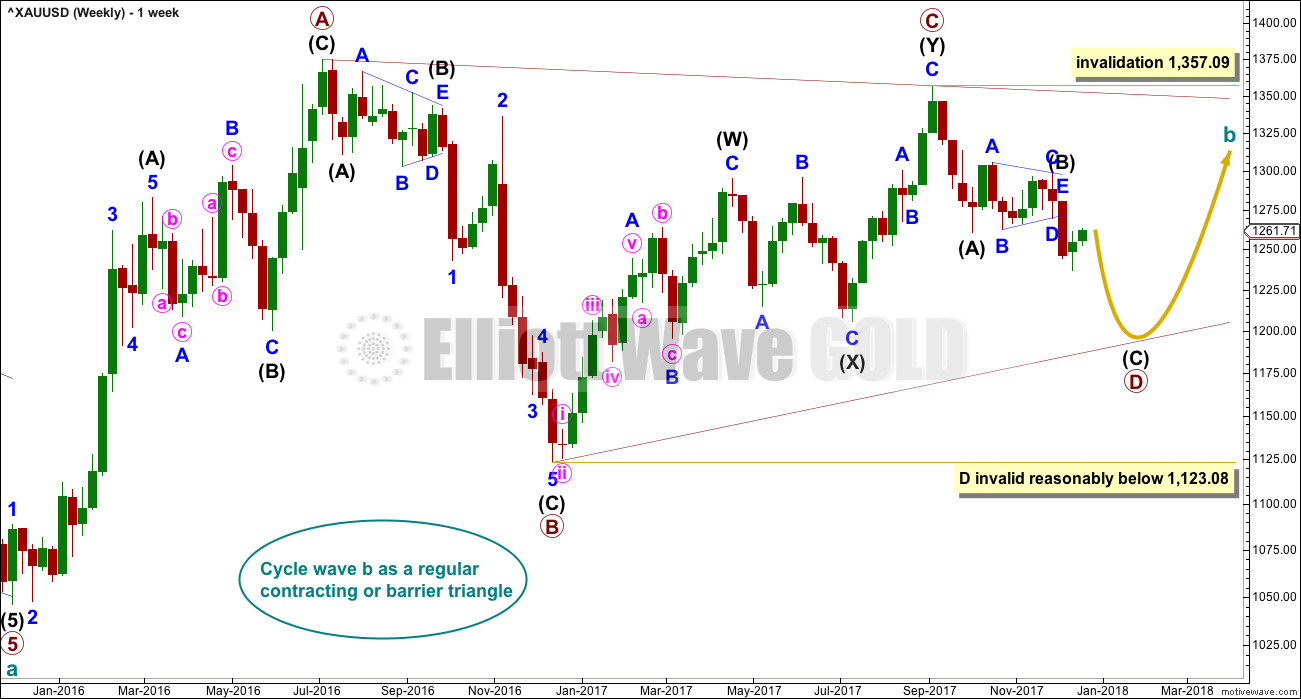
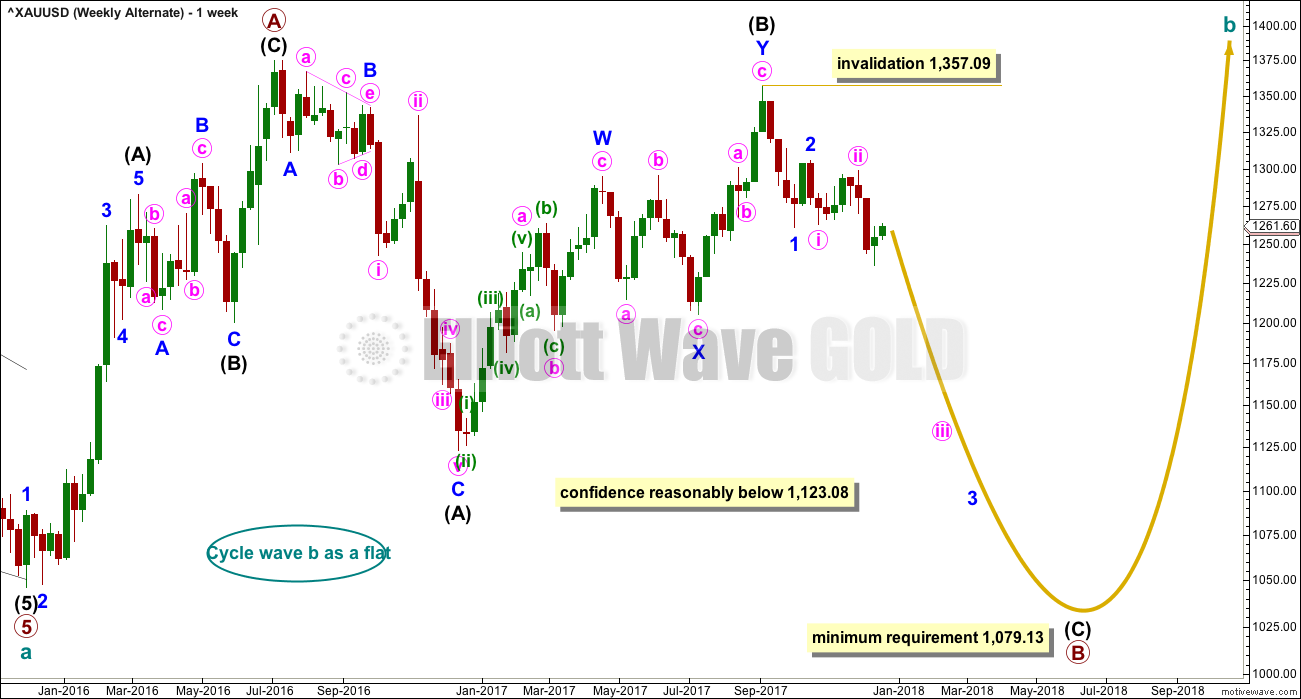
All wave counts expect that Gold completed a large five down from the all time high in November 2011 to the low of December 2015, which is seen on the left hand side of both weekly charts.
If this analysis is correct, then the five down may not be the completion of the correction. Corrective waves do not subdivide as fives; they subdivide as threes. The five down is seen as cycle wave a within Super Cycle wave (a).
All wave counts then expect cycle wave b began in December 2015.
There are more than 23 possible corrective structures that B waves may take. It is important to always have multiple wave counts when B waves are expected.
It looks unlikely that cycle wave b may have been over at the high labelled primary wave A. Primary wave A lasted less than one year at only 31 weeks. Cycle waves should last one to several years and B waves tend to be more time consuming than other Elliott waves, so this movement would be too brief for cycle wave b.
This wave count looks at cycle wave b to be most likely a regular contracting triangle.
The B-D trend line should have a reasonable slope for this triangle to have the right look, because the A-C trend line does not have a strong slope. A barrier triangle has a B-D trend line that is essentially flat; if that happened here, then the triangle trend lines would not converge with a normal look and that looks unlikely.
Primary wave D should be a single zigzag. Only one triangle sub-wave may be a more complicated multiple, and here primary wave C has completed as a double zigzag; this is the most common triangle sub-wave to subdivide as a multiple.
Primary wave D of a contracting triangle may not move beyond the end of primary wave B below 1,123.08.
At its completion, primary wave D should be an obvious three wave structure at the weekly chart level.
For this one weekly chart, two daily charts are presented below. They look at intermediate wave (B) in two different ways, and are presented now in order of probability.
DAILY CHART
Click chart to enlarge.
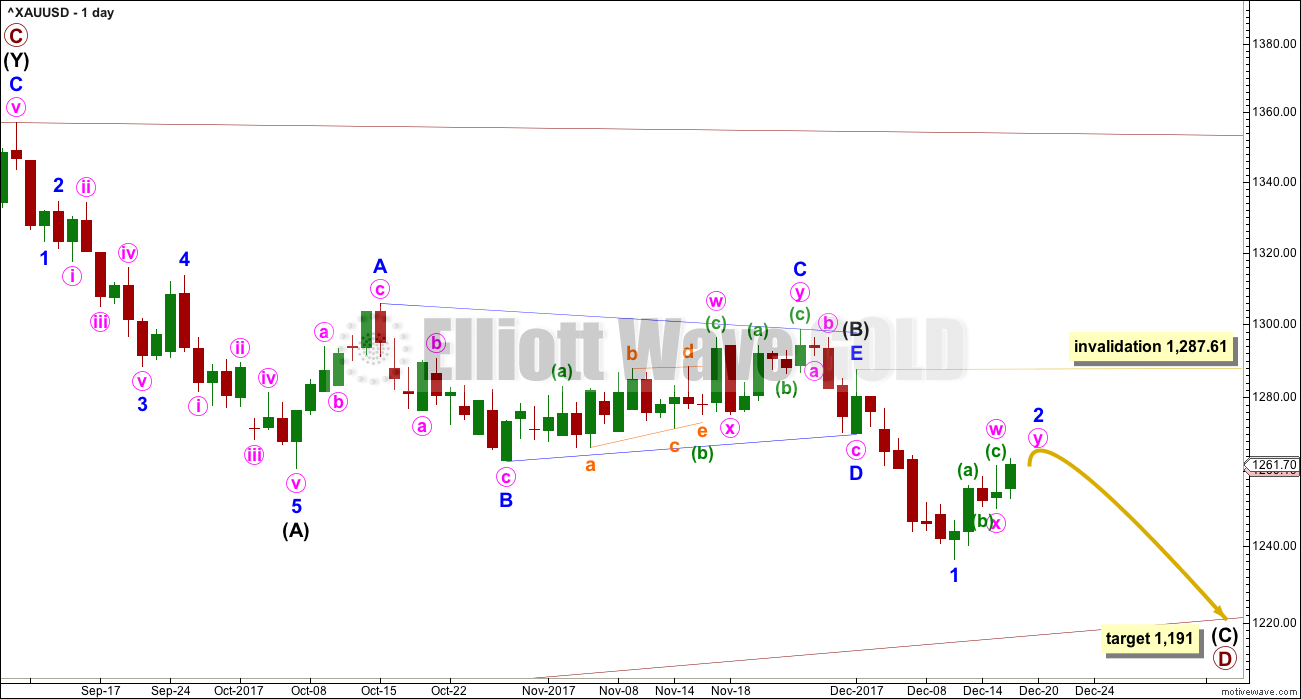
Both daily charts are identical up to the low labelled intermediate wave (A).
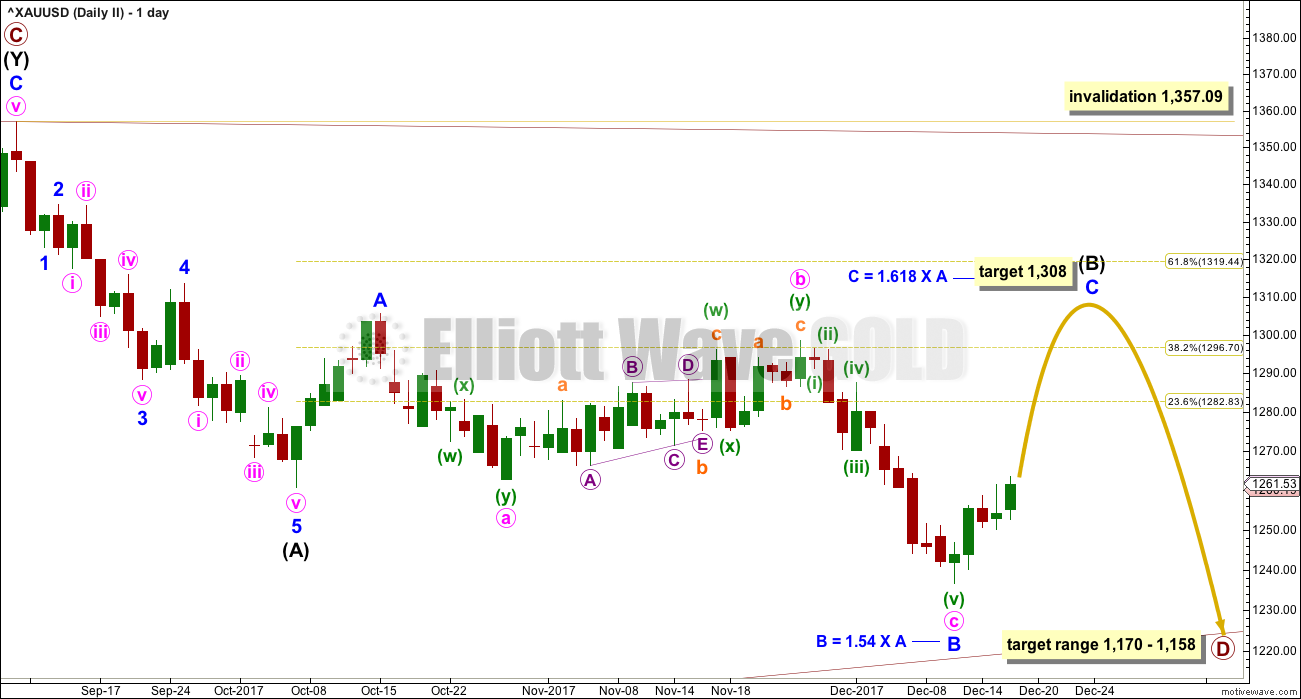
This first daily chart shows intermediate wave (B) as a now complete regular contracting Elliott wave triangle. This has support from what looks like a classic downwards breakout from the symmetrical triangle identified on the technical analysis chart below.
The target assumes that intermediate wave (C) may exhibit the most common Fibonacci ratio to intermediate wave (A).
Intermediate wave (C) must subdivide as a five wave structure. Within intermediate wave (C), minor wave 1 may now be complete.
Minor wave 2 so far has lasted only four days while minor wave 1 lasted seven days. Minor wave 2 may continue higher and be slightly longer lasting for the wave count to have a better look. It may continue for another one day to total a Fibonacci five.
Intermediate wave (A) lasted twenty sessions. Intermediate wave (C) may be about even in duration as well as length, so twenty or twenty-one sessions looks likely.
At its end, minor wave 2 may present an opportunity to join the downwards trend in time to catch a third wave down.
HOURLY CHART
Click chart to enlarge.
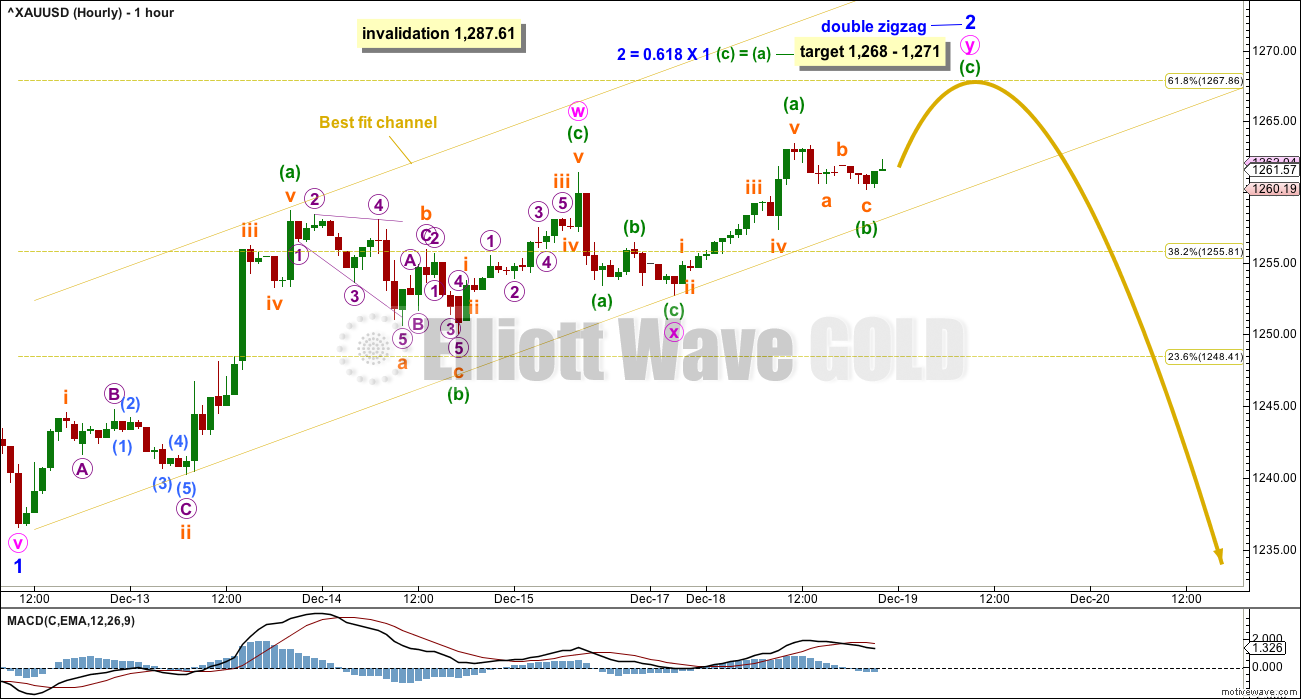
At this stage, minor wave 2 looks like either a single or multiple zigzag, so both structures will be considered.
This first wave count expects a double zigzag is almost complete for minor wave 2.
The bottom line here is that we should assume the upwards trend for minor 2 remains intact while price remains within the yellow best fit channel. When price breaks below the lower edge of that channel, then that shall be a strong indication that minor wave 2 would most likely be over, and a third wave down may then have just begun.
If minor wave 2 is a double zigzag, then the target is a $3 zone which may be met tomorrow.
Minor wave 2 may not move beyond the start of minor wave 1 above 1,287.61.
FIRST ALTERNATE HOURLY CHART
Click chart to enlarge.
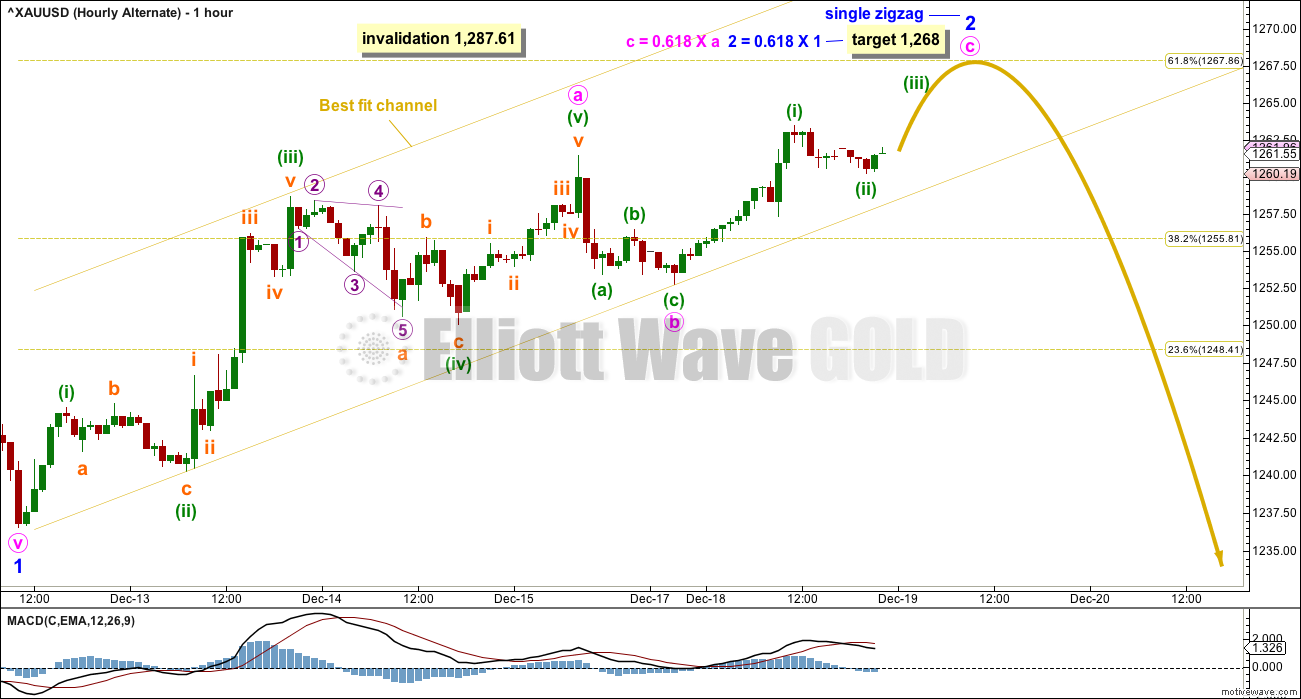
If minor wave 2 is a single zigzag, then this may be how it subdivides.
Although both hourly wave counts expect more upwards movement and have similar targets, the exercise in charting both structures is still valuable. Because only a single or multiple zigzag at this stage fits the structure of minor wave 2, and with both of those options charted and both yielding the same result, then we may have a little more confidence in the prediction.
If minor wave 2 is a single zigzag, then the target calculation at two degrees gives the same price point at 1,268.
SECOND DAILY CHART
Click chart to enlarge.
It is very important to always consider an alternate when a triangle may be unfolding. Triangles are very tricky structures, and may even be invalidated after one thinks they are complete.
It is still possible that intermediate wave (B) may be completing as a flat correction.
Within the flat correction, both minor waves A and B are threes. Minor wave B has retraced more than the minimum 0.9 length of minor wave A.
With minor wave B now a 1.54 length to minor wave A, an expanded flat is now indicated. Minor wave C of an expanded flat would most commonly be about 1.618 the length of minor wave A.
Now minor wave C may be required to move price upwards to end at least above the end of minor wave A at 1,305.72 to avoid a truncation.
A new high above 1,298.70 is required now for confidence in this wave count. If the upwards wave does not reach up to 1,298.70, then this second wave count will be discarded.
There should be something wrong or “off” about B waves. In this instance, the last downwards wave has some strength. While the market fell of its own weight, On Balance Volume gave bearish signals. Classic technical analysis does not support this wave count, so it looks unlikely now.
ALTERNATE ELLIOTT WAVE COUNT
WEEKLY CHART
Click chart to enlarge.
All wave counts are identical to the low labelled cycle wave a. Thereafter, they look at different possible structures for cycle wave b.
Cycle wave b may be a flat correction. Within a flat primary, wave B must retrace a minimum 0.9 length of primary wave A at 1,079.13 or below.
TECHNICAL ANALYSIS
WEEKLY CHART
Click chart to enlarge. Chart courtesy of StockCharts.com.
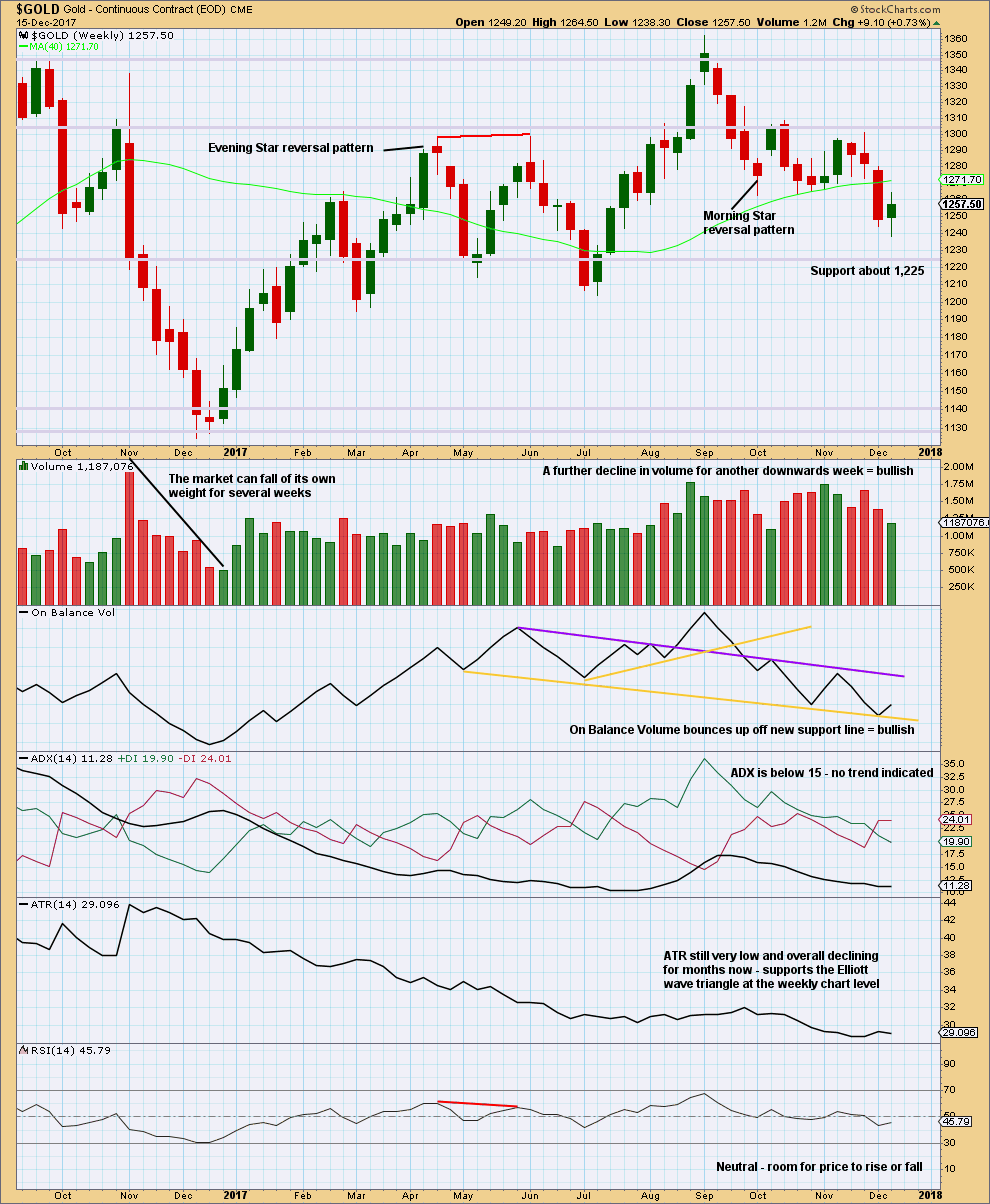
The market is falling of its own weight. Next support is about 1,225.
The small real body of the last weekly candlestick puts the trend from down to neutral.
The support line for On Balance Volume is redrawn. A bounce up this week may be bullish.
DAILY CHART
Click chart to enlarge. Chart courtesy of StockCharts.com.
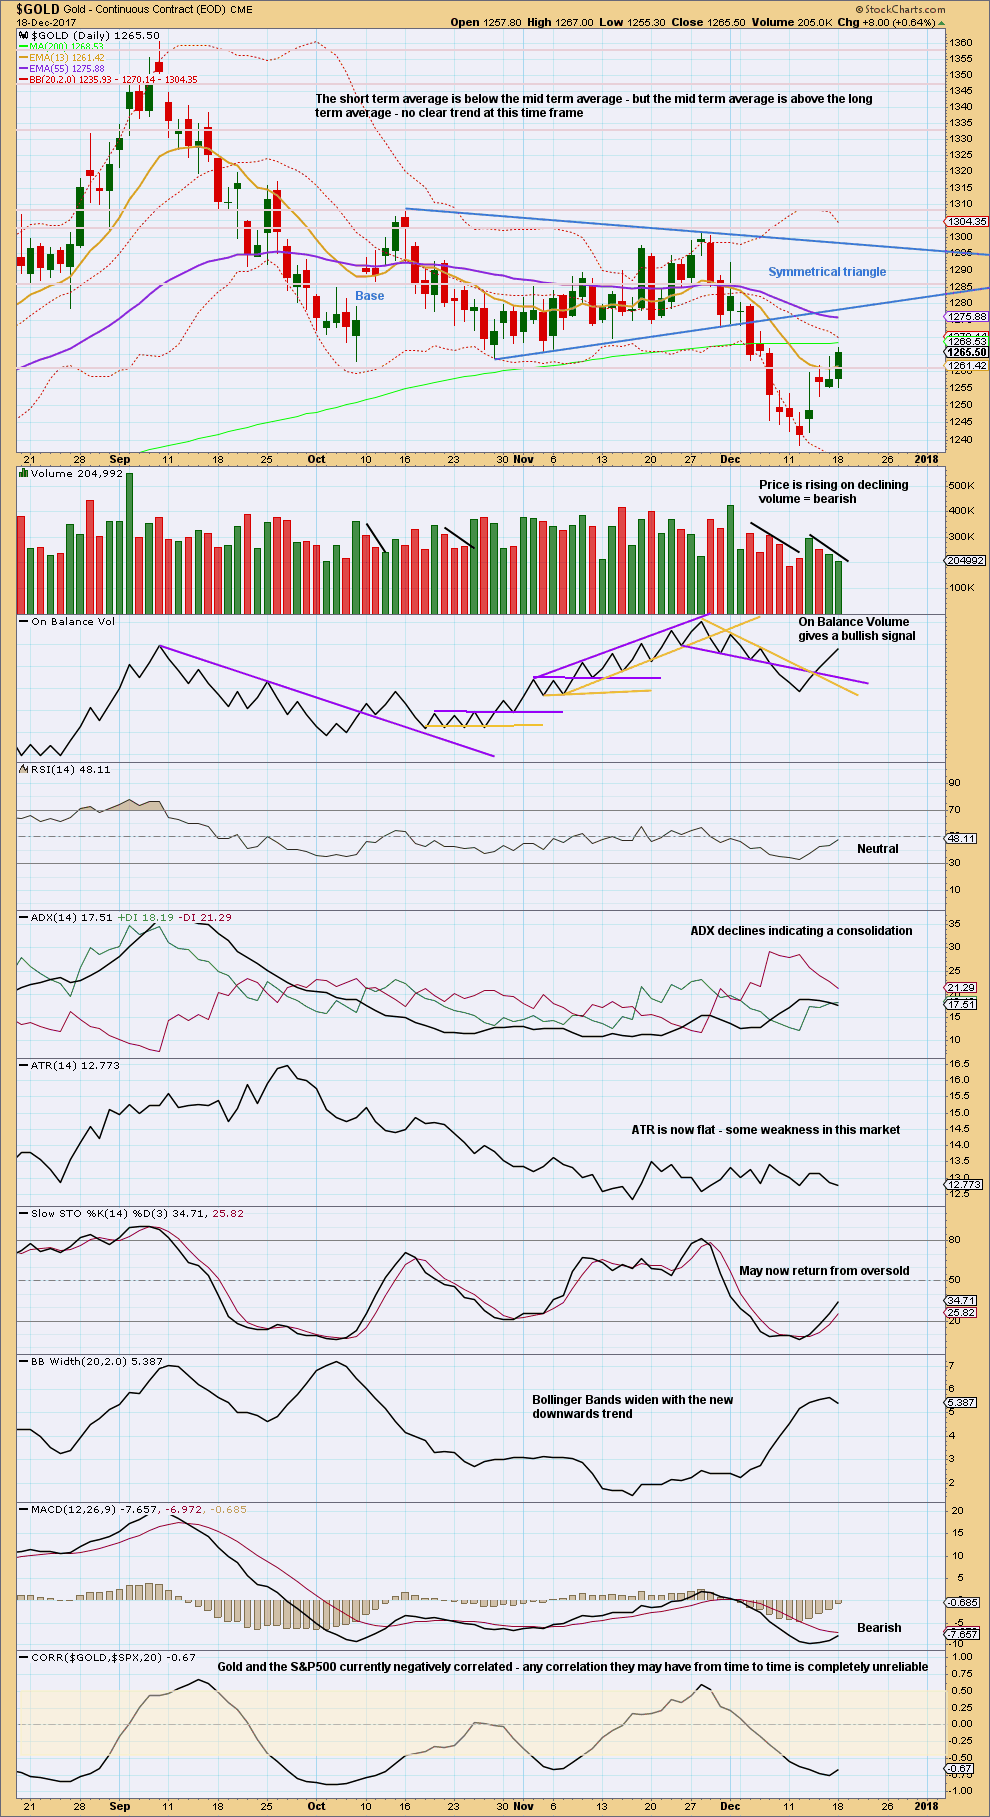
Upwards movement continues to not be supported by volume.
A throwback to the lower edge of the symmetrical triangle is unlikely, that happens only 37% of the time. And so we should expect this bounce to end very soon before it gets that high.
GDX DAILY CHART
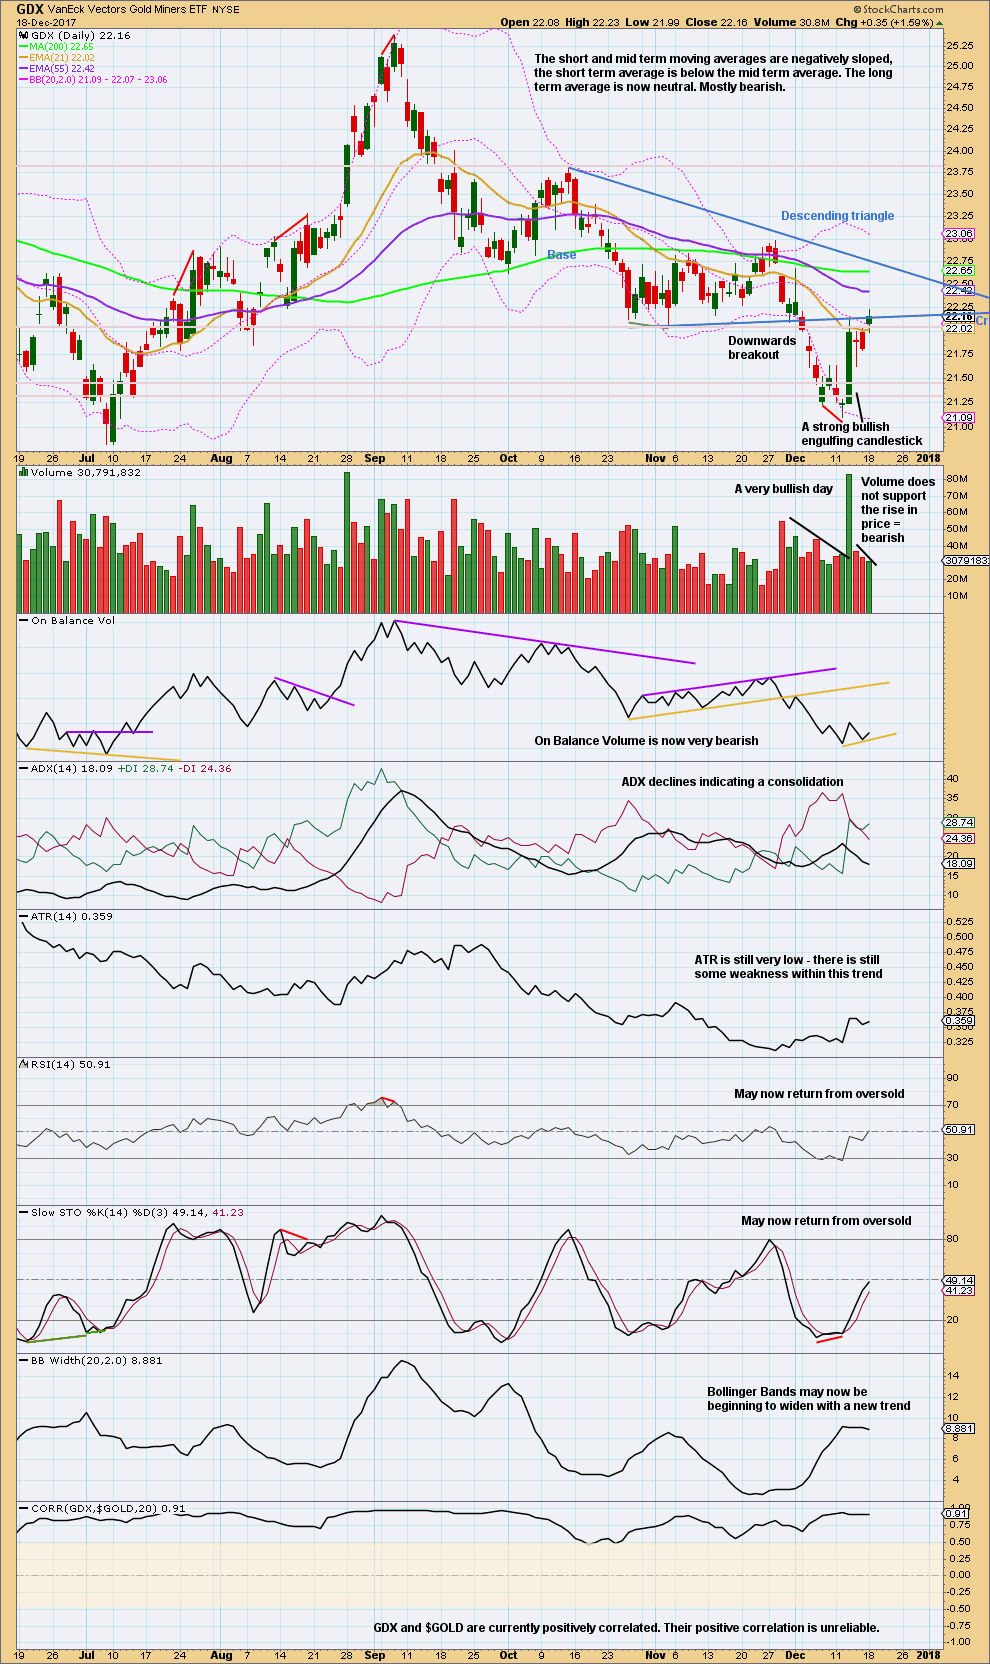
Click chart to enlarge. Chart courtesy of StockCharts.com.
Today’s upwards movement looks weak for GDX. There is fairly strong resistance here. If price turns down from it, then that would be another bearish signal. But if price continues higher here, it would look more bullish.
A sustained bullish trend requires support from volume though, and this is not the case at this time for GDX.
Published @ 10:57 p.m. EST.
Very little movement today. A time for patience methinks. Waiting to commit remaining spreads until it becomes clearer where minor two headed….
Am I in order to take a 7 wave structure and break it down into a DZZ or a single ZZ as shown in the chart attached, please? The degrees may or may not be correct as I have done it.
Would sincerely appreciate expertise and help, please.
Thank you kindly.
Exactly right David.
So as you can see this movement will fit as both a single or double ZZ.
That’s not always the case, but here it is.
Target calculation may be slightly different when you look at the two possibilities, which is one reason why it’s useful to consider both.
Thank you Lara 😀
Under your guidance and tutelage!
Too early to tell in trying to preempt the market at 1259.7x – imo probably better off long on a break below 1256 (if occur) for 1265+ with a stop (and reverse) at 1252 for 1243-37. Double edged sword so far with no clear direction. I’ll take my chances lol….
Sorry, I have a second question for today, please.
What is the significance or difference between the two hourly charts? It is a 2nd wave correction up – one sees the move as a single ZZ and the other as a double ZZ. And both have the same targets…. Lost!!
David, the way I see it, it’s helpful to know that both options have the same target as that increases confidence. Also, it’s useful to follow the hourly EW to see when the pattern is likely complete if you like to be “early” and initiate a short trade before there is a trendline breakdown. Even though the target is the same, the waves will be slightly different and the move up may complete below or above the target based on the actual waves.
Thank you very much Dreamer.
The attraction of this forum for me was the opportunity to learn EWT as best as I can. To achieve that I ask questions and I sincerely thank you for answering me.
I have learnt a lot from your various posts and TV charts, for which I thank you sincerely. The most outstanding was your GDX chart, where you saw a triangle for the B wave of the C, so that the E wave can be complex while still meeting the requirement that there can only be one complex wave in a triangle. After Lara, you are the best Elliottician in my mind.
I still do not see this. A single ZZ, 5-3-5 (A-B-C) can be further broken down or rearranged/squished into (5-3-5), (3-3-5) and (5-3-5) (W-X-Y). So, breaking down a larger structure into fractal components, IMHO, should give the same target?
Not the same as a congruence of, say, fib 38.2 on one time frame and, say, 61.8 on another time frame, IMHO.
Just my two cents.
Thank you kindly.
what Dreamer said
did you watch the video? I tried to explain my reasoning there…
The COT has commercials covering nearly 140,000 short contracts in the last 2 weeks. Reducing net short position from 260,000 to 120,000. In my experience the big boys locking in big profits covering the kind of numbers usually sets the scene for a decent rally. Generally demand is pretty strong into the Chinese new year.
http://www.321gold.com/cot_gold.html
Lara,
If at all possible could you kindly do an update on GDX video, please. The last one from October had three possible wave counts and I am not quite sure which one is panning out now.
Would sincerely appreciate your help.
Thank you kindly.
Lara, just a friendly reminder that I am still waiting for your expert help. Thanks.
I will try to get GDX updated before the end of this week.
I need to get my longer term analysis updated for both Gold and the S&P500 before this week is over, and I wanted to give you some analysis of NZDUSD because I think it’s about to embark on a third wave.
And so I will not be updating GDX this week.
The other reason why I’m going to say no to this request and the reason I so rarely update Elliott wave counts of GDX, is it’s a single equity. Single equities do not have the volume necessary for reliable Elliott wave analysis.
As Dreamer notes, for GDX it’s threes look like fives and vice versa fairly often, which makes EW analysis of it fairly hit and miss.
This is also why I provide daily classic technical analysis of GDX. I have more confidence in this classic analysis for equities than EW.
I see, ok, thanks.