
Price has been behaving exactly as expected now for over a week. We may have reasonable confidence in the current Elliott wave count. Volume analysis also supports it today.
Summary: Upwards movement may end tomorrow at 1,268 to 1,270. Thereafter, a third wave down may begin.
Always trade with stops and invest only 1-5% of equity on any one trade.
New updates to this analysis are in bold.
Last monthly charts for the main wave count are here, another monthly alternate is here, and video is here.
Grand SuperCycle analysis is here.
MAIN ELLIOTT WAVE COUNT
WEEKLY CHART
Click chart to enlarge.
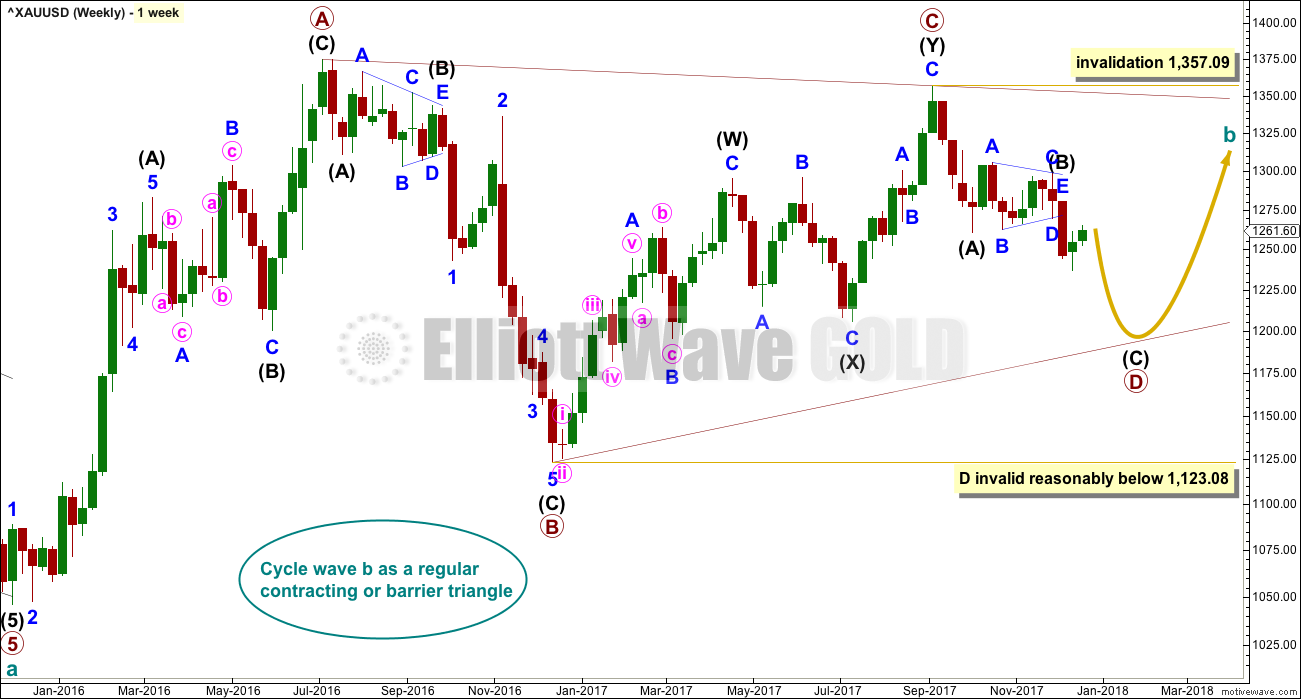
All wave counts expect that Gold completed a large five down from the all time high in November 2011 to the low of December 2015, which is seen on the left hand side of both weekly charts.
If this analysis is correct, then the five down may not be the completion of the correction. Corrective waves do not subdivide as fives; they subdivide as threes. The five down is seen as cycle wave a within Super Cycle wave (a).
All wave counts then expect cycle wave b began in December 2015.
There are more than 23 possible corrective structures that B waves may take. It is important to always have multiple wave counts when B waves are expected.
It looks unlikely that cycle wave b may have been over at the high labelled primary wave A. Primary wave A lasted less than one year at only 31 weeks. Cycle waves should last one to several years and B waves tend to be more time consuming than other Elliott waves, so this movement would be too brief for cycle wave b.
This wave count looks at cycle wave b to be most likely a regular contracting triangle.
The B-D trend line should have a reasonable slope for this triangle to have the right look, because the A-C trend line does not have a strong slope. A barrier triangle has a B-D trend line that is essentially flat; if that happened here, then the triangle trend lines would not converge with a normal look and that looks unlikely.
Primary wave D should be a single zigzag. Only one triangle sub-wave may be a more complicated multiple, and here primary wave C has completed as a double zigzag; this is the most common triangle sub-wave to subdivide as a multiple.
Primary wave D of a contracting triangle may not move beyond the end of primary wave B below 1,123.08.
At its completion, primary wave D should be an obvious three wave structure at the weekly chart level.
For this one weekly chart, two daily charts are presented below. They look at intermediate wave (B) in two different ways, and are presented now in order of probability.
DAILY CHART
Click chart to enlarge.
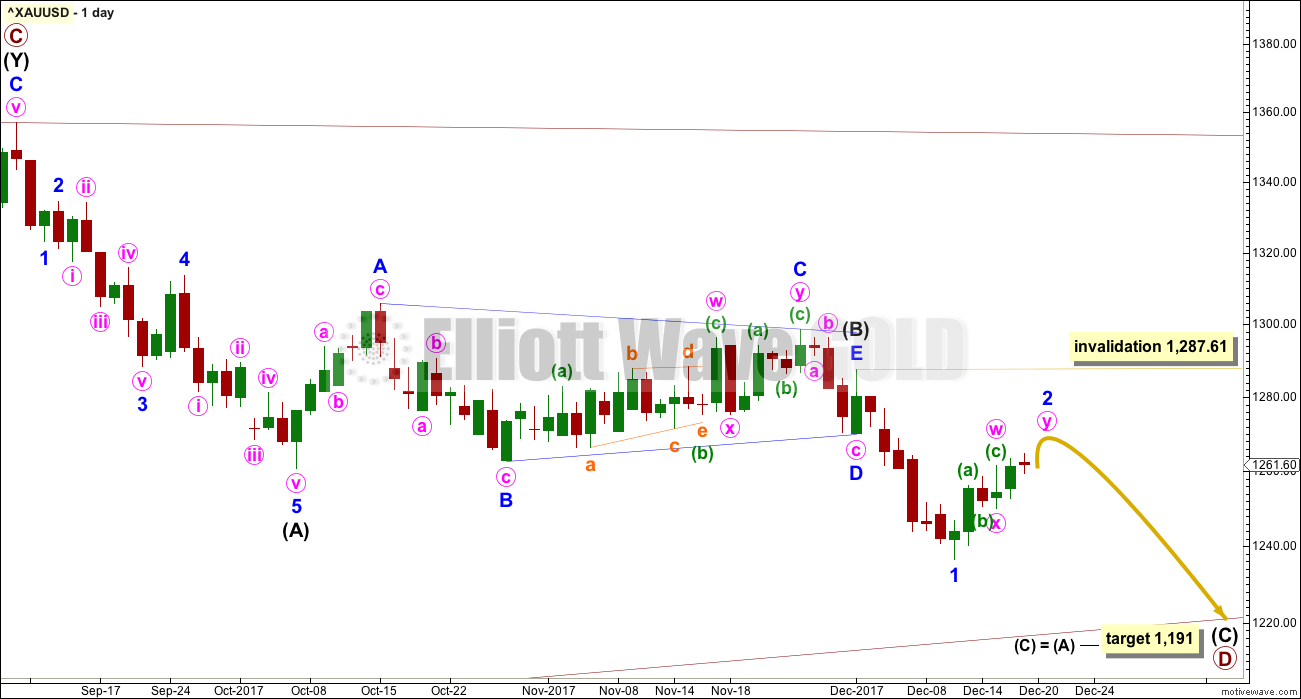
Both daily charts are identical up to the low labelled intermediate wave (A).
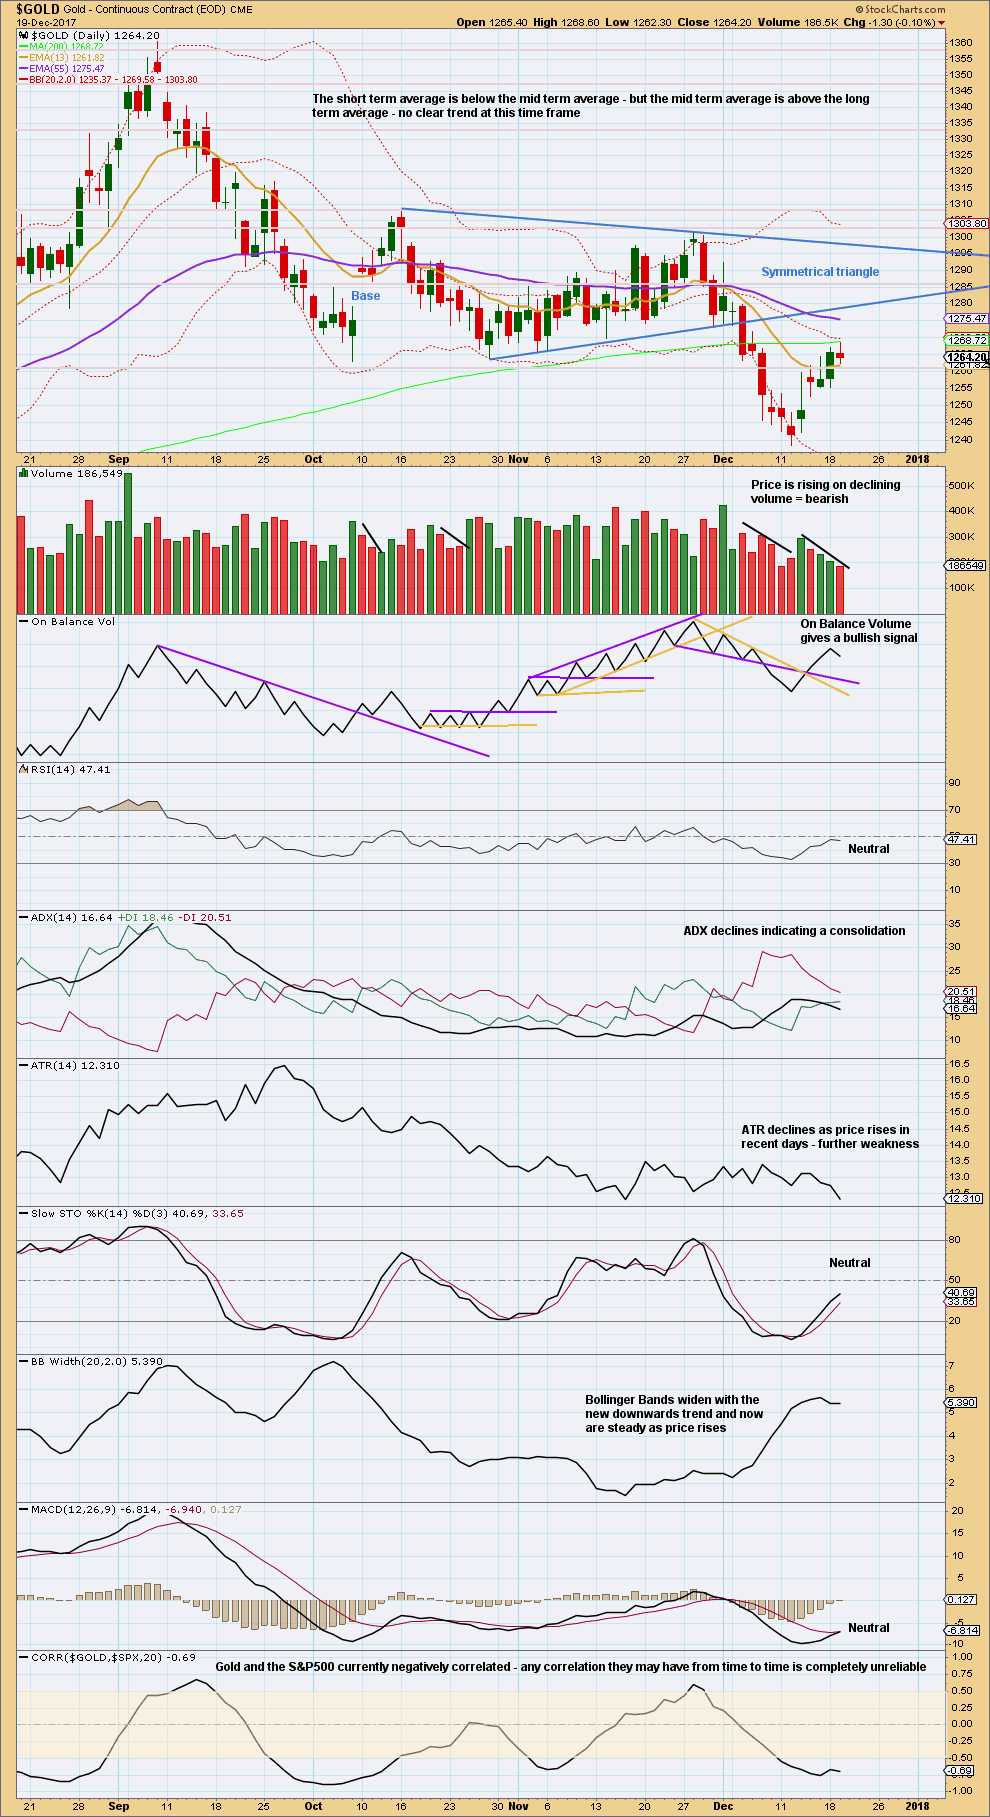
This first daily chart shows intermediate wave (B) as a now complete regular contracting Elliott wave triangle. This has support from what looks like a classic downwards breakout from the symmetrical triangle identified on the technical analysis chart below.
The target assumes that intermediate wave (C) may exhibit the most common Fibonacci ratio to intermediate wave (A).
Intermediate wave (C) must subdivide as a five wave structure. Within intermediate wave (C), minor wave 1 may now be complete.
Minor wave 2 so far has lasted five days while minor wave 1 lasted seven days. Minor wave 2 may be over here and exhibit a Fibonacci duration of five, or it may continue a little further and be closer in proportion to minor wave 1 and not exhibit a Fibonacci duration.
Intermediate wave (A) lasted twenty sessions. Intermediate wave (C) may be about even in duration as well as length, so twenty or twenty-one sessions looks likely. The next Fibonacci ratio in the sequence would be thirty-four, and it is possible intermediate wave (C) could be this long lasting.
At its end, minor wave 2 may present an opportunity to join the downwards trend in time to catch a third wave down.
HOURLY CHART

Click chart to enlarge.
At this stage, only one hourly chart will be presented. Yesterday’s alternate no longer has the right look.
Minor wave 2 so far fits best as a double zigzag structure. These are very common. The second zigzag exists to deepen the correction when the first zigzag does not move price deep enough, and sometimes also when it does not last long enough. Minute wave w ending at only 0.49 of minor wave 1 and lasting only three days fits this description.
Minute wave y is deepening the correction and taking up more time.
The best fit channel as drawn in last analysis is no longer useful because price broke below the lower edge but only with sideways movement, so it was not a clear downwards break. The channel is redrawn.
When this channel is clearly breached by downwards (not sideways) movement, then it shall provide an indication that minor wave 2 may be over and minor wave 3 may have begun. When the start of minor wave 3 is known, then a target may be calculated for it to end, but that cannot be done yet.
Minor wave 2 may not move beyond the start of minor wave 1 above 1,287.61.
SECOND DAILY CHART
Click chart to enlarge.
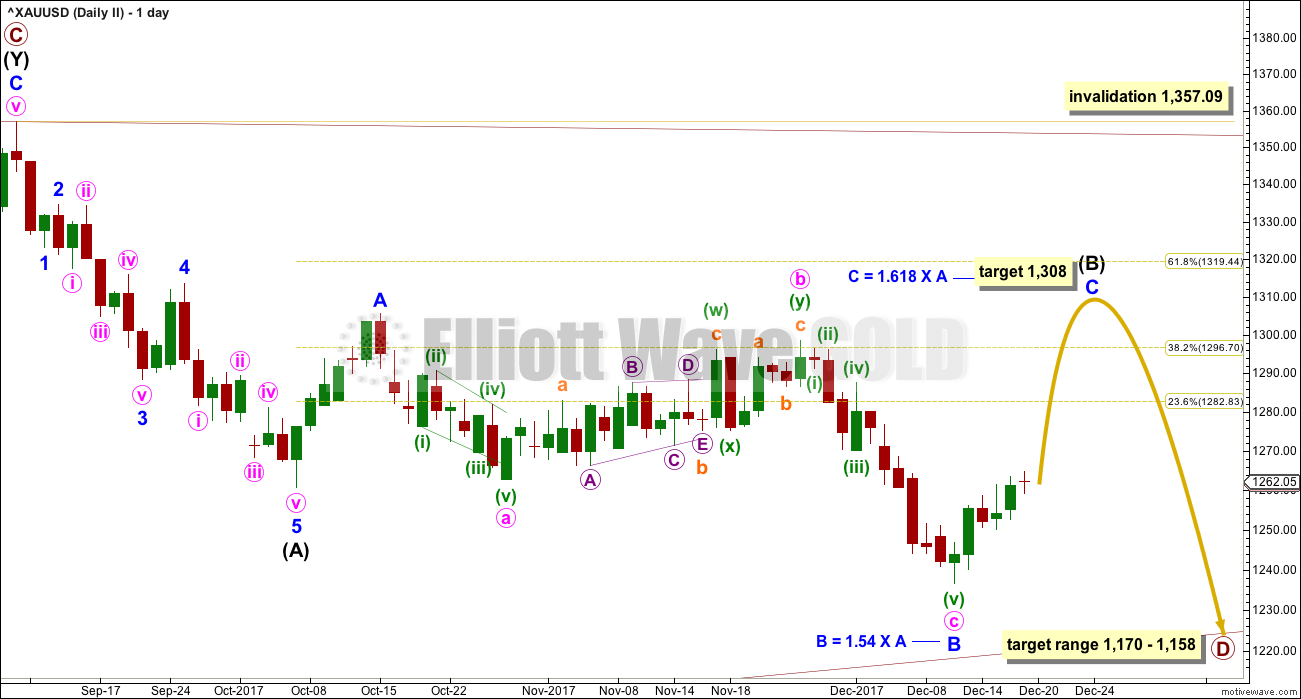
It is very important to always consider an alternate when a triangle may be unfolding. Triangles are very tricky structures, and may even be invalidated after one thinks they are complete.
It is still possible that intermediate wave (B) may be completing as a flat correction.
Within the flat correction, both minor waves A and B are threes. Minor wave B has retraced more than the minimum 0.9 length of minor wave A.
With minor wave B now a 1.54 length to minor wave A, an expanded flat is now indicated. Minor wave C of an expanded flat would most commonly be about 1.618 the length of minor wave A.
Now minor wave C may be required to move price upwards to end at least above the end of minor wave A at 1,305.72 to avoid a truncation.
A new high above 1,298.70 is required now for confidence in this wave count. If the upwards wave does not reach up to 1,298.70, then this second wave count will be discarded.
There should be something wrong or “off” about B waves. In this instance, the last downwards wave has some strength. While the market fell of its own weight, On Balance Volume gave bearish signals. Classic technical analysis does not support this wave count, so it looks unlikely now.
ALTERNATE ELLIOTT WAVE COUNT
WEEKLY CHART
Click chart to enlarge.
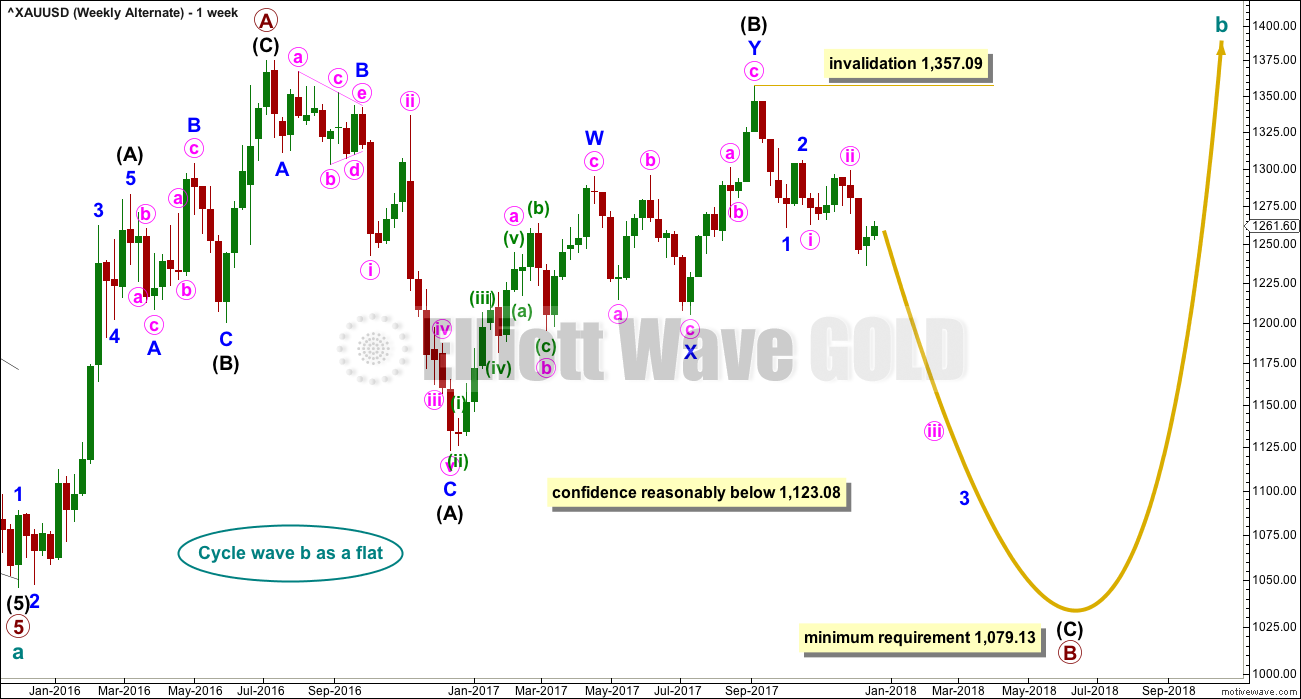
All wave counts are identical to the low labelled cycle wave a. Thereafter, they look at different possible structures for cycle wave b.
Cycle wave b may be a flat correction. Within a flat primary, wave B must retrace a minimum 0.9 length of primary wave A at 1,079.13 or below.
TECHNICAL ANALYSIS
WEEKLY CHART
Click chart to enlarge. Chart courtesy of StockCharts.com.
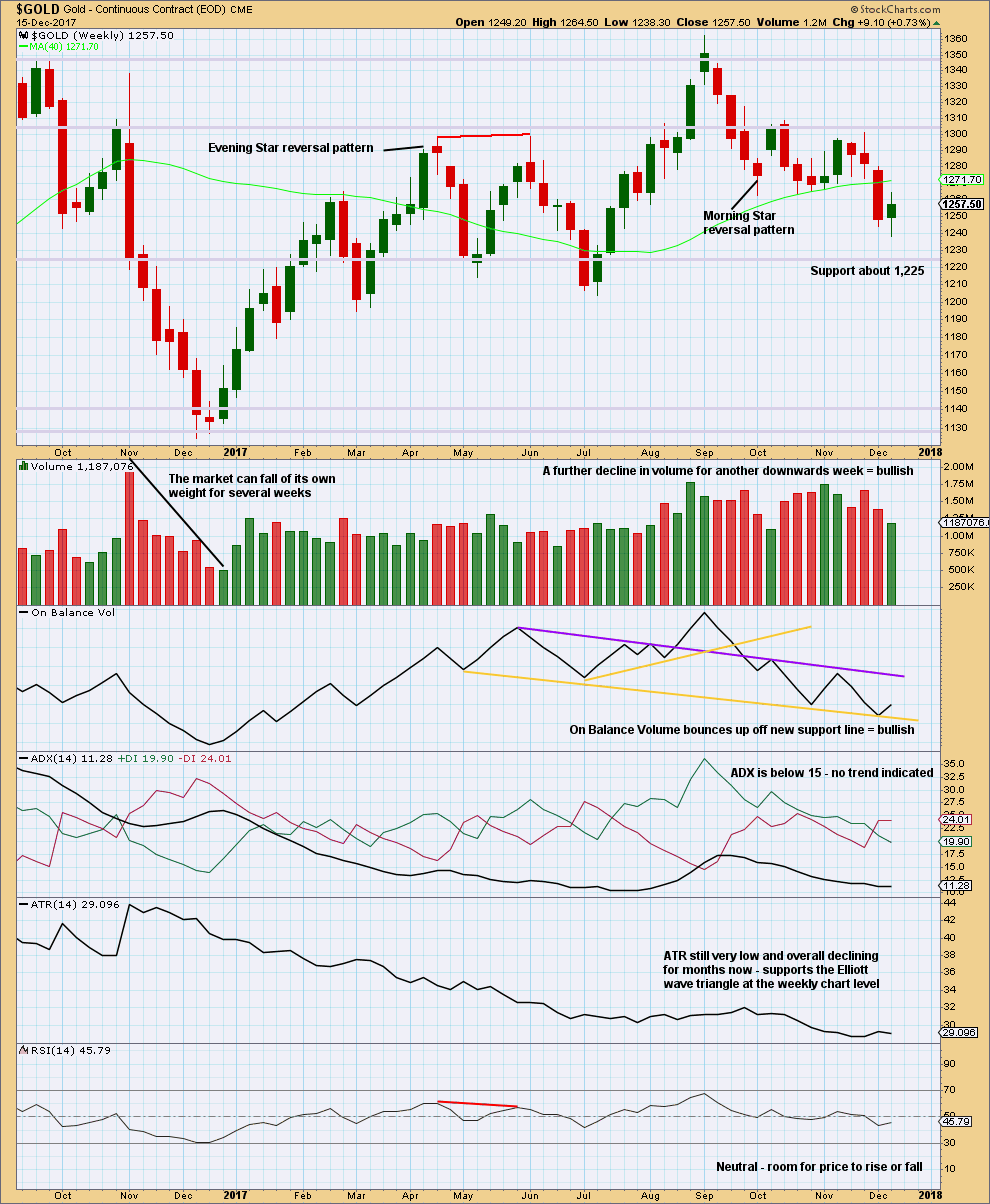
The market is falling of its own weight. Next support is about 1,225.
The small real body of the last weekly candlestick puts the trend from down to neutral.
The support line for On Balance Volume is redrawn. A bounce up this week may be bullish.
DAILY CHART
Click chart to enlarge. Chart courtesy of StockCharts.com.
While markets may fall of their own weight for considerable distances, rising price on declining volume is more of a concern. Price needs support from increasing activity of buyers for it to rise sustainably. So far, for the last four sessions, Gold price is rising on declining volume. This looks more likely to be a counter trend movement than the start of a new sustainable trend.
This view is reinforced with ATR now also declining as price rises. This upwards movement looks weak.
Coming after the symmetrical triangle and a downwards breakout, which had some strength, it looks like this movement is a bounce within a continuing larger downwards trend.
A throwback to the lower edge of the symmetrical triangle is unlikely, that happens only 37% of the time. And so we should expect this bounce to end very soon before it gets that high.
GDX DAILY CHART
Click chart to enlarge. Chart courtesy of StockCharts.com.
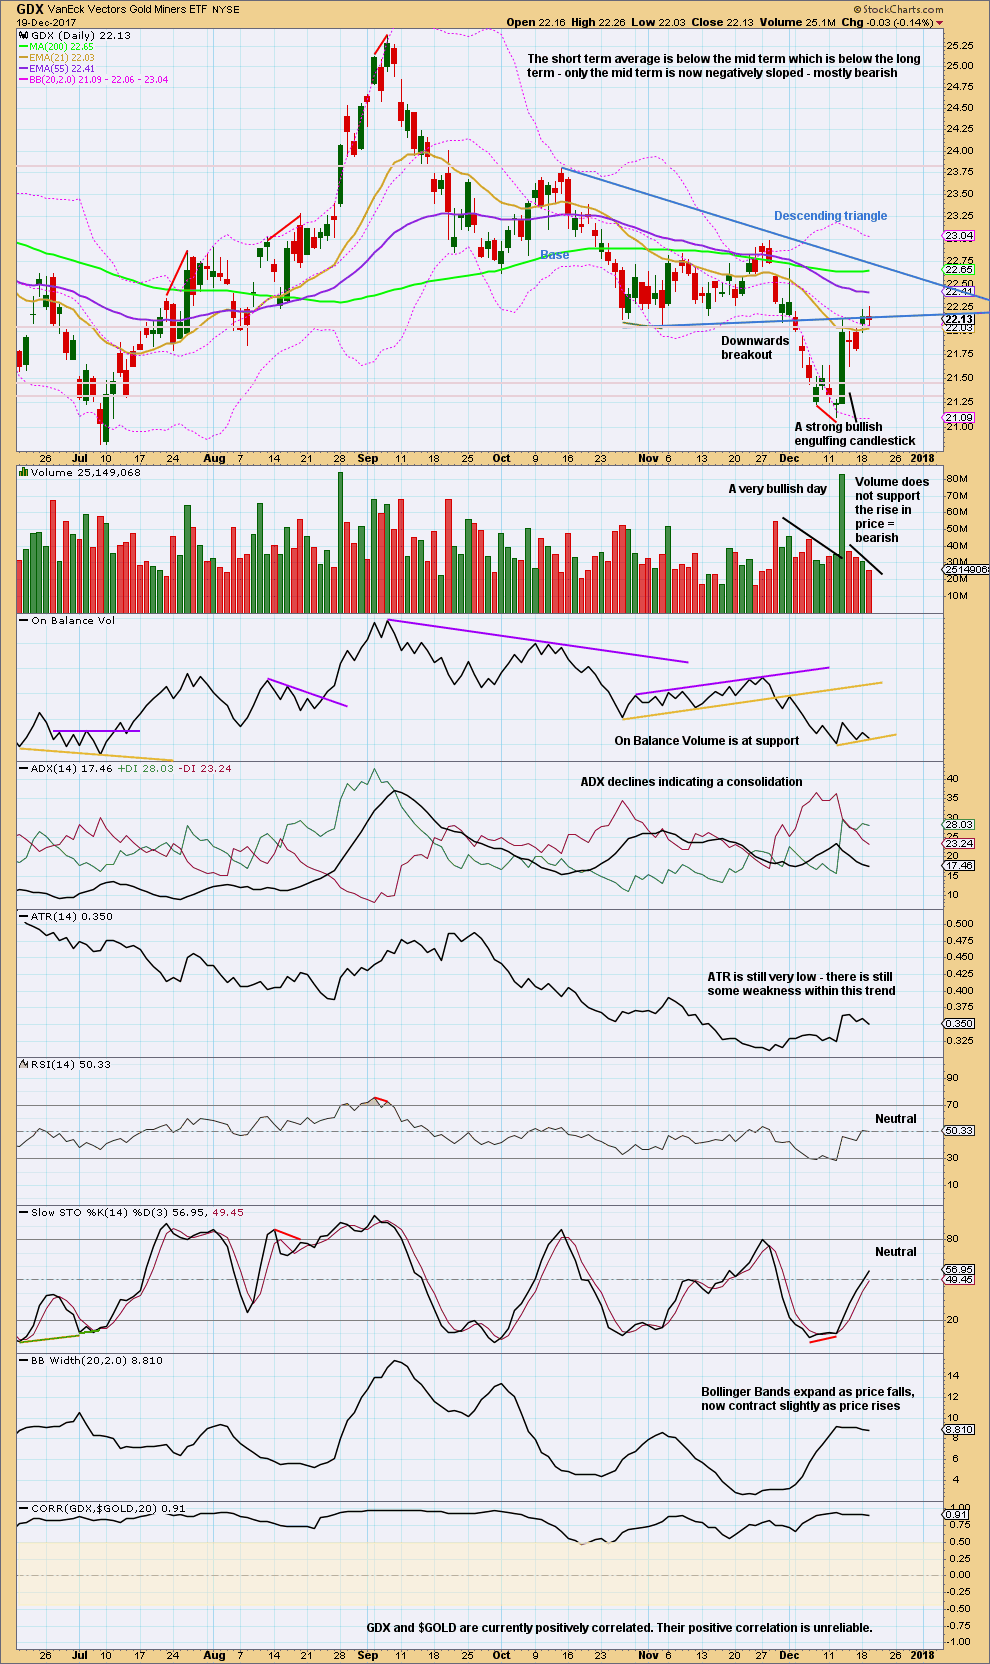
The small real bodies of the last two daily candlesticks puts the trend for the short term from up to neutral.
Volume, ATR and Bollinger Bands all point to this upwards movement more likely being a counter trend movement than the start of a new sustainable upwards trend. That view could change if price starts to move strongly higher, but this is what the data in hand indicates today.
TRADING ADVICE
[wlm_private “GOLD Daily YT|GOLD Daily NT|GOLD Daily NTGR|GOLD DAILY 6M NT|GOLD DAILY 6M YT|GOLD DAILY 6M NT GFR|GOLD Plus Daily YT|GOLD Plus Daily NT|OIL SILVER Weekly YT|OIL SILVER Weekly NT|GOLD Plus Daily 6M NT|GOLDPLUSDAY6M|OIL SILVER Weekly 6M NT|GOLDPLUSDAY1M|GOLDPLUSDAY1MYT|GOLDDAY6M|GOLDDAY1M|GOLDDAY1MYT|OILSILVERWEEK6M|OILSILVERWEEK1M|OILSILVERWEEK1MYT”]Short positions opened on or before 1st of December, and particularly any short positions opened above 1,287.61, may still be held for traders with a longer term horizon.
The trend for now is down. Bounces are opportunities to enter the trend. All trades should remain with the trend.
Members are advised today to enter short, with stops just above 1,280, if price gets up to 1,268.
If price does not rise to the target and breaks down below the channel on the hourly chart, then enter short there. The break must be with clearly downwards movement, not sideways.
Adjust position size so that only 1-5% of equity is risked on this one trade.
[/wlm_private]
Published @ 06:55 p.m. EST.
[Note: Analysis is public today for promotional purposes. Specific trading advice and comments will remain private for members only.]
Not too sure if Gold price is going down just yet. Stochastic remains bullish, ADX has dropped and 1262-59 appears to be holding. Expecting an up move.
The structure of minor 2 can now be seen as complete. The target uses equality with minor 1 because this fits with the lower target on the daily chart at 1,191 for the whole of intermediate (C) to end.
Let us see what volume has to say today. If it is even lighter then I would be expecting a turn here as very likely.
Use the channel for confidence. If price breaks below the lower edge with downwards (not sideways) movement then have confidence minor 3 has begun.
Two important lessons learnt so far: Channeling and Volume – “price is going up while volume does not match” 😀
Looking at stock I sold yesterday and see price has gone up, BUT VOLUME has gone down. Aha!!! A trap. In the past, I would have jumped right back in, not now. Thanks.
A classic TA tool that one is. For price to rise sustainably volume should support it.
This is because a sustainable rise in price (normally) requires increased activity from buyers.
This is not true though for falling price, it does not always require increased activity from sellers, an absence of buyers can achieve the same result.
As a good illustration: some years ago I tried to sell a car. My asking price in the beginning was quite ridiculous. No buyers showed up. I kept lowering the price until eventually there was enough interest for a sale to be made. The absence of buyers forced my price down.
Re: rising price needing increasing volume, there does seem to currently be an exception or a highly unusual situation with the US indices. Look at the S&P 500 since March 2009 on a monthly chart. Price has been rising but there is a general downwards trend from volume. This has been sustained now for many years.
Which leads me to think that when this bull market eventually ends the following fall may be very dramatic as there is very little to halt a fall in price / little support below.
Yes indeed. It is going to be most interesting when every one decides it’s time to leave the party and all the exits are blocked, viz., there are no buyers. Folk holding long leveraged positions should really be very concerned about this persistently low volume during the march higher. Those volume spikes on down days in the indices are also revealing that some folk are heading out the back door…quietly…. 🙂
Thank you Lara. This will also stick in my mind, especially with the car illustration – makes perfect sense. Also watched your explanation in the video about markets falling of their own weight.
Yes, S&P500, the last 4 months more pronounced than before, bigger up candles going up at a steeper angle. Merry ride up! Except, the ride does not have a corresponding rise in volume. Very telling,
Thanks a ton.
Buying back GLD 119 strike puts from my bullish put credit spread. Now positioned with 118.50 strike puts at essentially zero cost basis. I am struck by how many analysts, yes even EW analysts, are posting very bullish charts currently on Gold! Oh my…!!! 🙂
Verne,
Please pardon my ignorance.
How do you go about this, can you kindly explain in greater detail, please? I have never bought options and would like to learn this. Google does not help much, as it says Bullish put credit spread is used “when the investor expects a moderate rise in the price of the underlying asset”
Thank you kindly.
Credit spreads are trades in which you buy and sell an option in one trade and get paid to do so because the option you sell is worth more than the option you buy. They are one of what I call my “bread and butter trades” in that they can be traded with limited risk, and low risk reward ratio.
Once Lara identified the corrective minor 2 wave underway a few days ago, I put on a bullish GLD put spread by selling the Jan 19 119 puts and buying the 118.50 puts.
My risk on this trade was the difference in the strike price of the two options, namely 0.50 (fifty dollars) for each contract I sold IF GLD was trading BELOW 18.50 at expiration on Jan 19
As minor two neared completion, I simply bought back the 119 puts for much less than I sold them for and pretty close to what I paid for the 118.50 puts, which allowed me to get positioned for a possible third wave down for just about a zero cost. Hope that helps a bit Dave. 🙂
Thank you Verne. Yes, it makes sense now, with your detailed explanation, helping me to “walk” through it. Thanks. I trade from inside tax sheltered account, which severely restrict options trade and hence have kept away from them. I sincerely appreciate your patience and time.
Take this with a pinch of salt or maybe a bagful of salt!!
If you adjust the long term downtrend line a wee little bit, on a semi log scale, this is what happens. It cuts through 2 candle bodies and 1 wick in 2012. It is uncanny how well this line is being respected – as a solid resistance up until August this year and support since then. Even a spike in November 2016 respected this line.
It looks even better in the weekly time frame and does not cut through any candle bodies there.
Why is this “Your comment is awaiting moderation.” ? Help, please. Thanks.
Did you edit your comment after posting? For some unknown reason, when you edit a comment that has an attachment or link, the post will go into moderation. Lara is aware of the issue.
Ah, that explains it. Yes, I did edit it. Thank you Dreamer as always.
I am afraid I have not explained this well.
All TA books of repute say do not draw trend lines cutting price. I have meticulously followed this directive all along. However, gold’s “magic” trend line seems to work ONLY if you cut through price in 2012. Why is this? Is it indicative of market manipulation? However, if that is the case, how do the moves so accurately follow EW rules?
Any ideas?
Thanks.
it’s not really being perfectly respected though.
it’s repeatedly overshot on both sides
I don’t think it has enough technical significance for me to develop a very bullish wave count in response to it.
This is the same trendline that Stuart posted a few weeks ago. Price bounced on que. The big question is will it hold? Looks like strong support, yet it needs to fail for Lara’s main count.
If it holds, Lara’s count would need to change to a bullish one.
If it breaks, business as usual.
We should know shortly.
David,
Thanks for your kind words about my EW charts. I was lucky enough to find EWG in 2013 when Lara first started the site as a spin off of her EWSM site. I’m still learning all the time.
Elliott wave is a great tool that’s easy to learn the basics, but oh so hard to master. That’s why you see so much “junk” EW analysis online. Rules broken left and right. Lara’s strict dedication to the rules, guidelines, and details are surpassed by none.
So keep asking all the questions that you can think of. You are learning a lifetime skill. It’s good for all of us when members ask questions.
P.S. I’ll get back to posting GDX charts at some point. I’m focusing on Natural Gas right now while I wait for GDX to clarify it’s intentions.
Dreamer,
You are welcome and thank you.
No worries about GDX. I do not like to impose myself upon anyone. I requested Lara for a GDX update only because it was already analyzed by her before. In the absence of expert level input on GDX moves, I sold my holdings today, because I do not see strength in the recent move up.
Thank you kindly.
Lara,
In the previous comments section you refereed to GDX as a “single equity”. Just for clarification, GDX is an ETF comprised of the 51 largest miners in the world.
https://www.vaneck.com/etf/equity/gdx/holdings/
Volume for the last 10 days has averaged about 37.4 million shares daily, which is actually much lower than the average volume for FY 2016 which looks to average around 80 million per day. (the big move up got traders excited!)
For comparison, AAPL had average volume of 27.3 million for the last 10 days. So as you can see, GDX does have greater volume than AAPL. That said, I know that you have had issues in the past with charting AAPL EW counts just as GDX has been challenging to count EW accurately.
My bad, I didn’t look it up. Thank you for clarifying Dreamer.
It’s volume is still not big enough I think for reliable EW analysis, because as you and I have both noted it just doesn’t always give normal looking EW structures.
But then… neither does the S&P.
The only markets I’ve analysed which do seem to be Gold and EURUSD.
Oh, and maybe US Oil… that seems to have pretty good looking EW structures….
Hi Lara,
an update on EURUSD would be great, I would expect it is turning south in a strong way very soon….
then enjoy your well earned holiday 🙂