
Downwards movement was expected as fairly likely for Monday’s session. An inside day is complete; price has mostly moved sideways. This changes the short term picture.
The classic triangle pattern is identified; a breakout may come about 73% to 75% of the triangle length (this is calculated today). Members are advised on when we may see a breakout.
Summary: Members please note: the second wave count is strongly preferred.
This sideways triangle may continue for another three weeks. The breakout is still expected to be downwards.
Upwards swings are an opportunity to enter short positions at highs. Downwards swings are opportunities to enter long positions at lows if members choose to hedge this triangle.
More risk averse members may choose to wait for a breakout before entering a trade. If this is your preferred option, then enter as soon as price breaks out; do not wait for a pullback or throwback that may not come.
Always trade with stops and invest only 1-5% of equity on any one trade.
New updates to this analysis are in bold.
Last monthly charts for the main wave count are here, another monthly alternate is here, and video is here.
Grand SuperCycle analysis is here.
To avoid swapping wave counts over while cycle wave b continues, they will be labelled in the order they were developed: first, second and third. At this time, the second wave count is preferred because its Elliott wave structure has a better fit and has more support from classic technical analysis.
FIRST ELLIOTT WAVE COUNT
WEEKLY CHART
Click chart to enlarge.
Both wave counts expect that Gold completed a large five down from the all time high in November 2011 to the low of December 2015, which is seen on the left hand side of both weekly charts.
If this analysis is correct, then the five down may not be the completion of the correction. Corrective waves do not subdivide as fives; they subdivide as threes. The five down is seen as cycle wave a within Super Cycle wave (a).
Both wave counts then expect cycle wave b began in December 2015.
There are more than 23 possible corrective structures that B waves may take. It is important to always have multiple wave counts when B waves are expected.
It looks unlikely that cycle wave b may have been over at the high labelled primary wave W. Primary wave W lasted less than one year at only 31 weeks. Cycle waves should last one to several years and B waves tend to be more time consuming than other Elliott waves, so this movement would be too brief for cycle wave b.
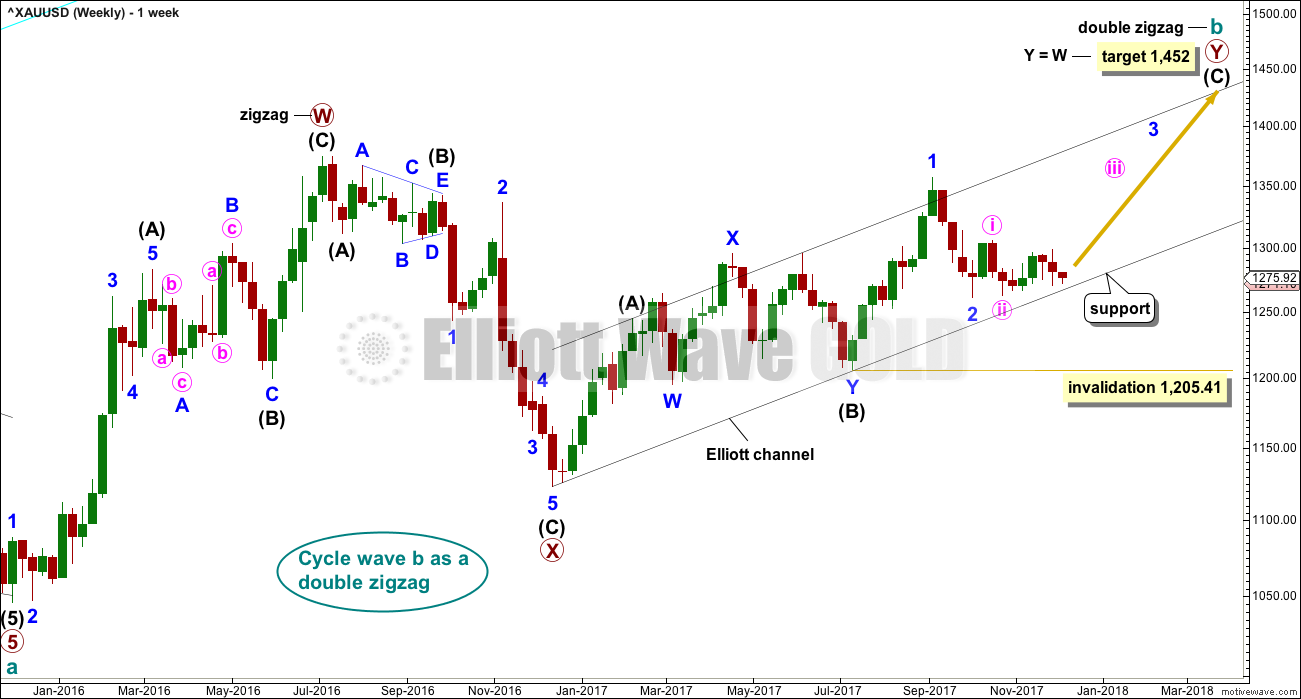
This first wave count expects that cycle wave b may be an incomplete double zigzag.
While this first wave count is entirely possible, there are three problems now which reduce its probability.
1. Cycle wave b is a double zigzag, but primary wave X within the double is deep and time consuming. While this is possible, it is much more common for X waves within double zigzags to be brief and shallow.
2. Intermediate wave (B) within the zigzag of primary wave Y is a double flat correction. These are extremely rare, even rarer than running flats. The rarity of this structure must further reduce the probability of this wave count.
3. Although intermediate wave (C) should be continuing so that primary wave Y ends substantially above the end of primary wave W, the duration of minor wave 2 within it now looks to be too large at the weekly time frame.
Within intermediate wave (C), no second wave correction may move beyond the start of its first wave below 1,205.41. However, prior to invalidation, this wave count may be discarded if price breaks below the lower edge of the black Elliott channel. If this wave count is correct, then intermediate wave (C) should not break below the Elliott channel which contains the zigzag of primary wave Y upwards.
DAILY CHART
Click chart to enlarge.
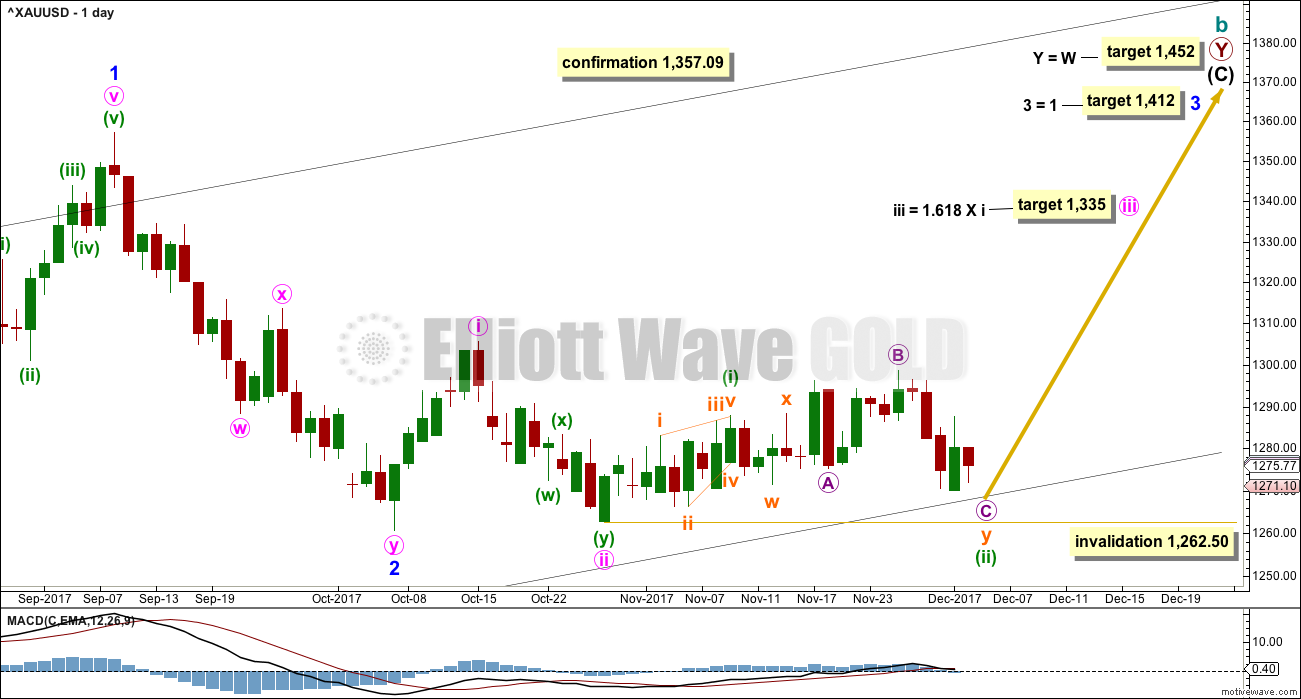
The analysis will focus on the structure of intermediate wave (C).
Intermediate wave (C) must be a five wave structure, either an impulse or an ending diagonal. It is unfolding as the more common impulse.
Minor wave 1 was a long extension. The target for minor wave 3 expects that too may be a long extension. If this is the case, then minor wave 5 may be shorter (only two actionary waves in an impulse may be extended).
The target for minute wave iii fits with higher targets and expects it to exhibit the most common Fibonacci ratio to minute wave i.
If price makes a new high above 1,357.09, then the second wave count below would be discarded and more confidence may be had in this first wave count.
This first wave count now expects there should be a series of three overlapping first and second waves: minor, minute, and minuette. Today’s analysis at the hourly chart level is changed to see minuette wave (ii) not yet quite complete.
Minuette wave (ii) may not move beyond the start of minuette wave (i) below 1,262.50.
HOURLY CHART
Click chart to enlarge.
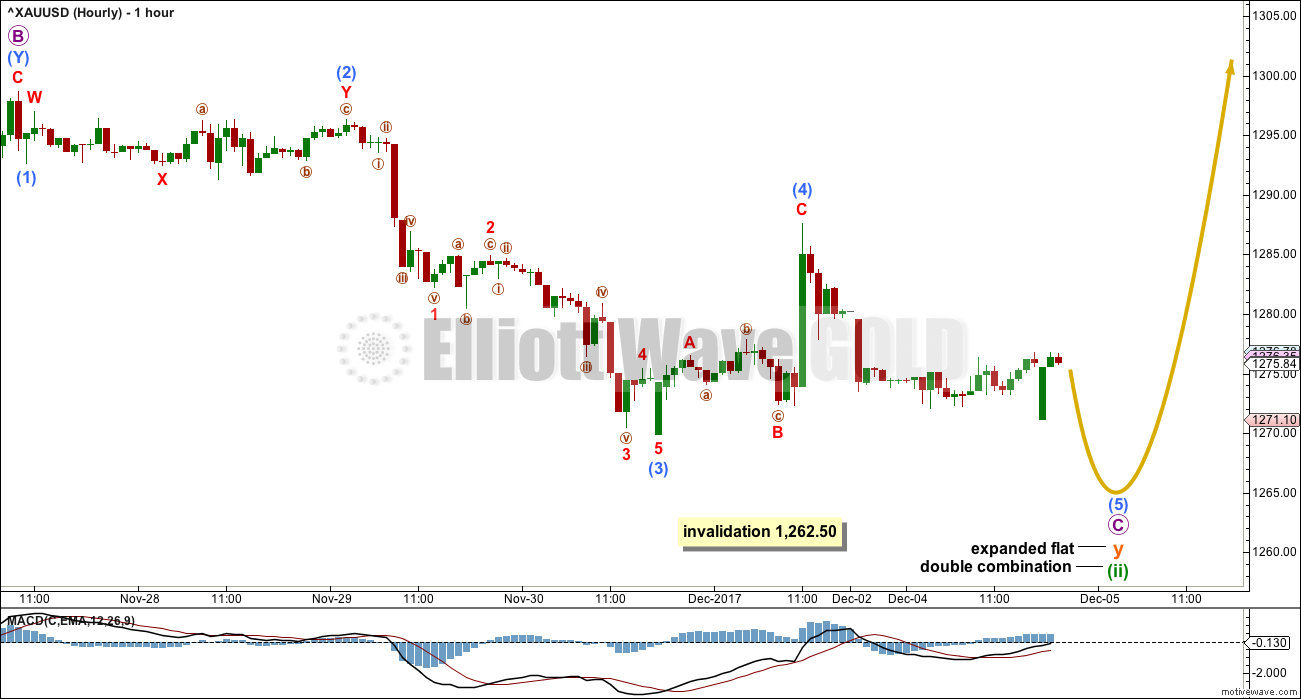
Because upwards movement from the last low now subdivides only as a three and is complete, minuette wave (ii) may not be complete. If it were, then a five up should have developed.
Micro wave C must complete as a five wave structure. So far sub-micro waves (1) through to (4) may be complete. Only sub-micro wave (5) may now be needed to complete the whole structure up to and including minuette degree.
Minuette wave (ii) may not move beyond the start of minuette wave (i) below 1,262.50. A new low by any amount at any time frame would invalidate this wave count, and it would be discarded at all time frames.
SECOND ELLIOTT WAVE COUNT
WEEKLY CHART
Click chart to enlarge.
Both wave counts are identical to the low labelled cycle wave a. Thereafter, they look at different possible structures for cycle wave b.
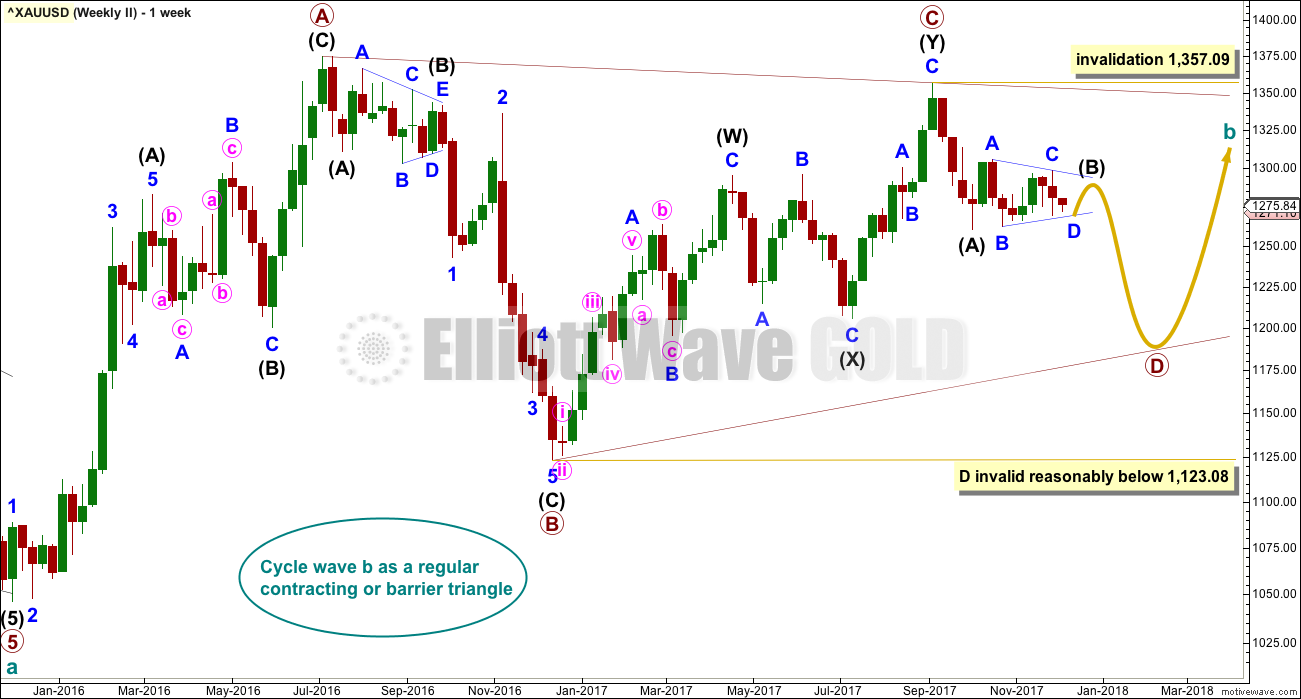
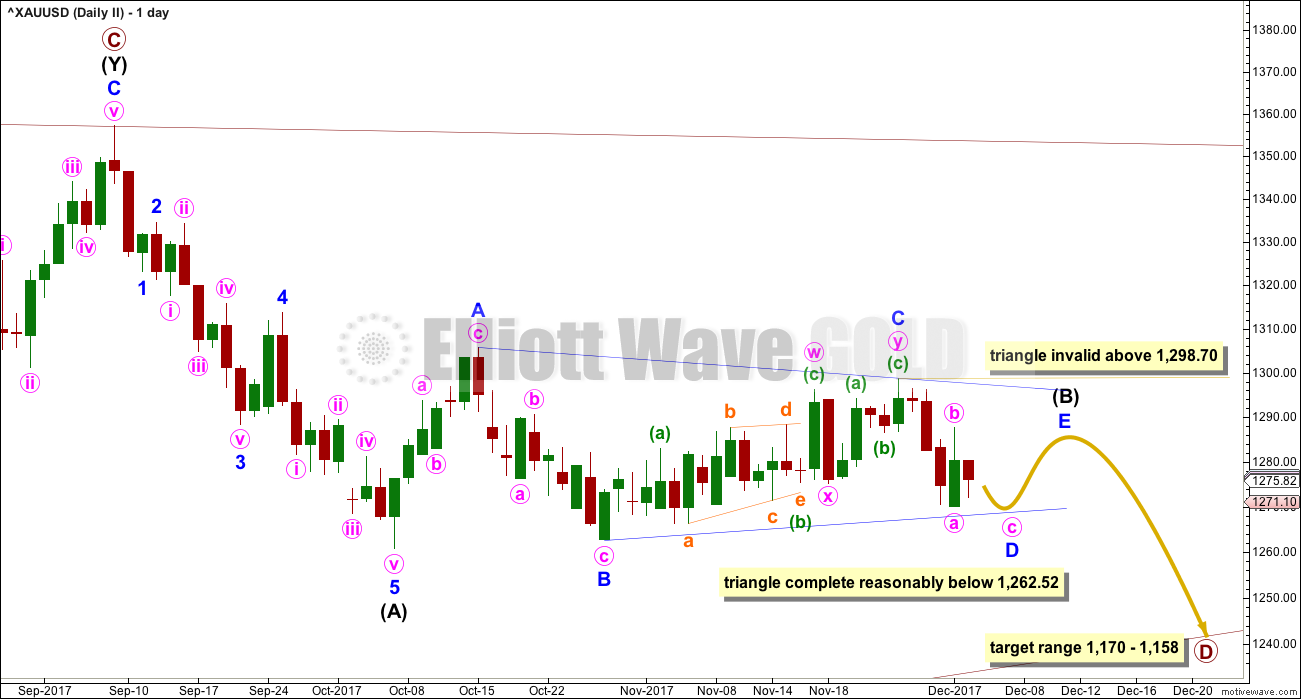
This wave count looks at cycle wave b to be most likely a regular contracting triangle.
The B-D trend line should have a reasonable slope for this triangle to have the right look, because the A-C trend line does not have a strong slope. A barrier triangle has a B-D trend line that is essentially flat; if that happened here, then the triangle trend lines would not converge with a normal look and that looks unlikely.
Primary wave D should be a single zigzag. Only one triangle sub-wave may be a more complicated multiple, and here primary wave C has completed as a double zigzag. This is the most common triangle sub-wave to subdivide as a multiple.
Primary wave D of a contracting triangle may not move beyond the end of primary wave B below 1,123.08.
At its completion, primary wave D should be an obvious three wave structure at the weekly chart level. Within primary wave D, intermediate wave (B) is incomplete. At this stage, it looks like intermediate wave (B) may be unfolding as a triangle. This now has a better fit at the daily and hourly chart level. At its conclusion, intermediate wave (B) should look like a corrective structure at the weekly chart level.
At this stage, the triangle of intermediate wave (B) will be labelled as incomplete, with minor wave D now completing a little lower. When that is done, then minor wave E upwards should complete. This may now take another one to three weeks to unfold.
DAILY CHART
Click chart to enlarge.
This is the preferred wave count.
A common length for triangle sub-waves is from 0.8 to 0.85 the length of the prior wave. Primary wave D would reach this range from 1,170 to 1,158.
Primary wave D should subdivide as a zigzag. Within the zigzag, intermediate wave (B) may be unfolding as a triangle.
Within the triangle of intermediate wave (B), minor wave D may be incomplete and may move lower as a zigzag.
Because here the A-C trend line has a reasonable slope, this triangle for intermediate wave (B) may be either a regular contracting or regular barrier triangle. This means that minor wave D may end about the same level as minor wave B at 1,262.52, and in practice may end slightly below this point. As long as the lower B-D trend line remains essentially flat the triangle for intermediate wave (B) will remain viable.
A new low reasonably below 1,262.50 could not be a continuation of the triangle, so at that stage the triangle should be complete. Upon completion of Elliott wave triangles, it is most common for price to move strongly out of the triangle. This is most common, but not necessarily what always happens. If this triangle is complete, then it is most likely that price may tell us quickly.
HOURLY CHART
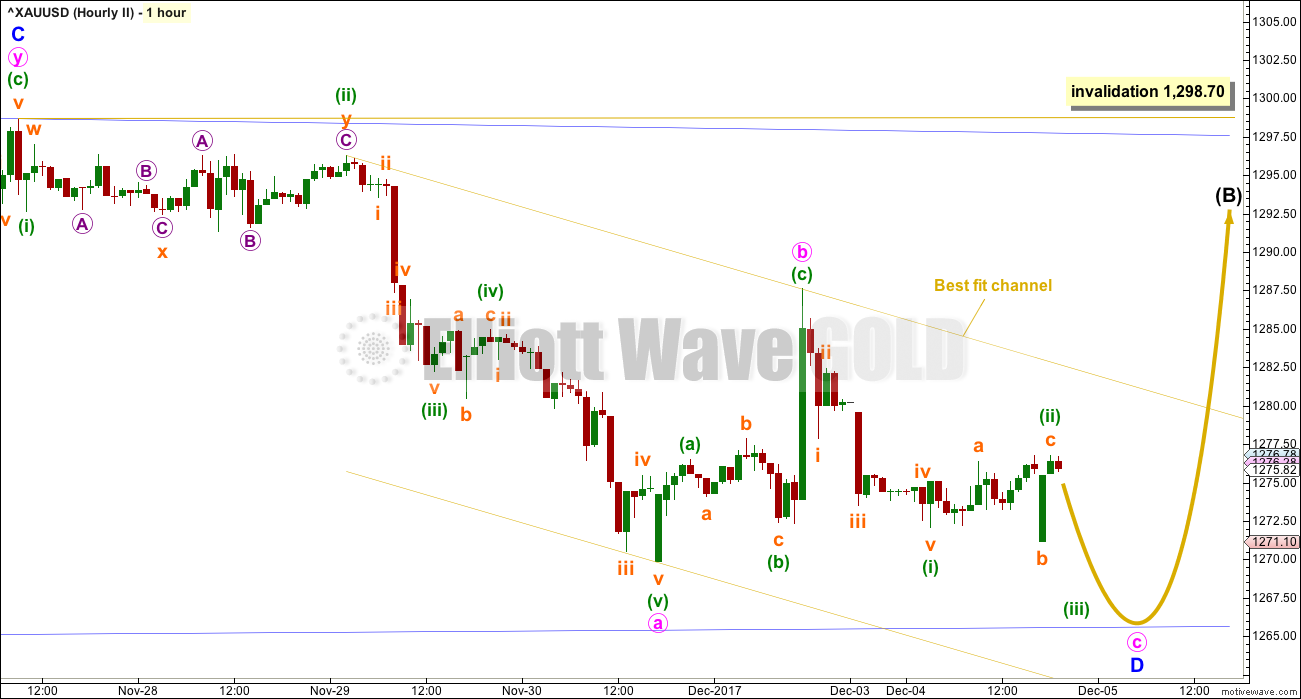
Click chart to enlarge.
Minor wave D may be continuing lower. Minute wave c may need further to go to complete as a five wave structure.
Alternatively, minute wave b may be continuing sideways, so minute wave c may not have yet started and may be relatively short and brief. Either way, the structure of a zigzag downwards for minor wave D now looks most likely to be incomplete.
When minor wave D is compete, then a final upwards swing for minor wave E may be expected.
Overall, this structure may continue sideways now for another one to three weeks.
However, we have been surprised before at a quicker than expected conclusion to an Elliott wave triangle. It is to counter this possibility that I am currently offering trading advice for members to be positioned prior to a breakout.
Only would the triangle be indicated as complete if price moves reasonably below 1,262.52.
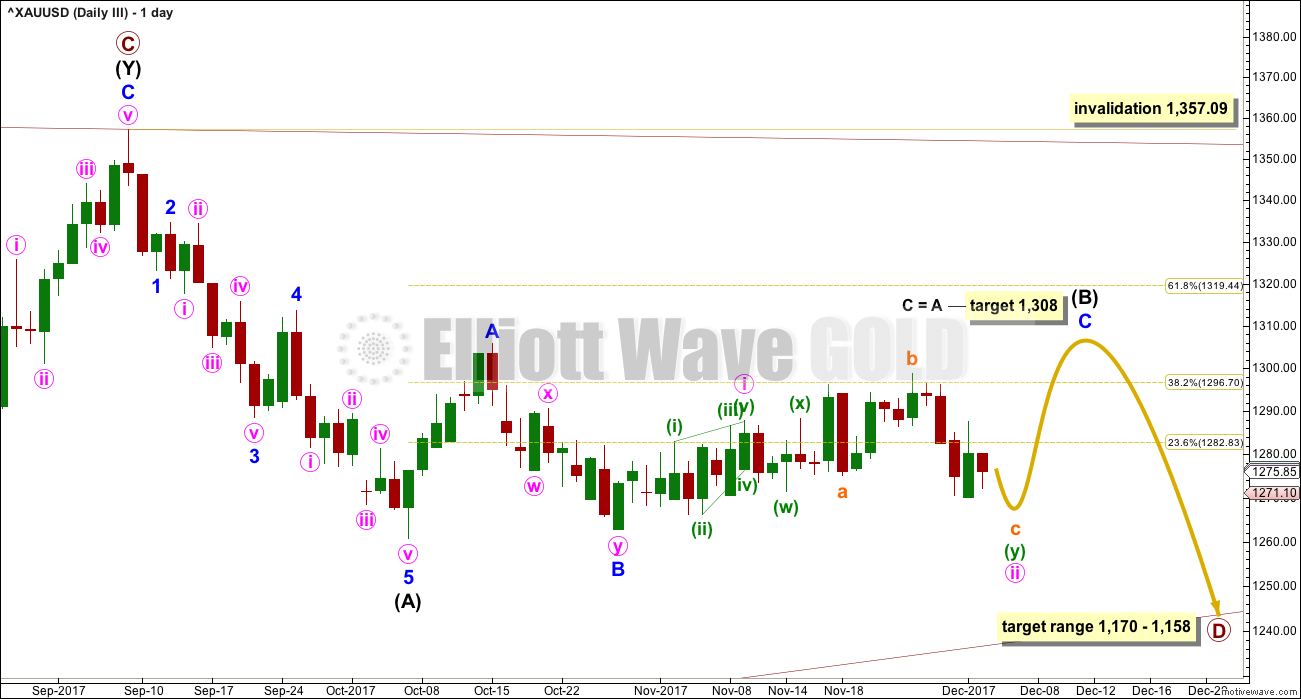
THIRD ELLIOTT WAVE COUNT
DAILY CHART
Click chart to enlarge.
At the weekly chart level, this third wave count is the same as the second wave count.
This third wave count looks at intermediate wave (B) as a zigzag or flat correction. Within intermediate wave (B), minor wave C would need further upwards movement for the structure to complete. The target at 1,308 remains the same.
Minor wave C must subdivide as a five wave structure. So far within it, minute waves i and ii may be complete.
Analysis of most recent movement is seen in the same way as for the first wave count.
At the hourly chart level, this third wave count sees subdivisions for most recent movement of the last few weeks in the same way as the first wave count. The degree of labelling would be one degree higher.
Because this third and the first wave count are the same at the hourly chart level, only one will be published at this time.
TECHNICAL ANALYSIS
WEEKLY CHART
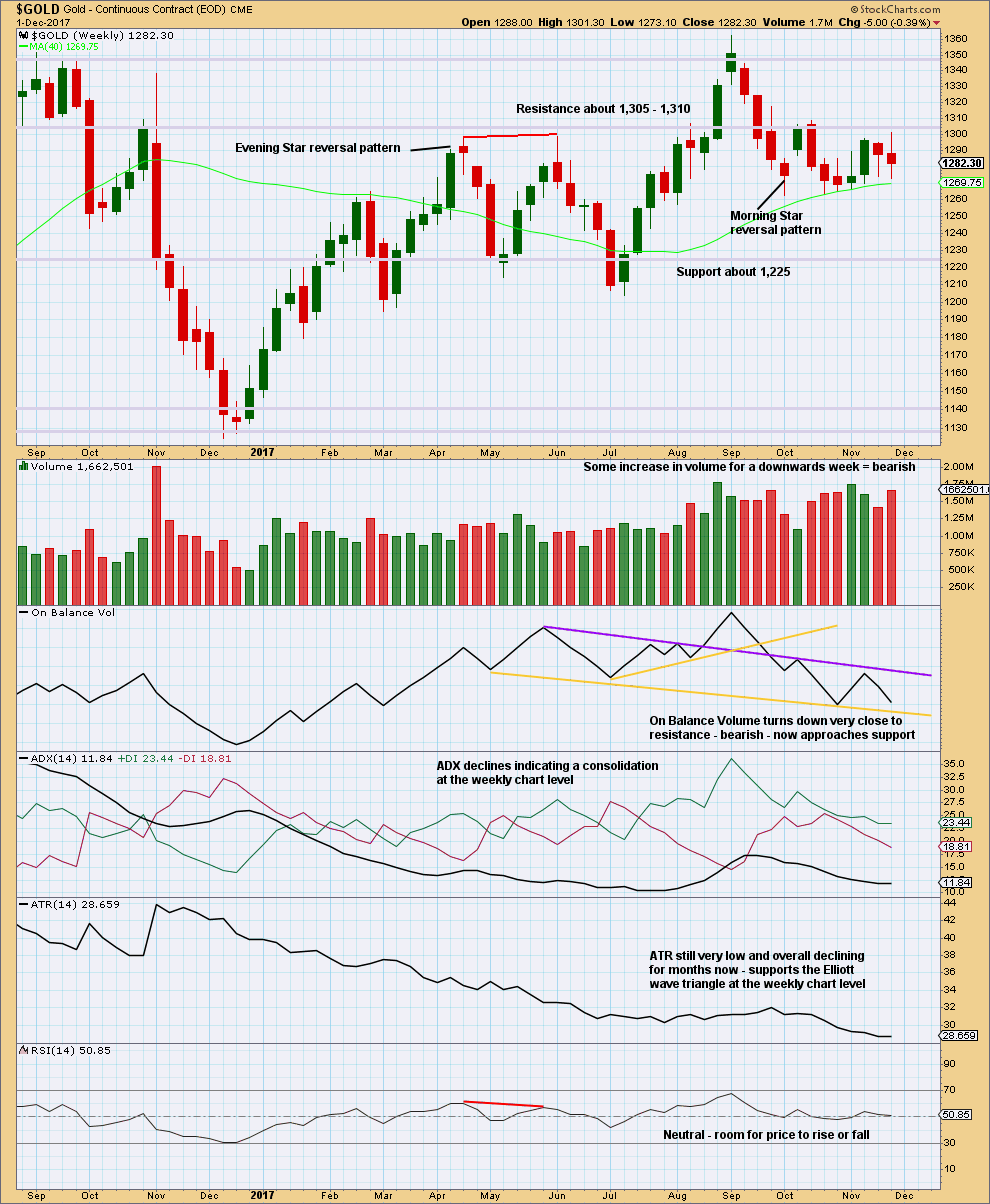
Click chart to enlarge. Chart courtesy of StockCharts.com.
On Balance Volume is still constrained. The last signal given was bearish.
DAILY CHART
Click chart to enlarge. Chart courtesy of StockCharts.com.
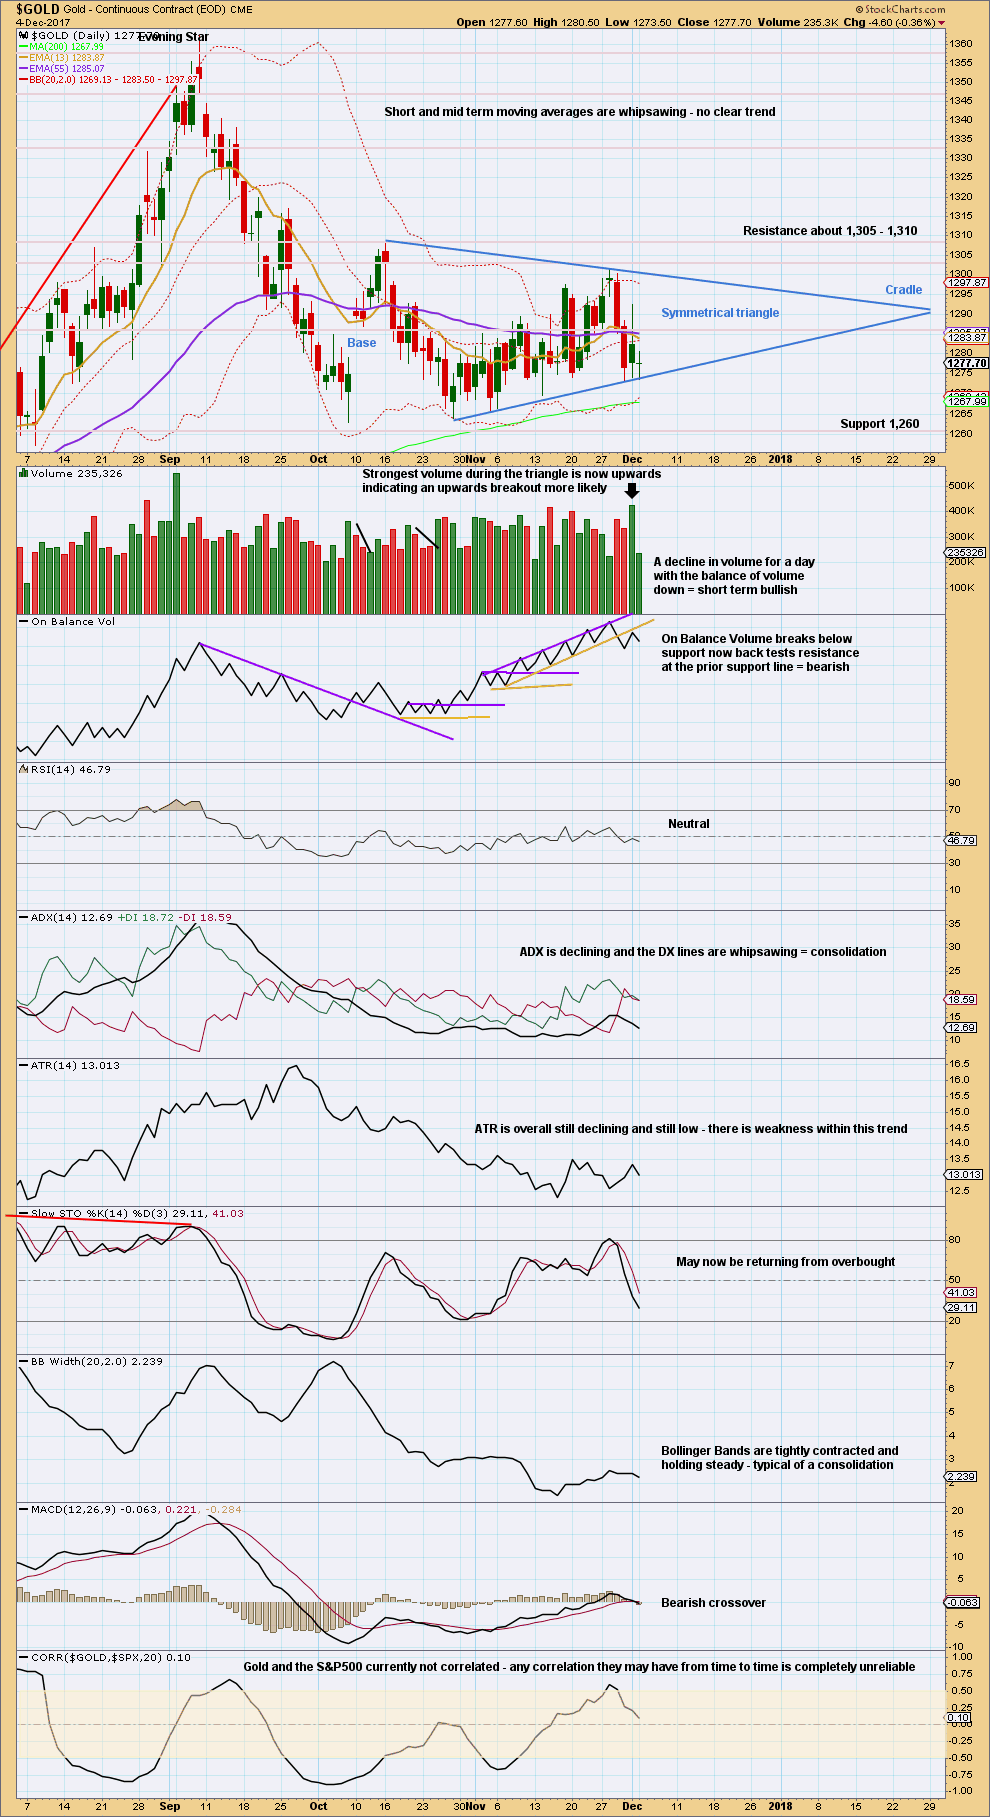
A classic symmetrical triangle looks now to be forming. Regarding triangles from Kirkpatrick and Dhalquist:
“The breakout is usually upward (54% of the time). Symmetrical triangles have many false breakouts and must be watched carefully. A trick breakout system must be used that allows for such false moves. The breakout commonly occurs between 73% and 75% of the length of the triangle from base to cradle.”
At this stage, that would mean another three weeks of sideways movement before a breakout.
“Throwbacks and pullbacks occur 37% to 59% of the time, respectively, and, as in most patterns, when they occur, they detract from eventual performance. This implies that for actual investement or trading, the initial breakout should be aced upon, and if a pullback or throwback occurs, the protective stop should be tightened. It does not imply that a pullback or throwback should be ignored, but that instead, performance expectations should be less than if no pullback or throwback had occurred.”
On trading triangles:
“The ideal situation for trading triangles is a definite breakout, a high trading range within the triangle, an upward-sloping volume trend during the formation of the triangle, and especially a gap on the breakout… An initial target for these patterns is calculated by adding the be distance – the vertical distance between the initial upper and lower reversal point prices – to the price where the breakout occurred.”
The strongest volume during the triangle is now for an upwards day for Friday. However, On Balance Volume contradicts this signal. On Balance Volume has given a bearish signal with a break below support and now a back test of resistance, which is bearish. I would give more weight to signals from On Balance Volume with its trend lines. I would still be expecting a downwards breakout from the triangle now.
GDX DAILY CHART
Click chart to enlarge. Chart courtesy of StockCharts.com.
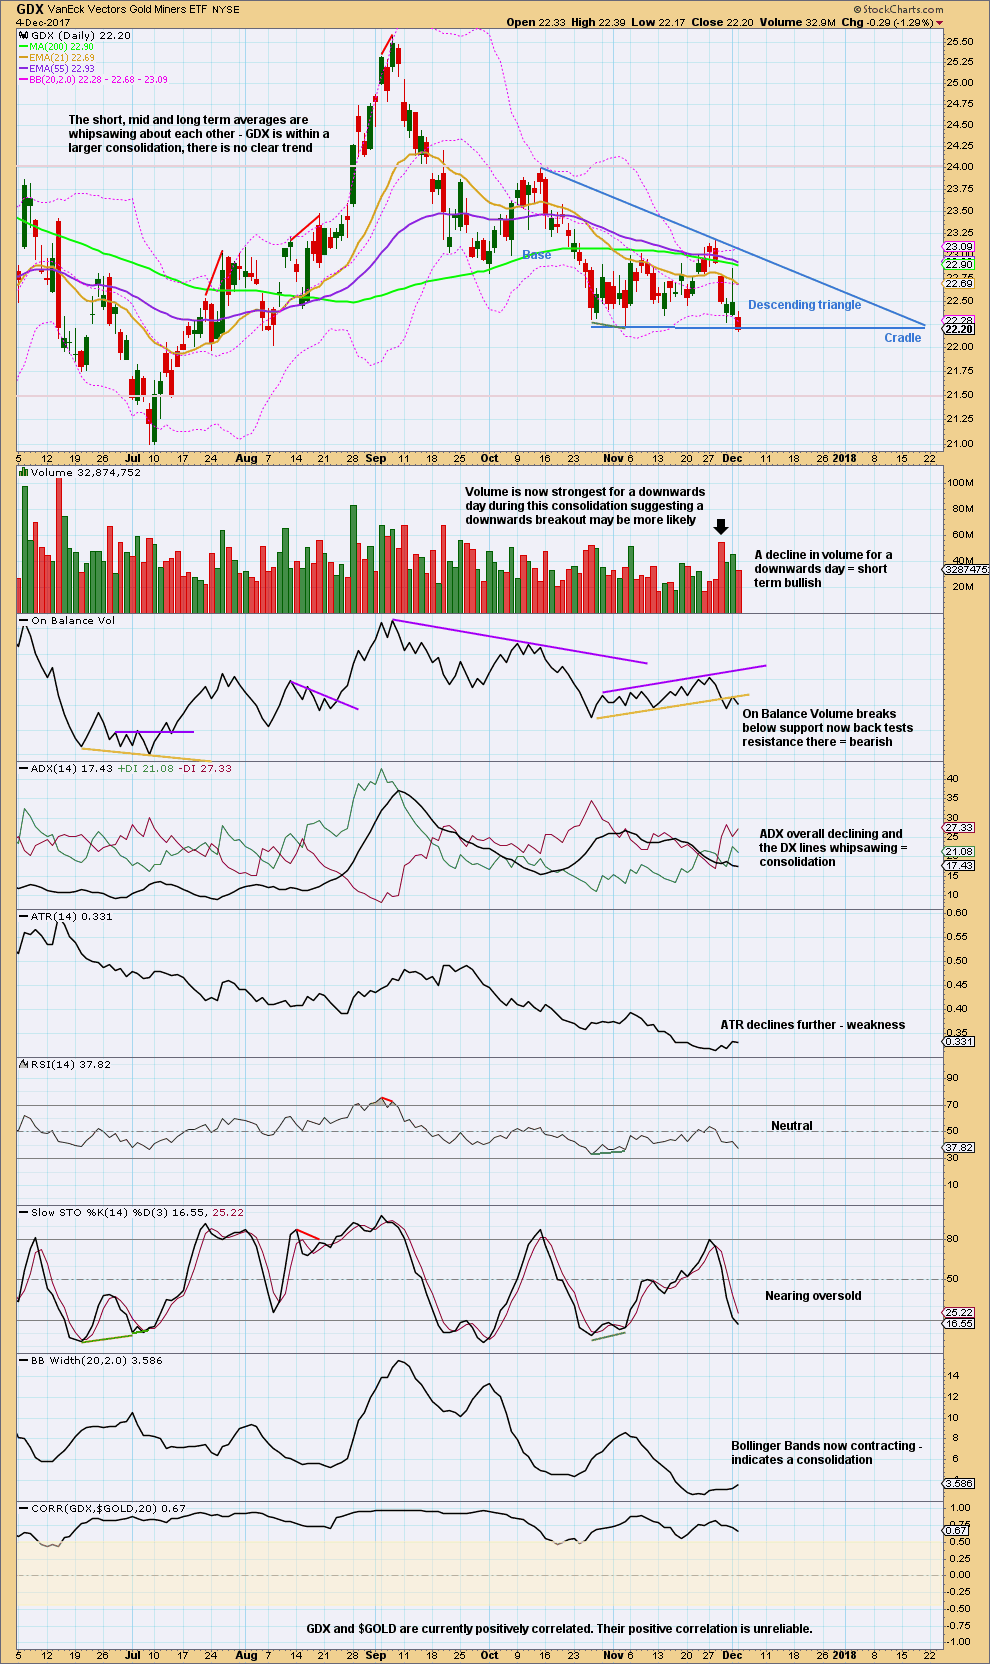
A descending triangle looks to be forming now for GDX. From Kirkpatrick and Dhalquist regarding descending triangles:
“The breakout is more common to the downside (65%), but the upward breakout is more reliable and profitable… This formation can be stretched high and wide and is sometimes difficult to recognise. The trend lines defining its boundaries are almost never exact and are loaded with false intra-bar breakouts. A strict breakout strategy is required… However, prices often explode out of it and produce sizeable gains. It can also be wild and guarantee an exciting ride. It will break out and run, break out and pull back to its trend line, break out and pull back to its cradle, or break back through the cradle, create a sizeable trap, and then reverse back in its original breakout direction and run. In other words, when you enter on a breakout from a descending triangle, the subsequent action must be watched carefully.”
Published @ 8:42 p.m. EST.
It appears that GDX and GDXJ will both close below their Bollinger Bands. Price is stretched to the downside. If the triangles I’ve been sharing are correct, they should be complete and we snap back within the bands tomorrow and start moving up. If they are wrong, then we continue down and they will be invalidated soon when price moves below wave C of the triangle.
agreed. today or tomorrow is the low.
I am discarding the first and third wave counts. They no longer make sense, they no longer fit.
I have three charts posted below.
I will now take a blank chart and try to find another idea or two…
Today’s analysis will include new ideas.
Please find us a bullish count 😀
Okay 🙂
I have one. It’s pretty bullish, but can’t see anything above 1,357.09.
Target 1,306.
Any members already short – hold on. If this keeps going a bit lower then the B-D trend line will no longer be “essentially flat” and the triangle would have to be considered over. If you hold a short position it may best be profitable if you hold on now for weeks.
It’s crunch time right now for the triangle. It has to turn up if it’s incomplete, if it keeps going down it was over on the 1st of December and this is Primary C down.
This could be happening:
Or this:
And so lets see how price behaves about todays low. If it turns up sharply then short positions may take profits for the short term, depending upon where your entry point was.
But if it keeps falling here then the triangle is complete and the target for profit should be 1,191 which may be weeks away.
Thanks Lara would you be able to cover btc aswell somepoint this week even for the weekend even?thanks
sure
adding it to the list, right after RUT which I’ve been meaning to get to for over a week now 🙁
Maybe I should ask Cesar to get me a round tuit for Christmas
then I can Get Around To It LOL
So I was disappointed by the weakness in miners today.
I thought that the bullish Barrier triangle was dead with a new low below 22.22 because that would mean that Triangle wave E would need to be a W-X-Y and I already had Triangle wave C labeled as a W-X-Y. As Lara would say, only one Triangle wave can be a multiple.
So after staring at the chart for awhile, I found the solution! Triangle wave C is not a multiple. It has a Triangle for a B wave. Problem solved.
Now as Lara showed on her GDX technical analysis chart, it looks like a descending triangle. I’m proposing that we get a little more down tomorrow before a reversal upwards. This will result in Triangle wave E being complete and also it will look like a “false” breakdown for the descending triangle.
21.96 is my target. Place stops below 20.99. The bull is not dead, yet…. Anyone with me? or are you all in the Bear camp?
https://www.tradingview.com/x/38TBhunf/
Dreamer,
I am in the bullish camp as well. I look at RSI, its bullish divergence, its refusal to slip into the negative territory in the weekly timeframe etc. This is with GDX as well as GDXJ.
With regards to only one wave being complex in a triangle. Prechter’s book says, that it is usually C, though B and D may alsodo the task. Does not mention E. However, Kennedy’s ebook mentions C, D or E might be complex. Does not include B. Which position is correct ??
Both should be good sources. I don’t think there is a rule or guideline that restricts which wave can be complex, although C is most common. EWP triangle rules are on page 90.
thank you Dreamer.
Well done Dreamer!
I used to have that problem, I’d wake up and see price had done what I did not expect and spend time staring at charts thinking…. what on earth?!?!
But now… it’s so much easier.
And you’re getting there too now. Isn’t it fun when you figure out the solution?
Very nicely done Dreamer. Very nicely done.
Yes, EW can be frustrating and rewarding and everything in between! 😩🤔😀
I will add though….
Price is not respecting the A-C trend line for wave E.
Now, while E can end with an overshoot of the A-C trend line when it does that it just does not tend to look like this. It will do it for a day or so, then quickly reverse. Not meander like that.
I don’t think that’s the correct wave count Dreamer. IME.
Lara,
Looks like the Daily Chart for your FIRST count is incorrectly showing the Daily chart for the SECOND count. Thanks,
So sorry everybody, thanks for pointing that out Dreamer. Both Cesar and I missed that.
Fixed now 🙂