
Upwards movement was expected for the last week. This is what has happened.
Volume analysis indicates the probability of the Elliott wave counts has shifted for Silver.
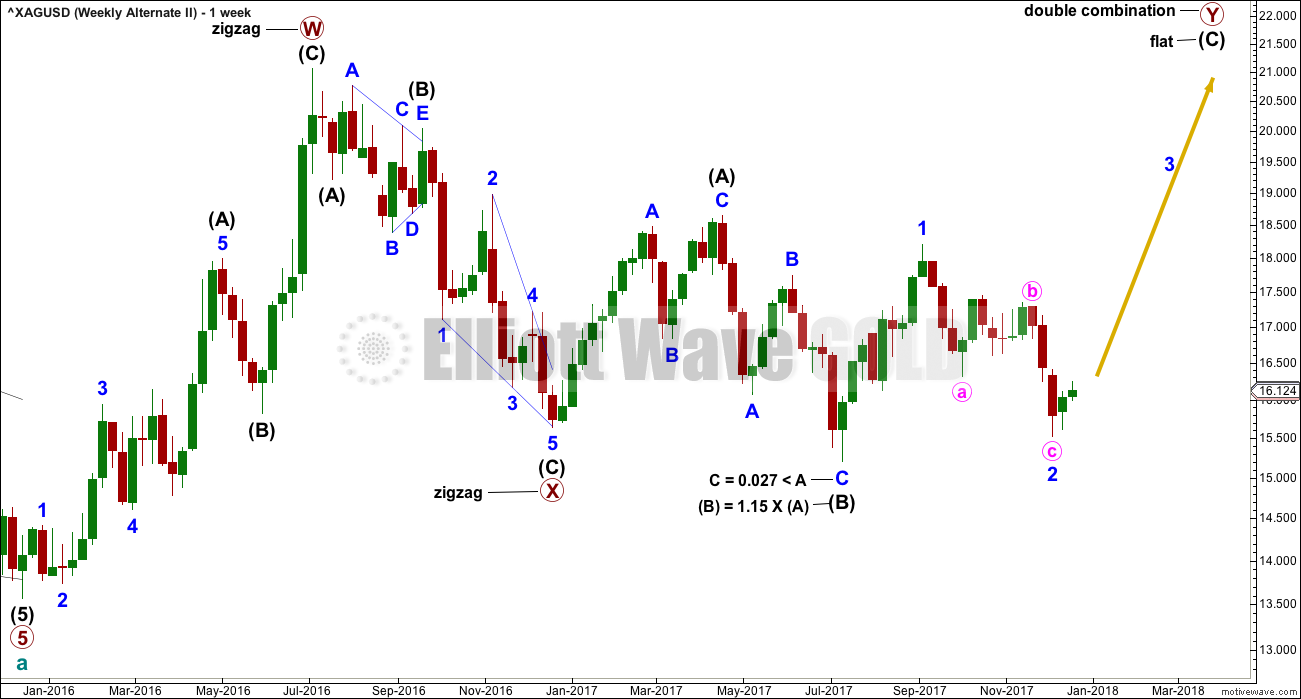
Summary: Upwards movement may end here or very soon. Expect downwards movement now to about 15.403.
Always trade with stops and invest only 1-5% of equity on any one trade.
New updates to this analysis are in bold.
Last monthly chart is here.
The Elliott wave counts are presented this week in order of probability.
ELLIOTT WAVE COUNTS
MAIN WAVE COUNT
WEEKLY CHART
Click chart to enlarge.
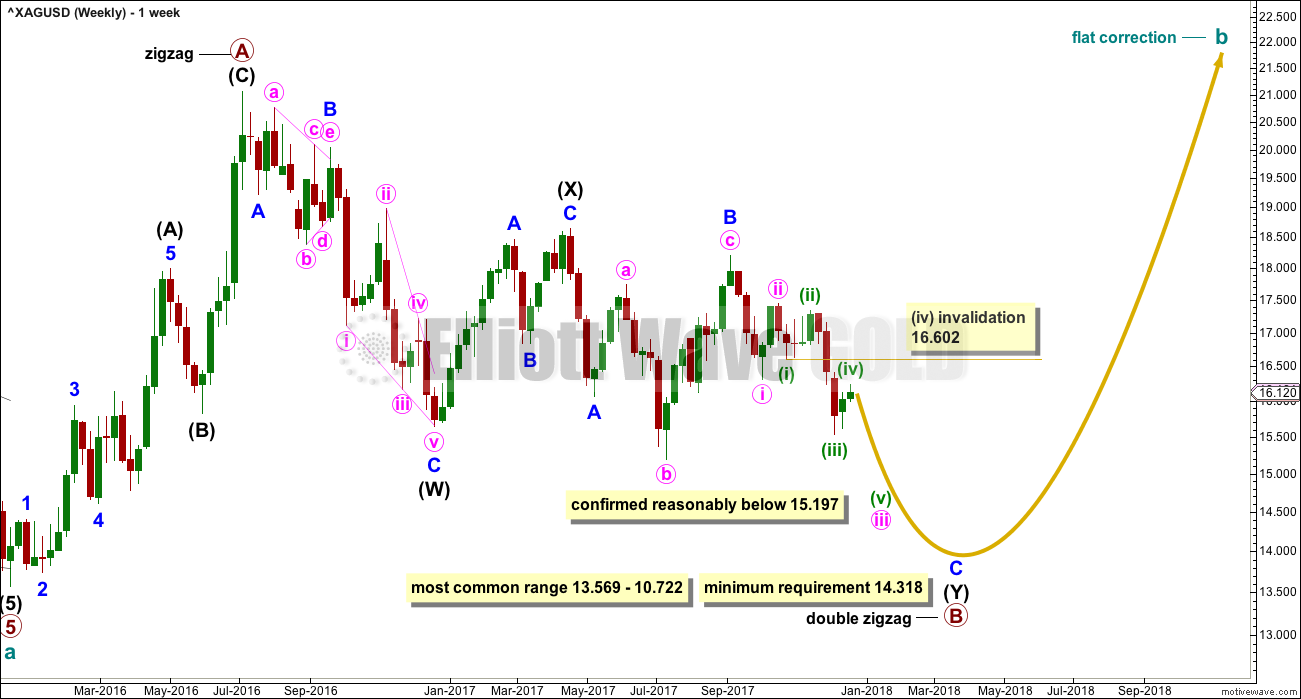
This was last week’s second alternate wave count. This week’s volume suggests it should be the main wave count.
It is possible that cycle wave b may be unfolding as a flat correction. Within a flat, both primary waves A and B must be three wave structures. A double zigzag is classified as a three.
Within the flat correction, primary wave B must retrace a minimum 0.9 length of primary wave A. Primary wave B may make a new price extreme beyond the start of primary wave A below 13.569, as in an expanded flat. Expanded flats are the most common type of flat correction.
If the first two wave counts are invalidated by a new low reasonably below 15.197, then only this third wave count would remain. It would then require more downwards movement overall to at least 14.318, and it would be likely that price could make a new low below 13.569.
DAILY CHART
Click chart to enlarge.
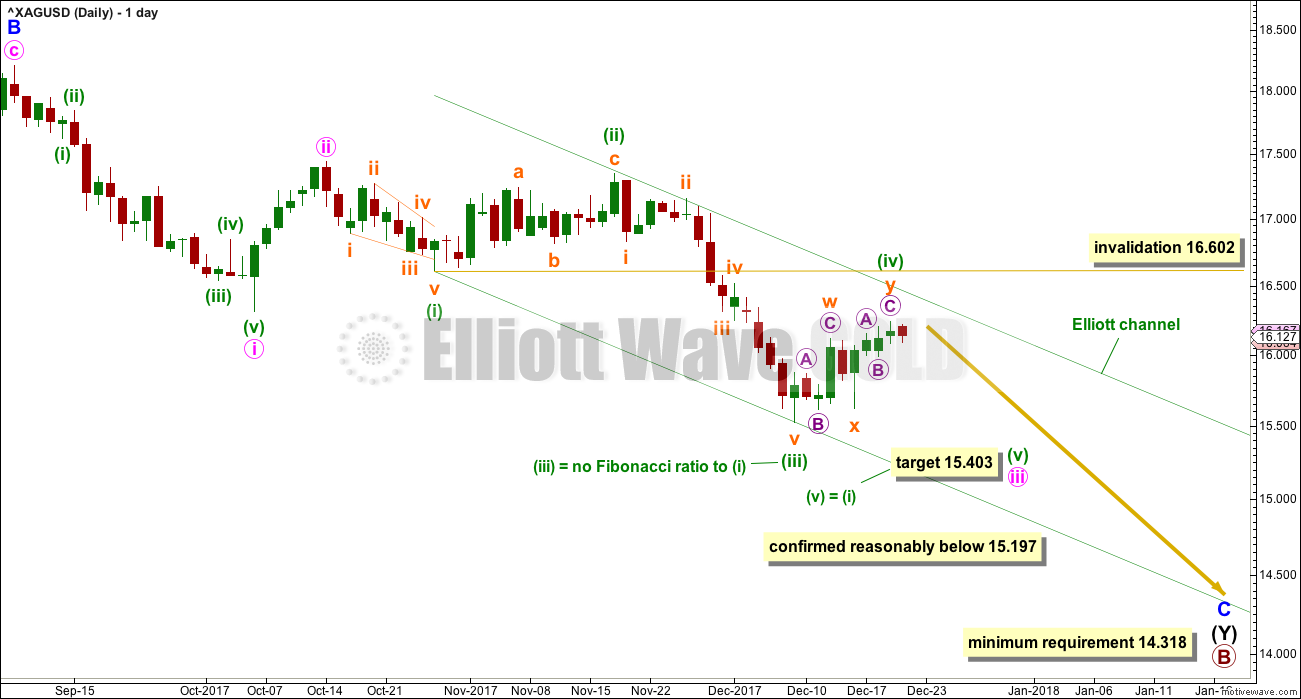
An impulse may be unfolding lower. While price remains below 16.602, and if it continues to exhibit weakness in upwards movement, then this should now be the main wave count.
Because minuette wave (iii) does not exhibit a Fiboancci ratio to minuette wave (i), it would be more likely that minuette wave (v) would exhibit a Fibonacci ratio to either of (i) or (iii), and equality in length with minuette wave (i) is the most common Fibonacci ratio.
The green Elliott channel has a perfect fit so far. If minuette wave (iv) continues any higher, expect it may find resistance at the upper edge of the channel.
Minuette wave (iv) may not move into minuette wave (i) price territory above 16.602.
FIRST ALTERNATE WAVE COUNT
WEEKLY CHART
Click chart to enlarge.
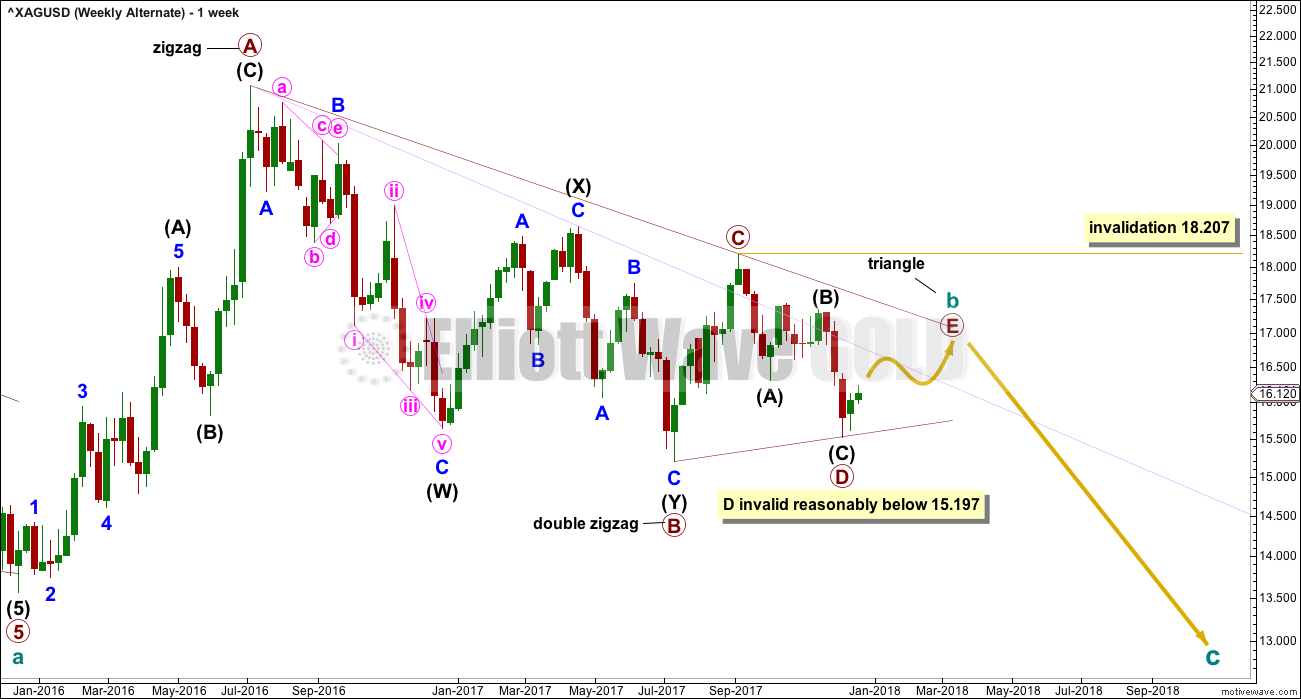
It remains possible for Silver that a large regular contracting triangle may be completing.
Within a triangle, one of the sub-waves must be a more complicated multiple, usually a multiple zigzag. This may be complete for primary wave B.
The triangle may now need only the final sub-wave of primary wave E upwards to complete it. Primary wave E would most likely fall reasonably short of the A-C trend line.
Primary wave E may not move beyond the end of primary wave C above 18.207.
DAILY CHART
Click chart to enlarge.
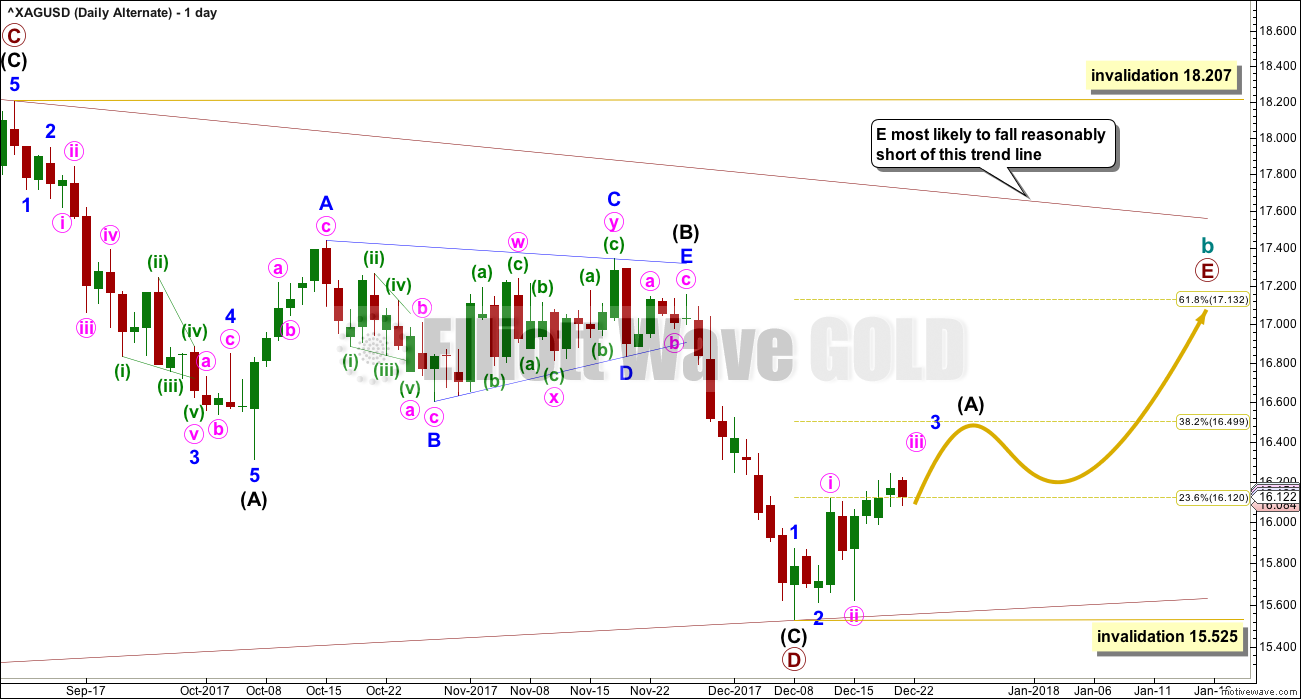
Primary wave D now looks like a completed zigzag. There is no reasonable Fibonacci ratio between intermediate waves (A) and (C) within it.
Primary wave E may end about the 0.618 Fibonacci ratio of primary wave D, at about 17.132. Primary wave E should be an obvious three wave structure, and intermediate wave (B) within it may be complicated and time consuming.
Within the zigzag of primary wave E, intermediate wave (B) may not move beyond the start of intermediate wave (A) below 15.525.
At this stage, upwards movement of the last nine days does not have strength nor range, does not look like a new wave up at primary degree, and does not subdivide well as an impulse or leading diagonal, the only two structures possible for intermediate wave (A).
If price makes a new high above 16.602, then some confidence may be had in this alternate wave count. But until then, with weakness in upwards movement, this now looks less likely.
SECOND ALTERNATE WAVE COUNT
WEEKLY CHART
Click chart to enlarge.
Cycle wave b may be completing as a double combination: zigzag – X – flat. The second structure, a flat correction for primary wave Y, may be underway.
Within a flat correction, intermediate wave (B) must retrace a minimum 0.9 length of intermediate wave (A) at 15.938. Intermediate wave (B) has met this minimum requirement; the rule for a flat correction is met. Intermediate wave (B) is longer than 1.05 times the length of intermediate wave (A) indicating this may be an expanded flat. Expanded flat corrections are the most common type. Normally their C waves are 1.618 or 2.618 the length of their A waves.
The target calculated would see primary wave Y to end close to same level as primary wave W about 21.062. The purpose of combinations is to take up time and move price sideways. To achieve this purpose the second structure in the double normally ends about the same level as the first.
While the combination wave count at the weekly chart level does not currently work for Gold, it does still work for Silver. They do not have to complete the same structures for cycle wave b, and fairly often their structures are different.
At this stage, the duration of minor wave 2 now looks wrong. This wave count is now less likely.
TECHNICAL ANALYSIS
WEEKLY CHART
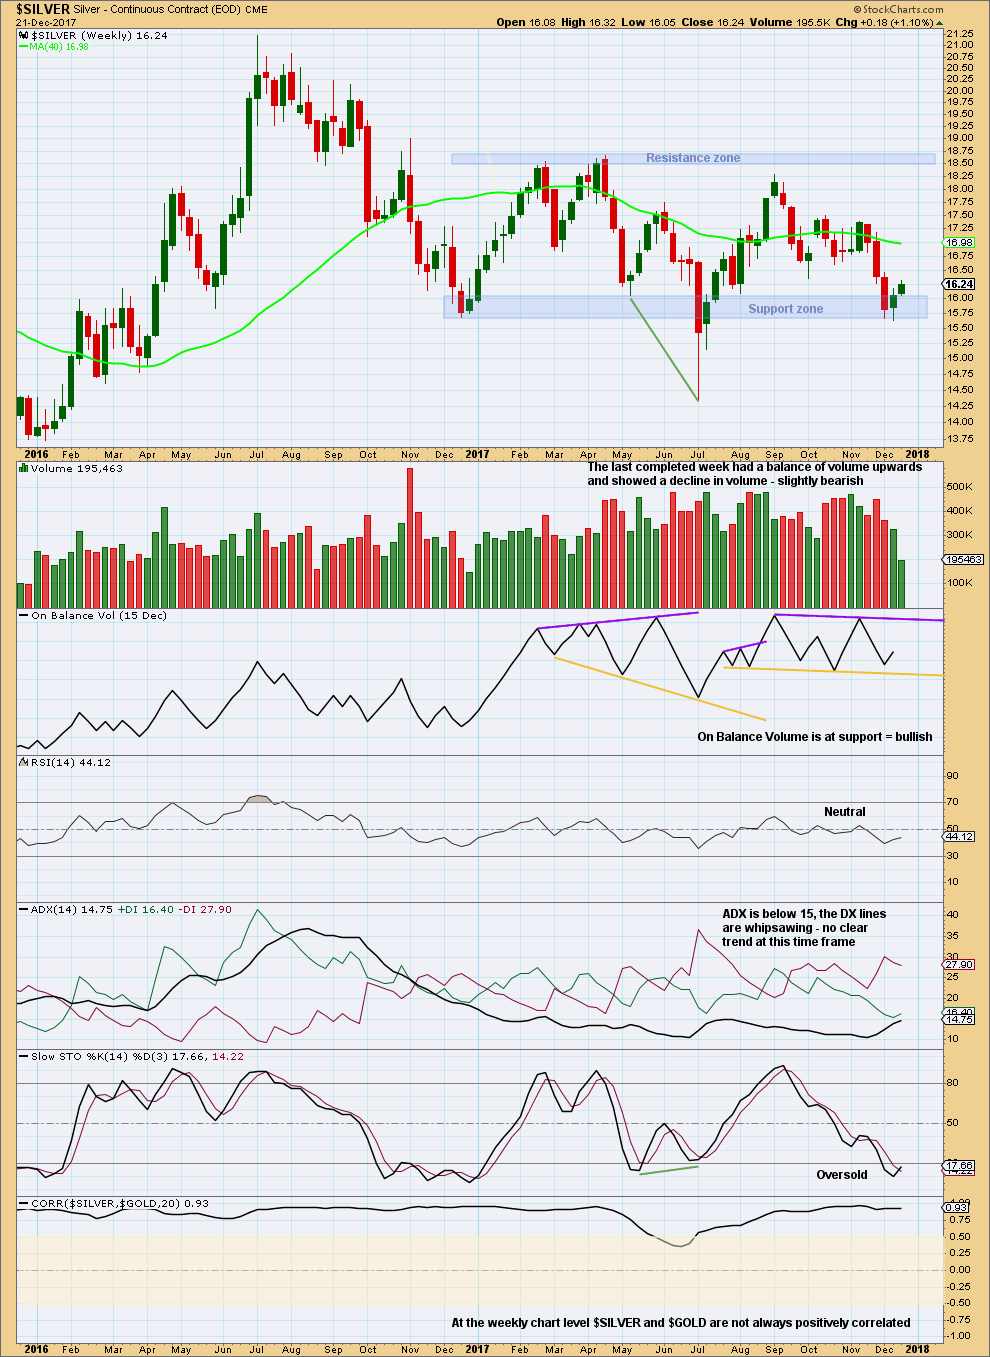
Click chart to enlarge. Chart courtesy of StockCharts.com.
There is strong support here for price about 16.05 to 15.65. Silver has been consolidating now for several months.
With price at support and Stochastics oversold, a swing trading system used during consolidations would now expect an upwards swing from here.
DAILY CHART
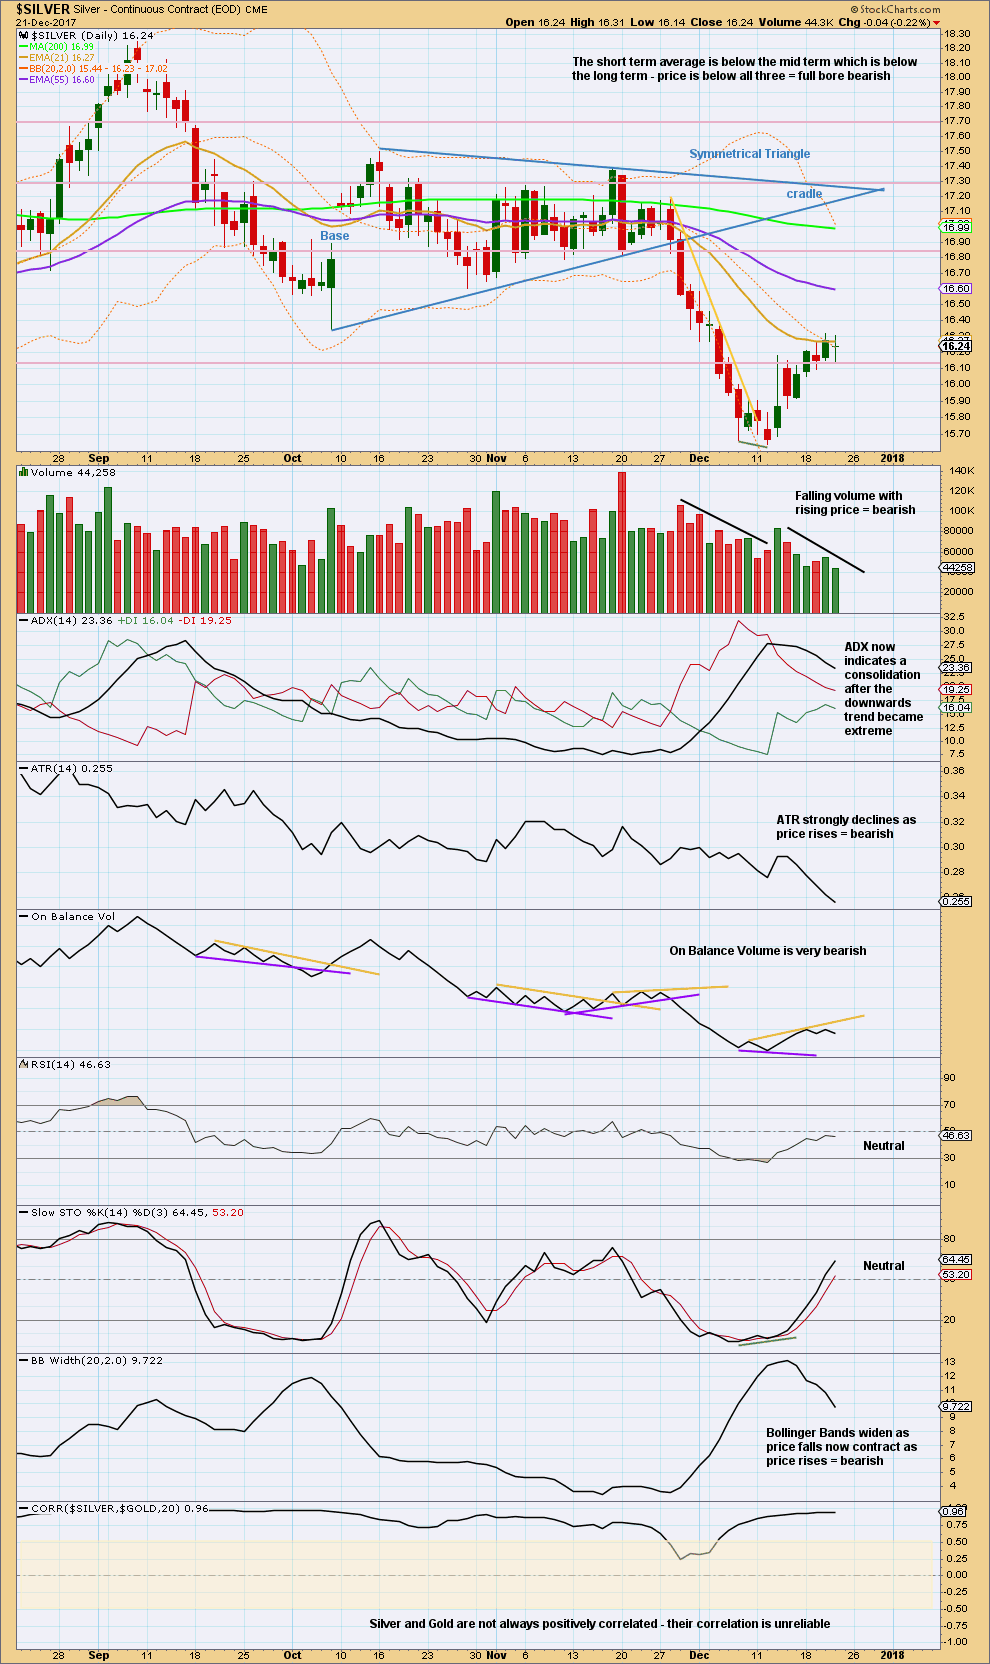
Click chart to enlarge. Chart courtesy of StockCharts.com.
Upwards movement of the last several days comes with declining volume and strongly declining ATR. Each day bulls are less active but able to push price up overall by smaller and smaller amounts. This looks less like a reasonable and sustainable rise in price and more like a counter trend movement for Silver.
Published @ 10:40 p.m. EST.