
Another sideways week remains within the Elliott channel and above the invalidation point.
Summary: The target has been recalculated. Now the target for upwards movement to end is 59.65 to 61.42.
There has been some weakness, and that continues, and indicators are extreme; look out for this upwards trend to end soon.
A new low below 55.82 would be an early indication of a possible trend change to down.
New updates to this analysis are in bold.
MONTHLY ELLIOTT WAVE COUNT
Click chart to enlarge.
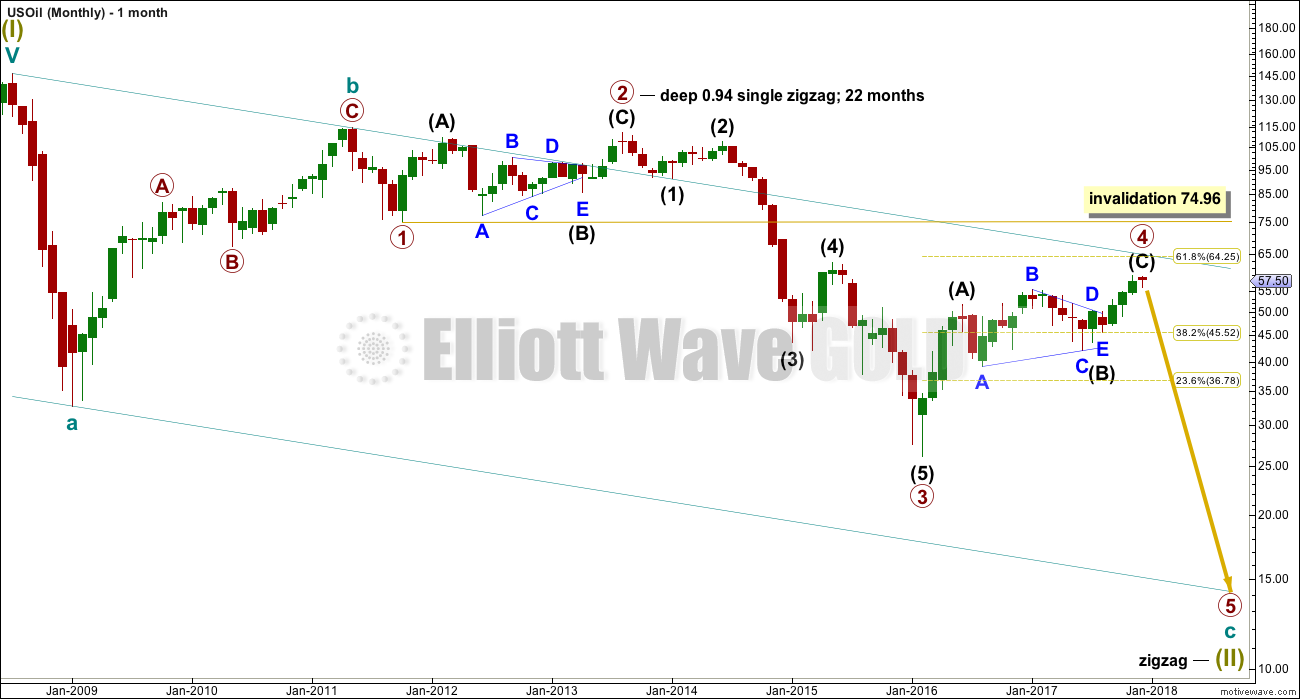
Within the bear market, cycle wave b is seen as ending in May 2011. Thereafter, a five wave structure downwards for cycle wave c begins.
Primary wave 1 is a short impulse lasting five months. Primary wave 2 is a very deep 0.94 zigzag lasting 22 months. Primary wave 3 is a complete impulse with no Fibonacci ratio to primary wave 1. It lasted 30 months.
There is alternation in depth with primary wave 2 very deep and primary wave 4 relatively shallow. There is inadequate alternation in structure, both are zigzags. So far primary wave 4 has lasted 21 months. So far there is good proportion between primary waves 2 and 4.
Primary wave 4 may not move into primary wave 1 price territory above 74.96.
WEEKLY ELLIOTT WAVE COUNT
Click chart to enlarge.
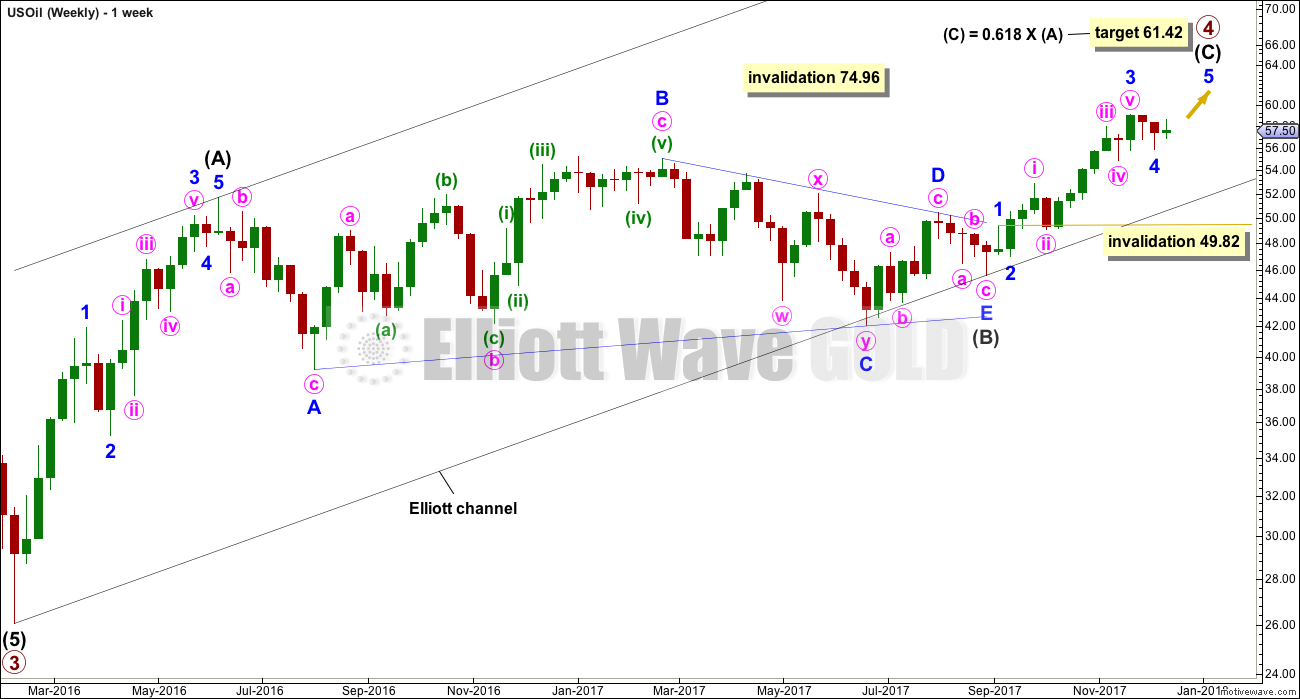
Intermediate wave (C) must subdivide as a five wave structure, either an impulse or an ending diagonal. Within intermediate wave (C), minor waves 1 through to 3 may now be complete. Minor wave 4 may or may not be complete. It may not move into minor wave 1 price territory below 49.82.
When intermediate wave (C) may again be seen as complete, then a trend change would be expected and a target for primary wave 5 downwards would be calculated. At this stage, for this wave count, a target cannot be calculated for it to end because the start of primary wave 5 is not known.
An Elliott channel is added to this possible zigzag for primary wave 4. A breach of the lower edge of this channel would provide a very strong indication that primary wave 4 should be over and primary wave 5 should be underway.
DAILY ELLIOTT WAVE COUNT
Click chart to enlarge.
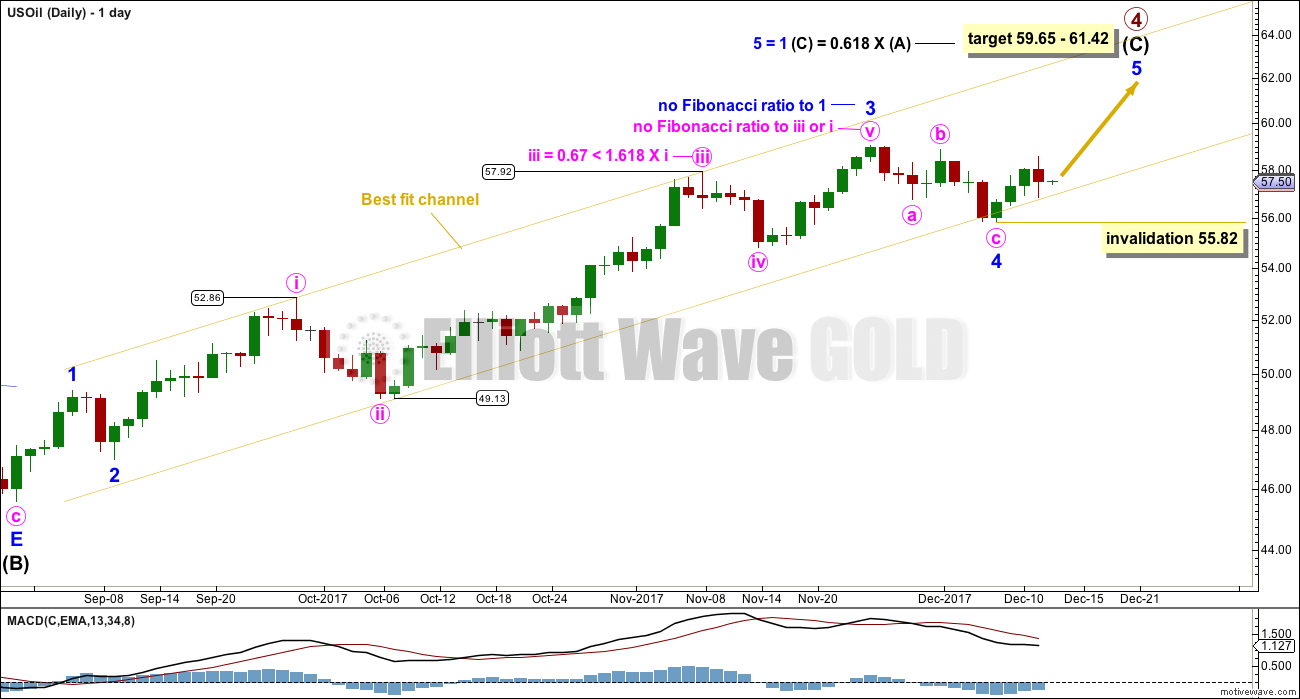
Intermediate wave (C) must complete as a five wave structure. For this wave count, it looks like a possible impulse.
The structure within intermediate wave (C) is this week reanalysed. This has overall a better look with the current sideways movement.
Price points are given for the best fit channel, so that members may replicate it. Assume the upwards trend remains intact while price remains within this channel. If price breaks below the channel, it may be an early indication of a trend change.
TECHNICAL ANALYSIS
DAILY CHART
Click chart to enlarge. Chart courtesy of StockCharts.com.
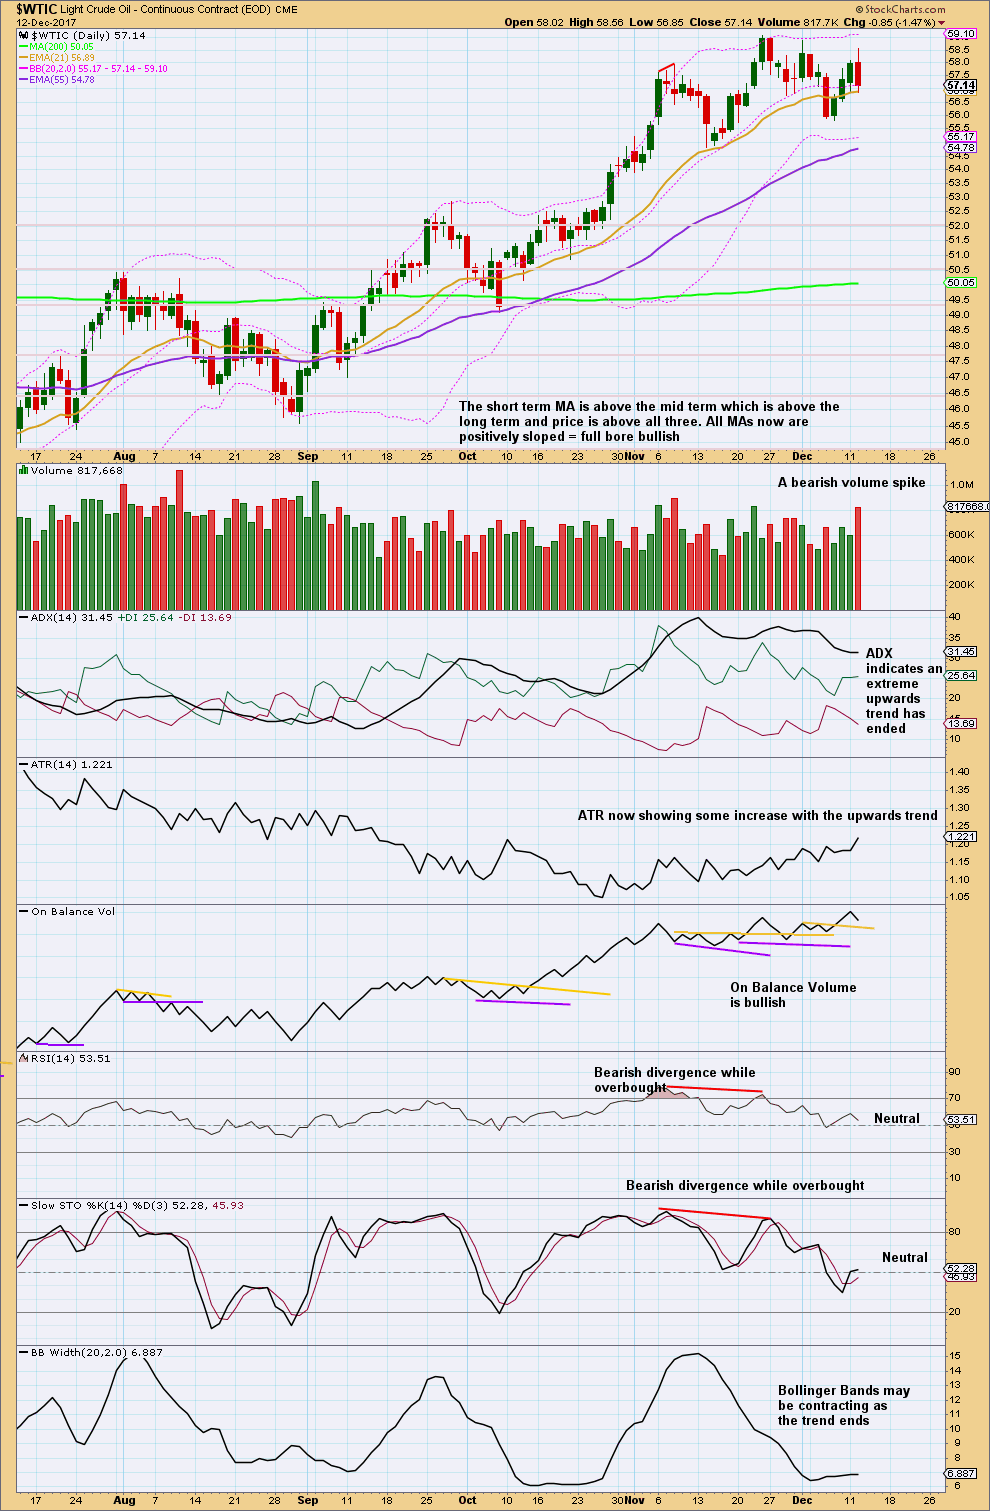
With ADX previously extreme, and now declining, an end to the upwards trend is indicated. This is still supported by RSI and Stochastics.
A bearish volume spike for the last session may be followed by some downwards movement.
VOLATILITY INDEX
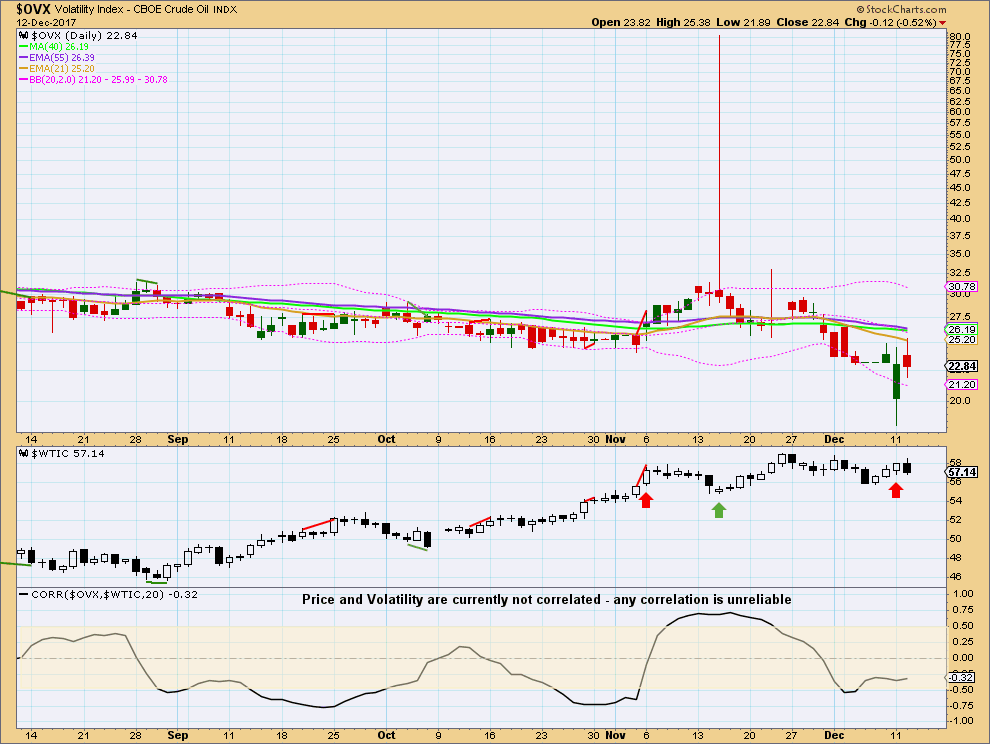
Click chart to enlarge. Chart courtesy of StockCharts.com.
There is some short term bearish divergence, as noted on this chart: volatility made a new low on the 11th of December, but price did not make a normal corresponding new high. This indicates weakness within price and is bearish.
Published @ 01:45 a.m. EST.
Hi Lara,
are you able to do a once off AUDUSD and perhaps the USDJPY medium to long term analysis as i feel they are heavily correlated and inversely correlated to precious metals which would help with the gold as well.
cheers