
Another sideways week sees a classic symmetrical triangle forming. Volume analysis is used to indicate the most likely breakout direction, and the triangle is used to calculate a target.
Summary: The target for upwards movement to end is 61.42.
There has been some weakness, and that continues, and indicators are extreme; look out for this upwards trend to end soon.
A new low below 55.82 would be an early indication of a possible trend change to down.
New updates to this analysis are in bold.
MONTHLY ELLIOTT WAVE COUNT
Click chart to enlarge.
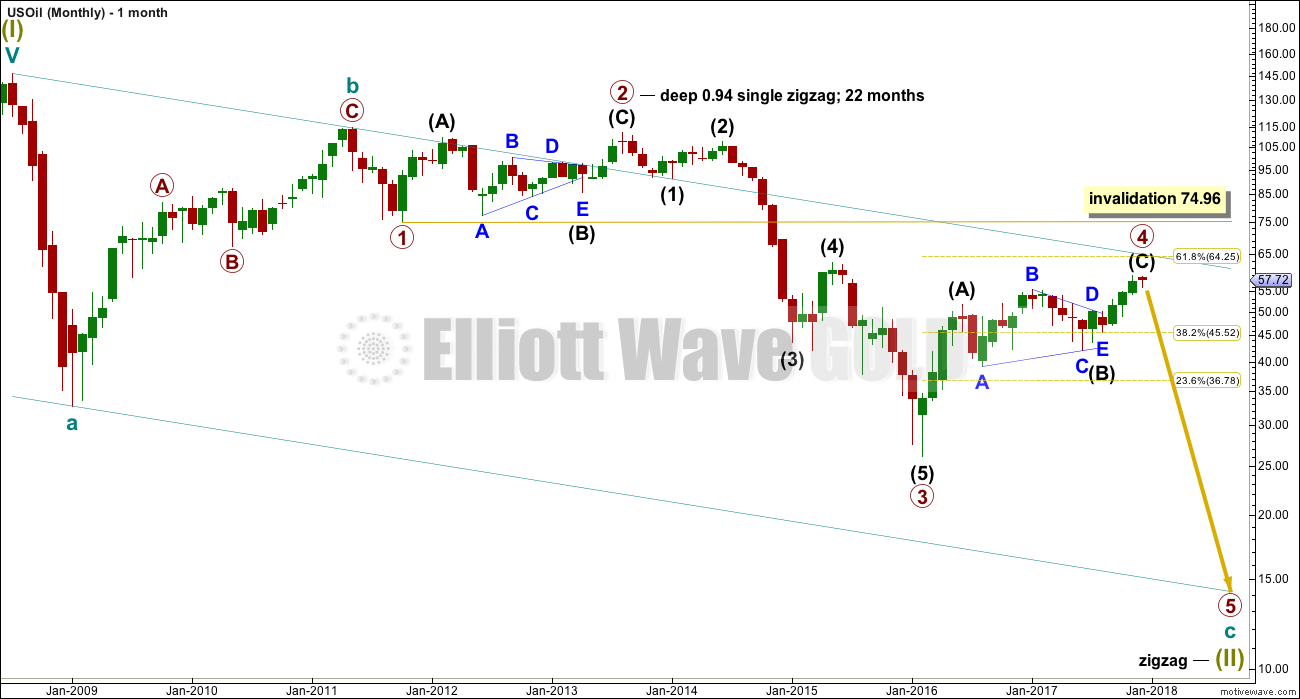
Within the bear market, cycle wave b is seen as ending in May 2011. Thereafter, a five wave structure downwards for cycle wave c begins.
Primary wave 1 is a short impulse lasting five months. Primary wave 2 is a very deep 0.94 zigzag lasting 22 months. Primary wave 3 is a complete impulse with no Fibonacci ratio to primary wave 1. It lasted 30 months.
There is alternation in depth with primary wave 2 very deep and primary wave 4 relatively shallow. There is inadequate alternation in structure, both are zigzags. So far primary wave 4 has lasted 22 months. At this stage, there is perfect proportion between primary waves 2 and 4.
Primary wave 4 may not move into primary wave 1 price territory above 74.96.
WEEKLY ELLIOTT WAVE COUNT
Click chart to enlarge.
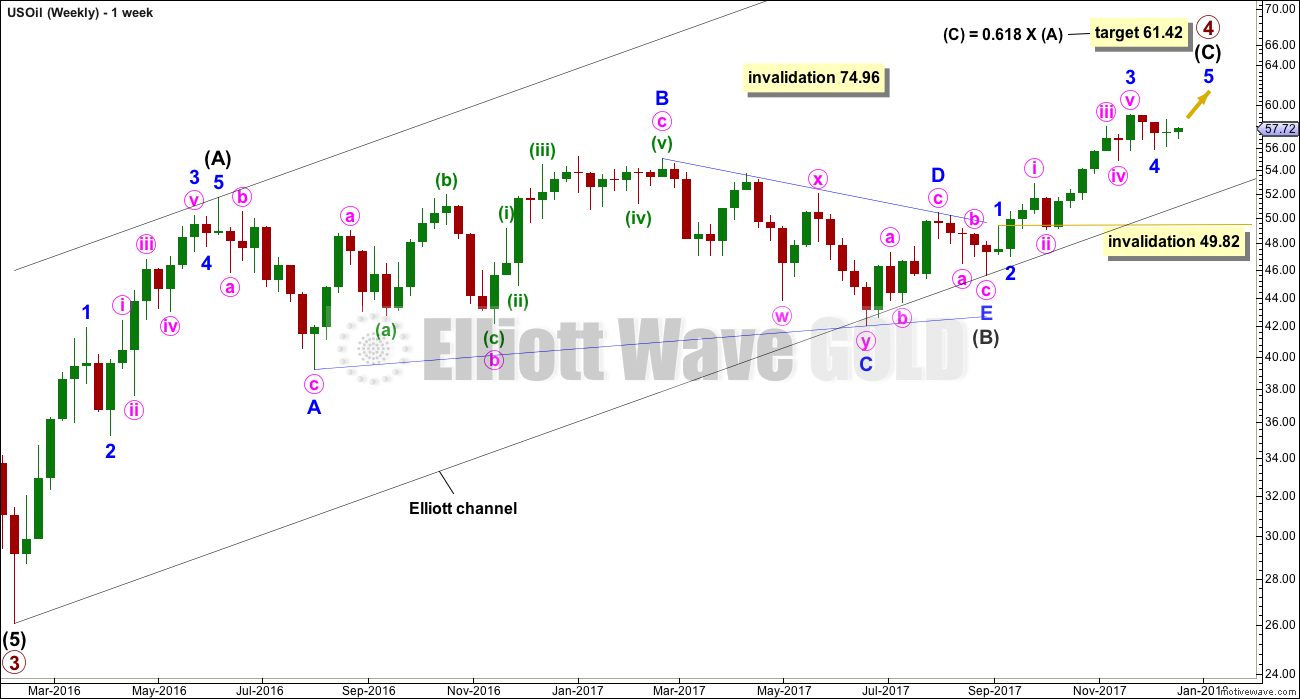
Intermediate wave (C) must subdivide as a five wave structure, either an impulse or an ending diagonal. Within intermediate wave (C), minor waves 1 through to 3 may now be complete. Minor wave 4 may or may not be complete. It may not move into minor wave 1 price territory below 49.82.
When intermediate wave (C) may again be seen as complete, then a trend change would be expected and a target for primary wave 5 downwards would be calculated. At this stage, for this wave count, a target cannot be calculated for it to end because the start of primary wave 5 is not known.
An Elliott channel is added to this possible zigzag for primary wave 4. A breach of the lower edge of this channel would provide a very strong indication that primary wave 4 should be over and primary wave 5 should be underway.
DAILY ELLIOTT WAVE COUNT
Click chart to enlarge.
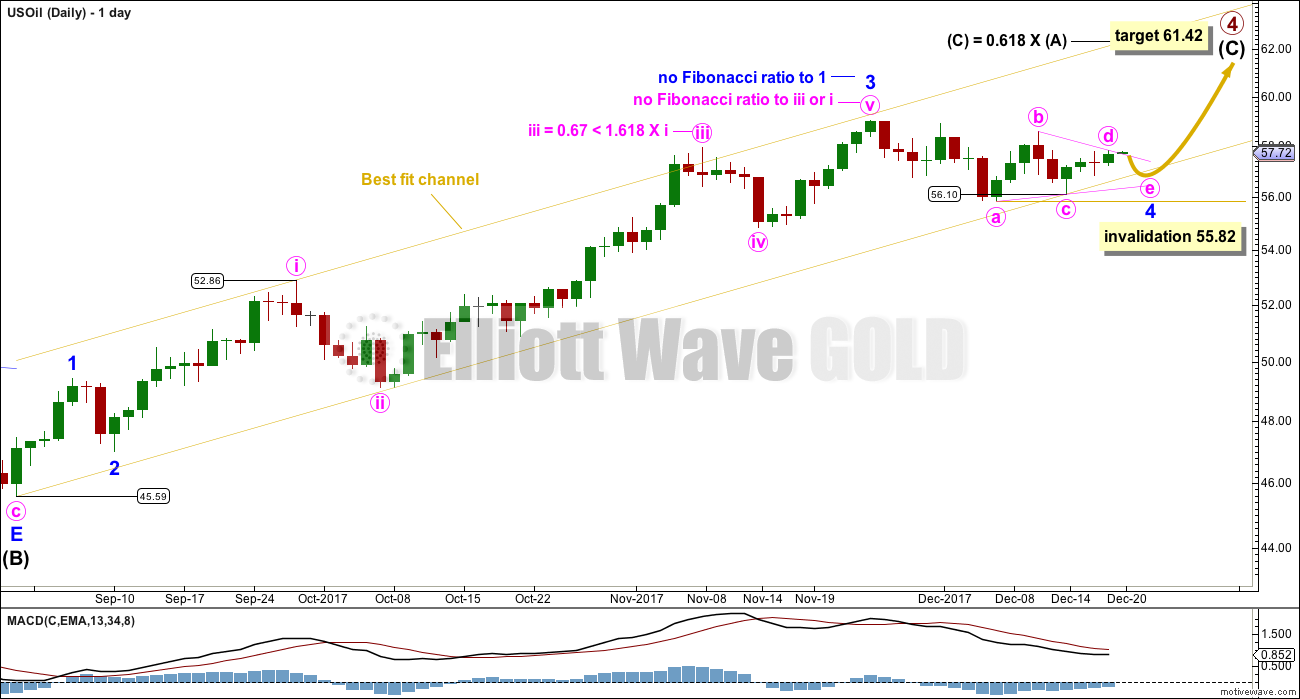
Intermediate wave (C) must complete as a five wave structure. For this wave count, it looks like a possible impulse.
Sideways movement of the last two weeks now looks like a regular contracting Elliott wave triangle. This may be minor wave 4.
Within the triangle, if minute wave c is not over and continues further, it may not move beyond the end of minute wave a below 55.82.
When the triangle is complete, then minute wave 5 may unfold upwards. It would be very likely to make at least a slight new high above the end of minor wave 3 at 59.04 to avoid a truncation.
The best fit channel is slightly adjusted; price points are given for anchors, so that members may replicate the channel on daily charts. Assume the trend is up while price remains within this channel. If the channel is breached by clear downwards movement (not sideways), then assume there has been a trend change and primary wave 4 may be over.
TECHNICAL ANALYSIS
DAILY CHART
Click chart to enlarge. Chart courtesy of StockCharts.com.
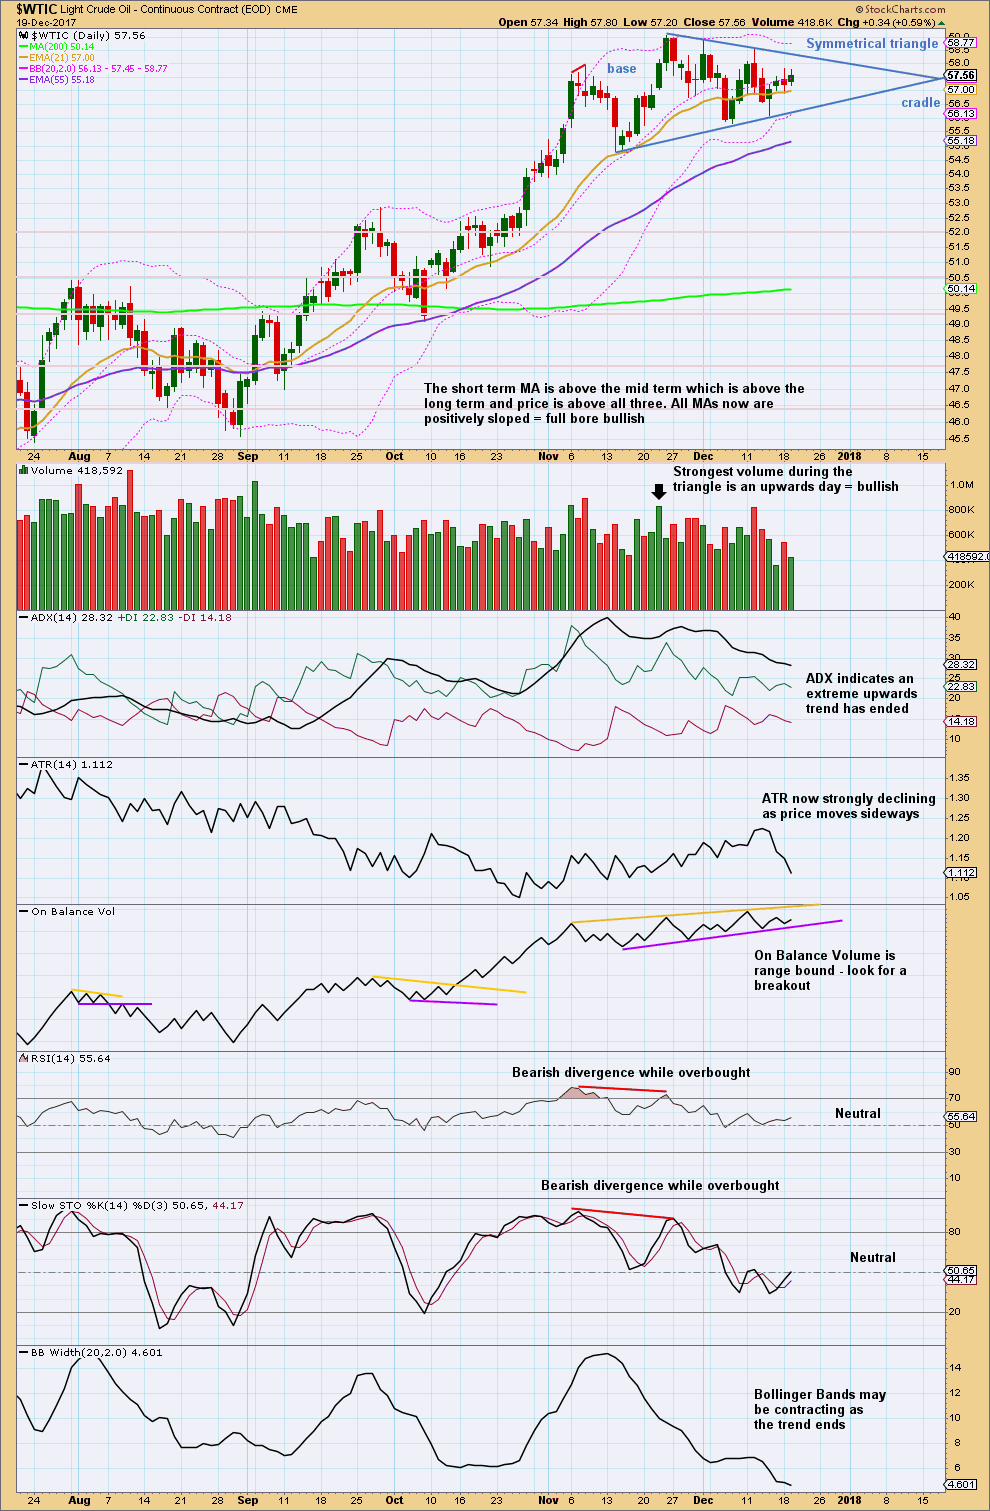
A classic symmetrical triangle looks like it is forming. Breakouts from symmetrical triangles are usually upwards (54% of the time), and in this instance that prediction is supported by volume.
Breakouts commonly occur from 73% to 75% of the length of the triangle from base to cradle. In this instance, that would be in about another nine trading sessions from today.
The breakout, if it is upwards, should have support from volume for confidence. A downwards breakout does not need support from volume; but if it does, then more confidence may be had in it.
Pullbacks after an upwards breakout occur 59% of the time. Throwbacks after a downwards breakout occur 37% of the time. The breakout should be acted on. If a throwback or pullback does occur, stops should be tightened.
VOLATILITY INDEX
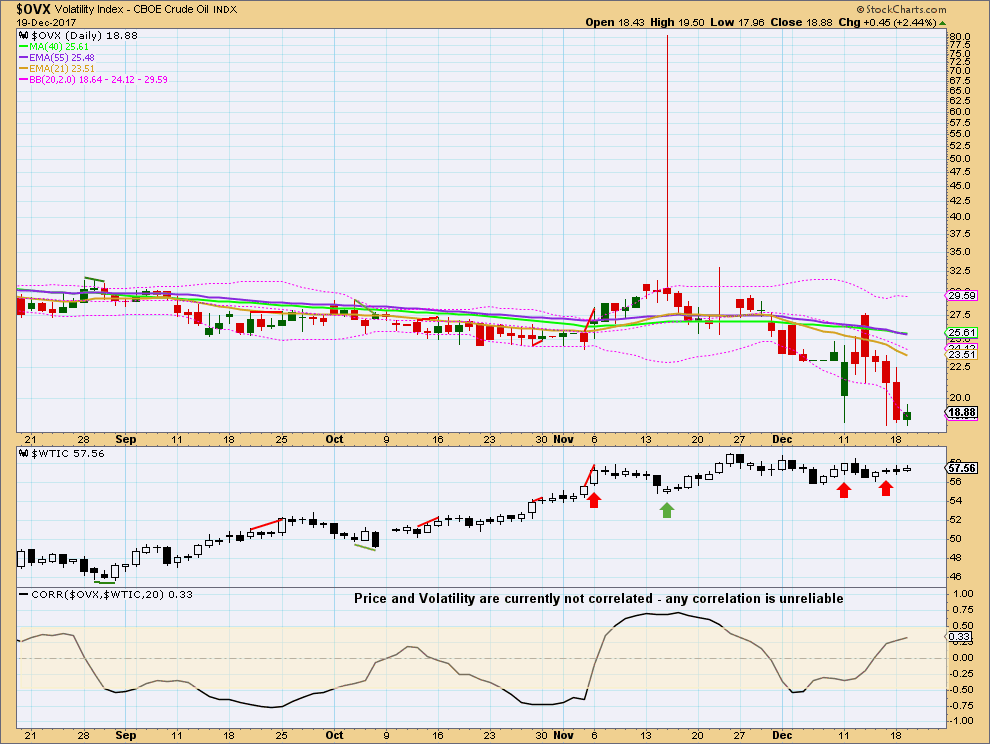
Click chart to enlarge. Chart courtesy of StockCharts.com.
There is again short term bearish divergence, as noted on this chart: volatility made a new low on the 15th of December, but price did not make a normal corresponding new high. This indicates weakness within price and is bearish.
Published @ 09:36 p.m. EST.
I just LOVE triangles….! 🙂 🙂 🙂
Thanks Lara!
You’re welcome 🙂
Me too. They’re relatively predictable…. makes for a nice high probability low risk set up