
Again, price has moved lower as the main wave count expected it to. A breach of the channel adds a little confidence, but the confidence price point has not yet been passed. Alternates should still be considered.
Summary: The main wave count expects a trend change to a new bear market to last one to several years, and the target is 470. However, a new low below 1,324.93 is required for confidence in this view. Today, a little confidence may be had in this main wave count as the channel about prior upwards movement has now been breached.
A new alternate expects overall upwards movement from here. It would be confirmed if price makes a new high reasonably above 1,357.09.
New updates to this analysis are in bold.
Last historic analysis with monthly charts is here. Video is here.
Grand SuperCycle analysis is here.
MAIN ELLIOTT WAVE COUNT
WEEKLY CHART
Click chart to enlarge.
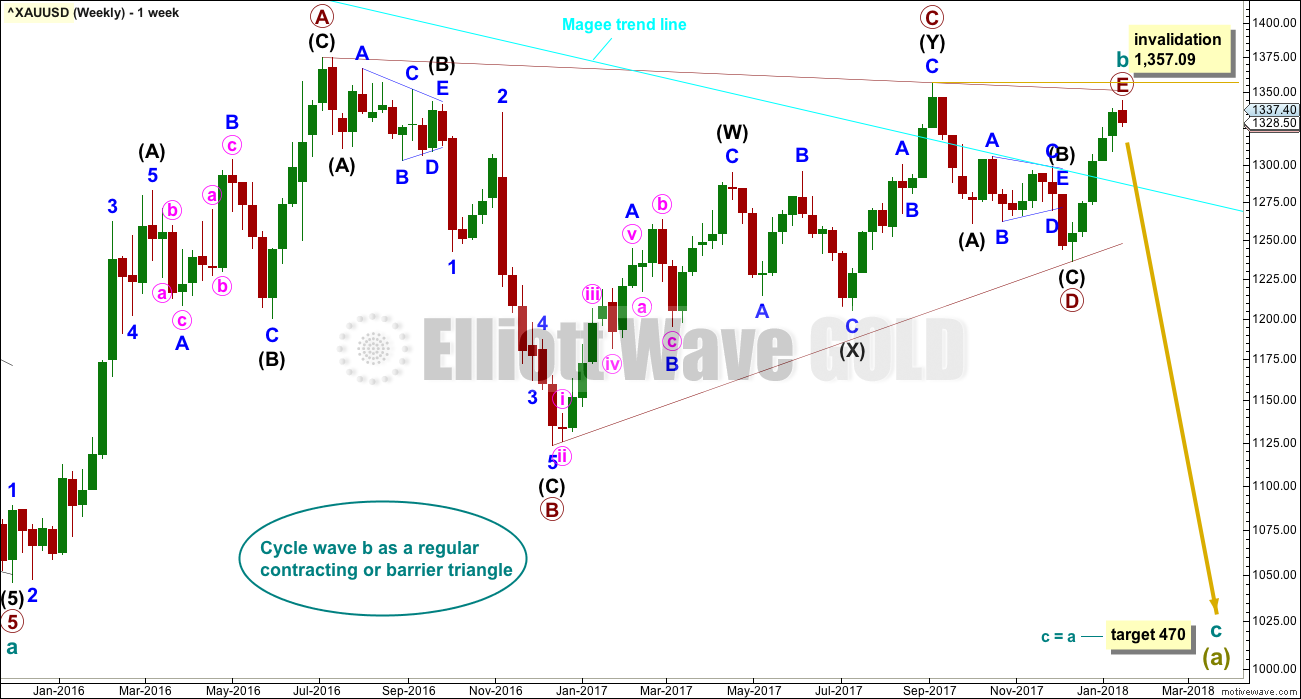
All main wave counts expect that Gold completed a large five down from the all time high in November 2011 to the low of December 2015, which is seen on the left hand side of weekly charts.
If this analysis is correct, then the five down may not be the completion of the correction. Corrective waves do not subdivide as fives; they subdivide as threes. The five down is seen as cycle wave a within Super Cycle wave (a).
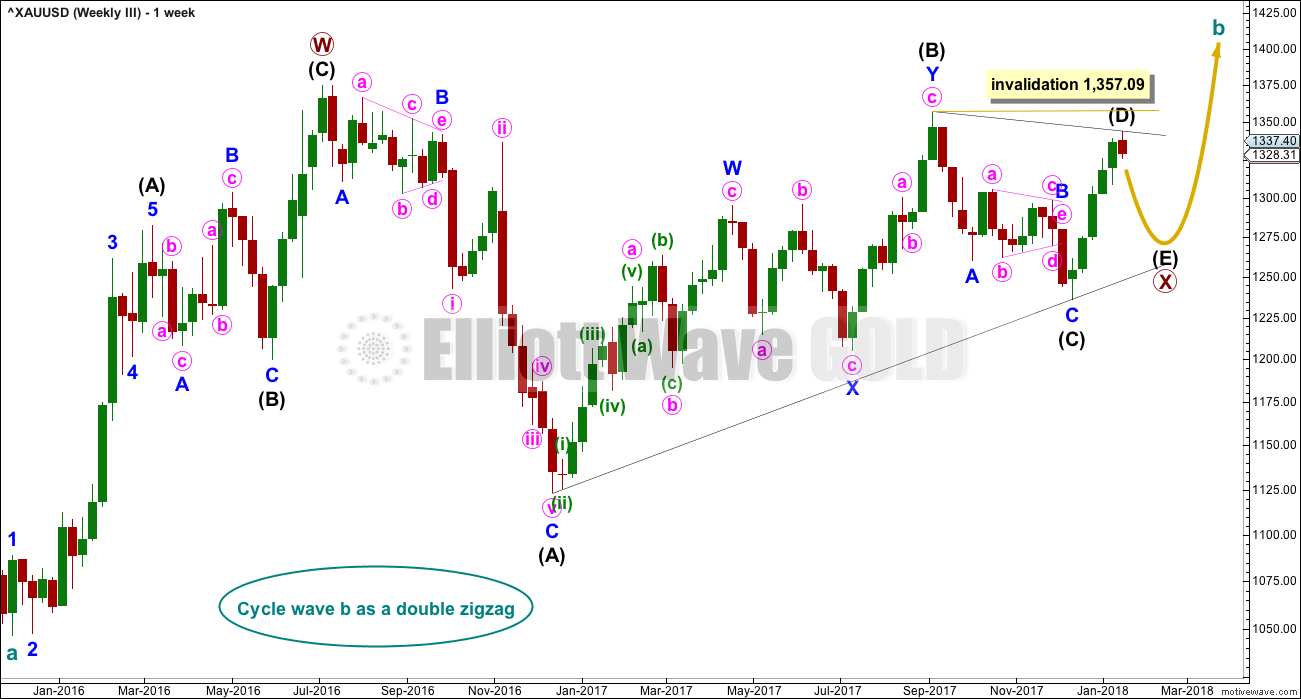
Cycle wave b began in December 2015.
It looks unlikely that cycle wave b may have been over at the high labelled primary wave A. Primary wave A lasted less than one year at only 31 weeks. Cycle waves should last one to several years and B waves tend to be more time consuming than other Elliott waves, so this movement would be too brief for cycle wave b.
This wave count looks at cycle wave b to be most likely a regular contracting triangle.
All sub-waves must subdivide as threes within an Elliott wave triangle, and four of the five sub-waves must be zigzags or multiple zigzags, and the most common sub-wave to be a multiple is wave C. Only one sub-wave may be a more complicated multiple. This triangle meets all these rules and guidelines; all subdivisions fit perfectly at all time frames. It is the main wave count for these reasons, and thus is judged to have the highest probability.
The triangle trend lines have a normal looking convergence. Primary wave D now looks fairly likely to be complete, and it looks like an obvious three wave structure at the weekly chart level.
While primary wave E should also most likely look like an obvious three wave structure at the weekly and daily chart levels, it does not have to do this. It is possible that primary wave E could be over, falling reasonably short of the A-C trend line and being relatively quick. E waves of triangles can often be the quickest of all triangle waves.
DAILY CHART

Click chart to enlarge.
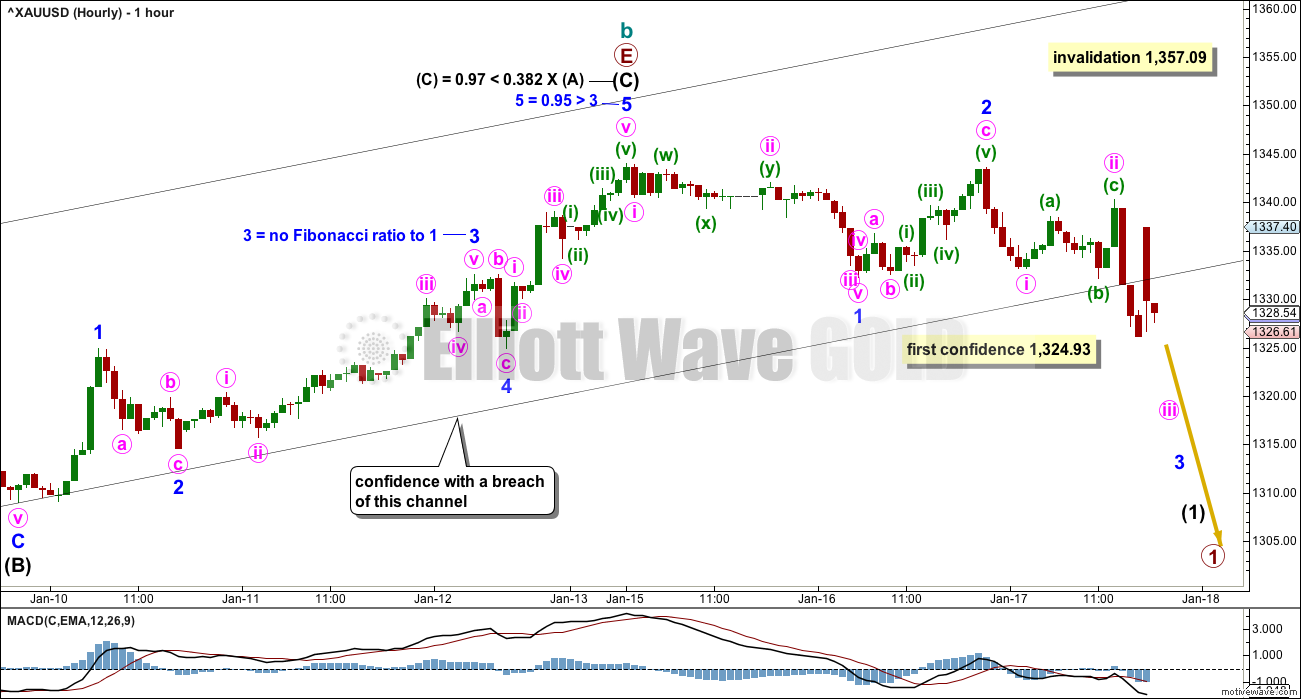
This first wave count follows on directly from the weekly chart above. It looks at primary wave E as a single zigzag. Zigzags subdivide 5-3-5.
It is possible that the zigzag for primary wave E may be complete. It looks like a zigzag at the daily chart level. E waves of triangles can be surprisingly quick. A very good example of this is here on this daily chart: the triangle labelled intermediate wave (B) within primary wave D also came to a quicker than expected end.
The target calculated for cycle wave c assumes the most common Fibonacci ratio to cycle wave a.
If primary wave E continues higher, it may not move beyond the end of primary wave C above 1,357.09. A new high by any amount at any time frame would immediately invalidate this wave count.
HOURLY CHART
Click chart to enlarge.
A five down may possibly be complete at the low labelled minor wave 1, and it may have shown a curving form fairly typical for Gold: a long drawn out second wave for minute wave ii and a quick fourth wave for minute wave iv.
The channel about primary wave E is now breached by downwards movement. This is an indication that the upwards zigzag of primary wave E may now be complete.
This wave count still requires a new low below 1,324.93 for confidence.
This wave count expects an imminent increase in downwards momentum as a small third wave at three degrees begins.
ALTERNATE HOURLY CHART
Click chart to enlarge.
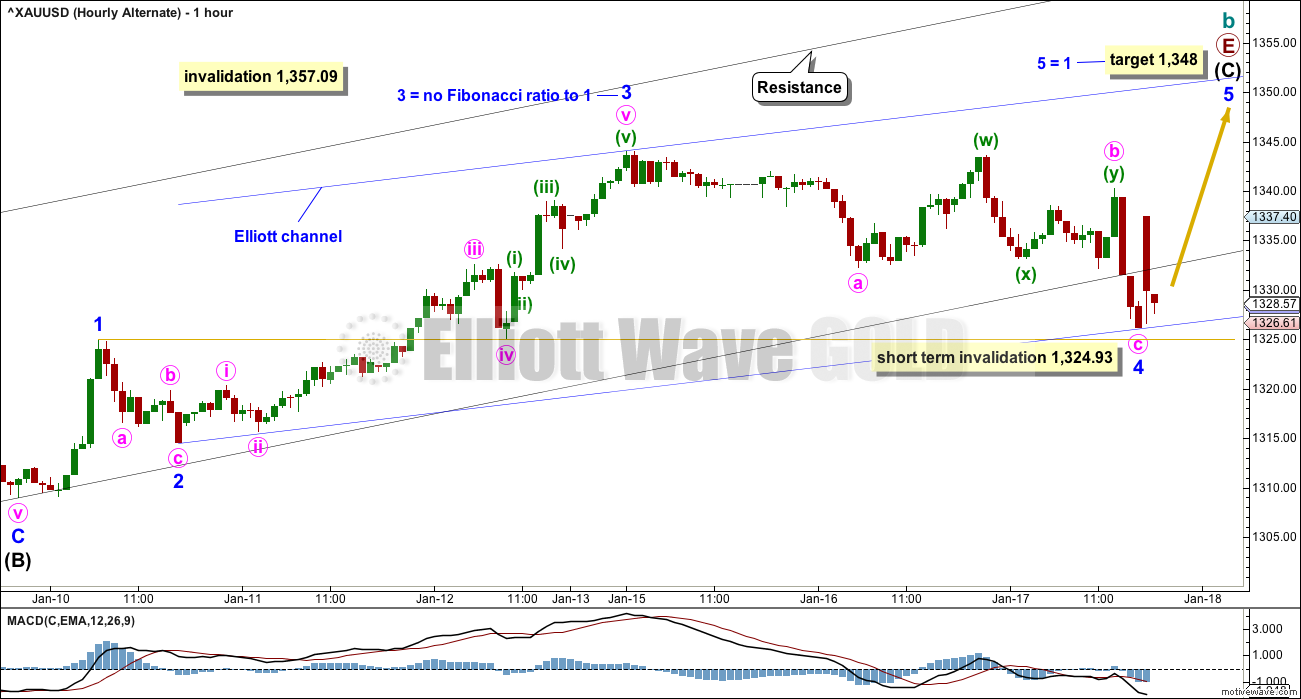
It remains possible that intermediate wave (C) is incomplete and the recent downwards movement is minor wave 4 within it.
Minor wave 4 may not move into minor wave 1 price territory below 1,324.93.
It would be more likely that minor wave 5 would exhibit a Fibonacci ratio to either of minor waves 1 or 3, because there is no Fibonacci ratio between minor waves 1 and 3. The most common ratio for a fifth wave is used to calculate the target.
The target is recalculated now that minor wave 4 may have moved lower. The target would see price still fall short of the A-C trend line now.
The breach of the black channel has slightly reduced the probability of this alternate wave count today.
SECOND WAVE COUNT
WEEKLY CHART
Click chart to enlarge.
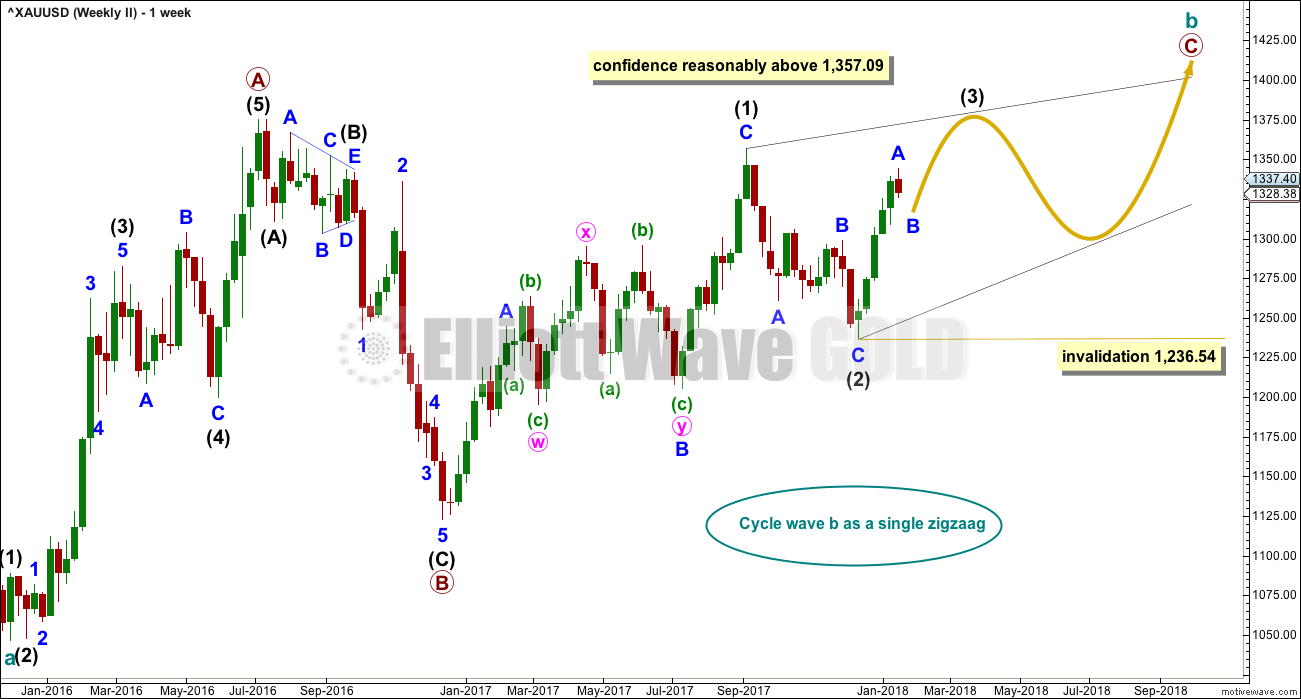
If cycle wave b is a single zigzag, then the upwards wave labelled here primary wave A must be seen as a five wave structure. But this is problematic because (within primary wave A) intermediate wave (4) lasted 12 weeks whereas intermediate wave (2) only lasted 2 weeks. While disproportion between corrective waves does not violate any Elliott wave rules, it does give a wave count the wrong look.
Gold is typical of commodities in that it often exhibits swift strong fifth waves, leading to blowoff tops in bull markets and selling climaxes in bear markets. This tendency is most often seen in Gold’s third waves. When this happens the strong fifth wave forces the fourth wave correction that comes before it to be more brief and shallow than good proportion to its counterpart second wave would suggest. When this happens the impulse has a curved three wave look to it at higher time frames.
It is acceptable for a wave count for a commodity to see a curved impulse which has a more time consuming second wave correction within it than the fourth wave correction.
The impulse has a more time consuming fourth wave than the second in this case though, giving the wave the look of a zigzag. This is unusual, and so the probability of this wave count is low.
Low probability does not mean no probability, so this wave count is possible; when low probability outcomes do occur, they are never what was expected as most likely.
Primary wave C must subdivide as a five wave structure, either an impulse or an ending diagonal. Because the upwards wave of intermediate wave (1) fits as a zigzag and will not fit as an impulse, an ending diagonal is considered.
Ending diagonals require all sub-waves to subdivide as zigzags.
Within intermediate wave (1), to see this wave as a zigzag, minor wave B is seen as a double flat correction. In my experience double flats are extremely rare structures, even rarer than running flats. The rarity of this structure further reduces the probability of this wave count.
Intermediate wave (3) must move beyond the end of intermediate wave (1) above 1,357.09.
THIRD WAVE COUNT
WEEKLY CHART
Click chart to enlarge.
Cycle wave a is still seen as a completed five wave structure. This third wave count looks at cycle wave b as a possible double zigzag.
A triangle may be completing as an X wave within a double zigzag for cycle wave b.
Now the upwards wave labelled here primary wave W is seen as a zigzag. This has a better fit than the first alternate.
Within the triangle for primary wave X, intermediate waves (A) through to (C) may be complete. Intermediate wave (D) may also be complete, but there is room for it to still move higher. If the triangle for primary wave X is a regular contracting triangle, then intermediate wave (D) may not move beyond the end of intermediate wave (B) above 1,357.09. If the triangle is a barrier triangle, then intermediate wave (D) should end about the same level as intermediate wave (B), so that the (B)-(D) trend line remains essentially flat. In practice, this means that intermediate wave (D) may end slightly above 1,357.09 and this wave count would remain valid.
This is why a new high reasonably above 1,357.09 only would invalidate this wave count. This invalidation point is not black and white.
SECOND ALTERNATE WAVE COUNT
MONTHLY CHART
Click chart to enlarge.
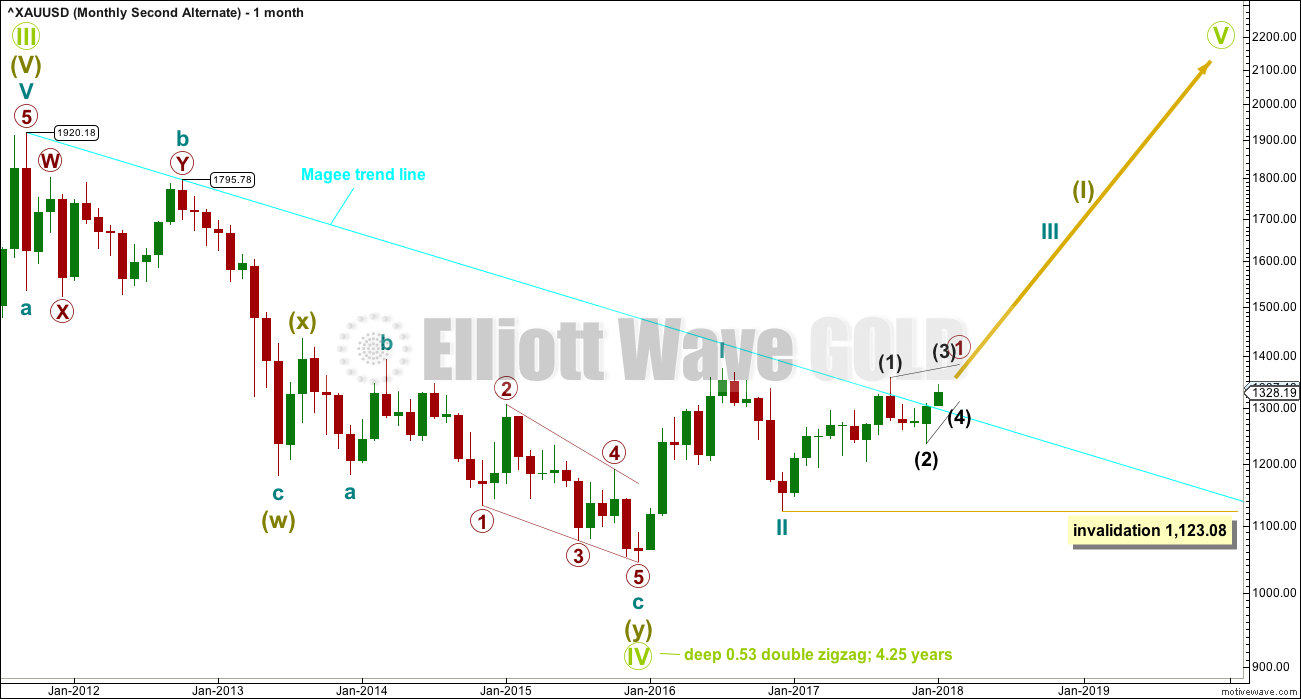
This wave count is new and adds another alternate idea to the historic analysis.
It is possible that Grand Super Cycle wave IV is over. It would be rather brief though at only 4.25 years. However, Grand Super Cycle wave II in the Grand Super Cycle analysis is expected to have lasted only about 8 years, so this possibility should be accepted.
If there has been a trend change at Grand Super Cycle degree in the end of November 2015, then a new five wave structure upwards should develop from there at the monthly chart level.
Gold will often form long slow basing movements. Its first waves can be short and its second waves long lasting and deep.
Cycle waves I and II may be complete within Super Cycle wave (I).
Within cycle wave III, primary wave 1 may be unfolding as a leading diagonal. When it is complete, then primary wave 2 may not move beyond the start of primary wave 1 below 1,123.08.
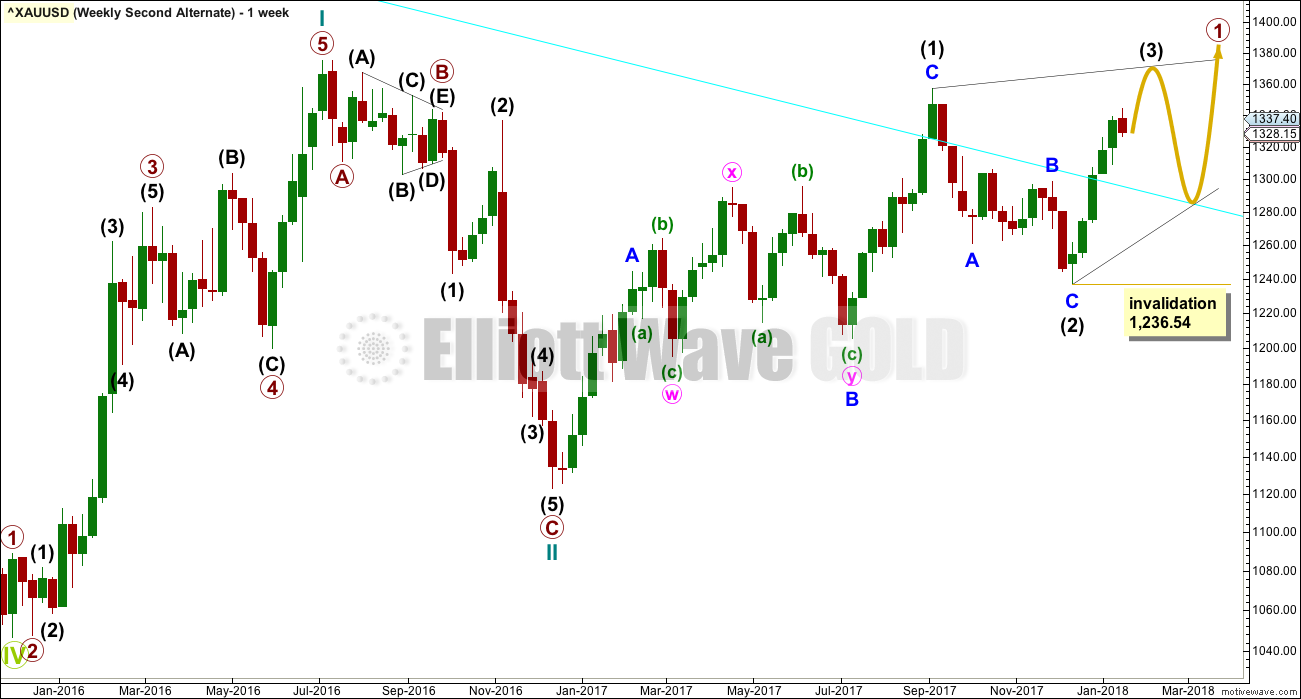
WEEKLY CHART
Click chart to enlarge.
This wave count is essentially the same for the short to mid term as the second weekly chart for the main wave count.
Cycle wave I does not fit well as a five wave impulse.
Within intermediate wave (1) of the diagonal, the structure of minor wave B is seen as a double flat correction. This is a very rare structure.
The probability of this wave count at this stage is low. Low probability does not mean no probability.
TECHNICAL ANALYSIS
WEEKLY CHART

Click chart to enlarge. Chart courtesy of StockCharts.com.
Now that price has again broken above resistance at 1,305 to 1,310, that area may now provide support. Next resistance is about 1,345.
Stochastics is added this week. Price is range bound in a weekly level consolidation. As price swings from resistance to support and back again, Stochastics may be used to assist to see where each swing may end and the next begin. Price is nearing resistance at 1,345 and Stochastics is just entering overbought. It looks reasonable to expect the upwards swing to end soon; there is a little room for price to rise still.
DAILY CHART
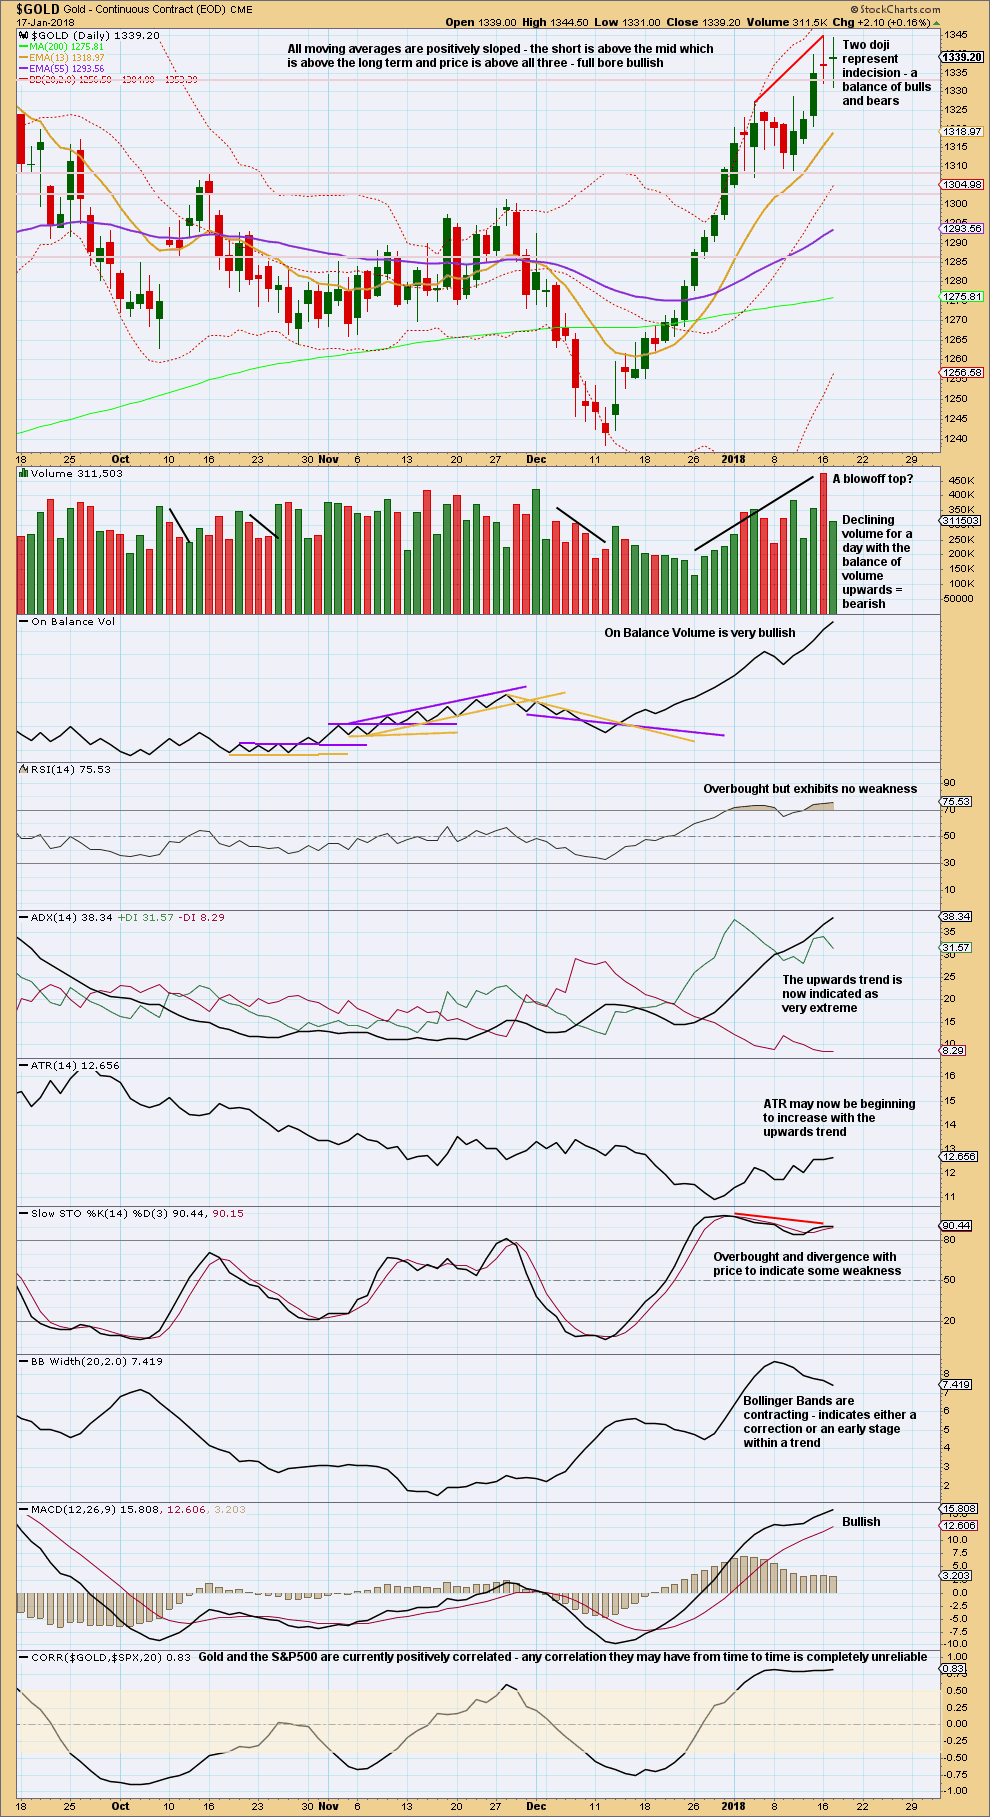
Click chart to enlarge. Chart courtesy of StockCharts.com.
Today’s session moved price lower, but the balance of volume was upwards and the candlestick closed green. Upwards movement within today’s session does not have support from volume. This looks bearish at least for the short term.
ATR can continue to remain very extreme for longer and RSI can become more extremely overbought before price turns. With no divergence between price and RSI to indicate weakness, the upwards trend may yet continue.
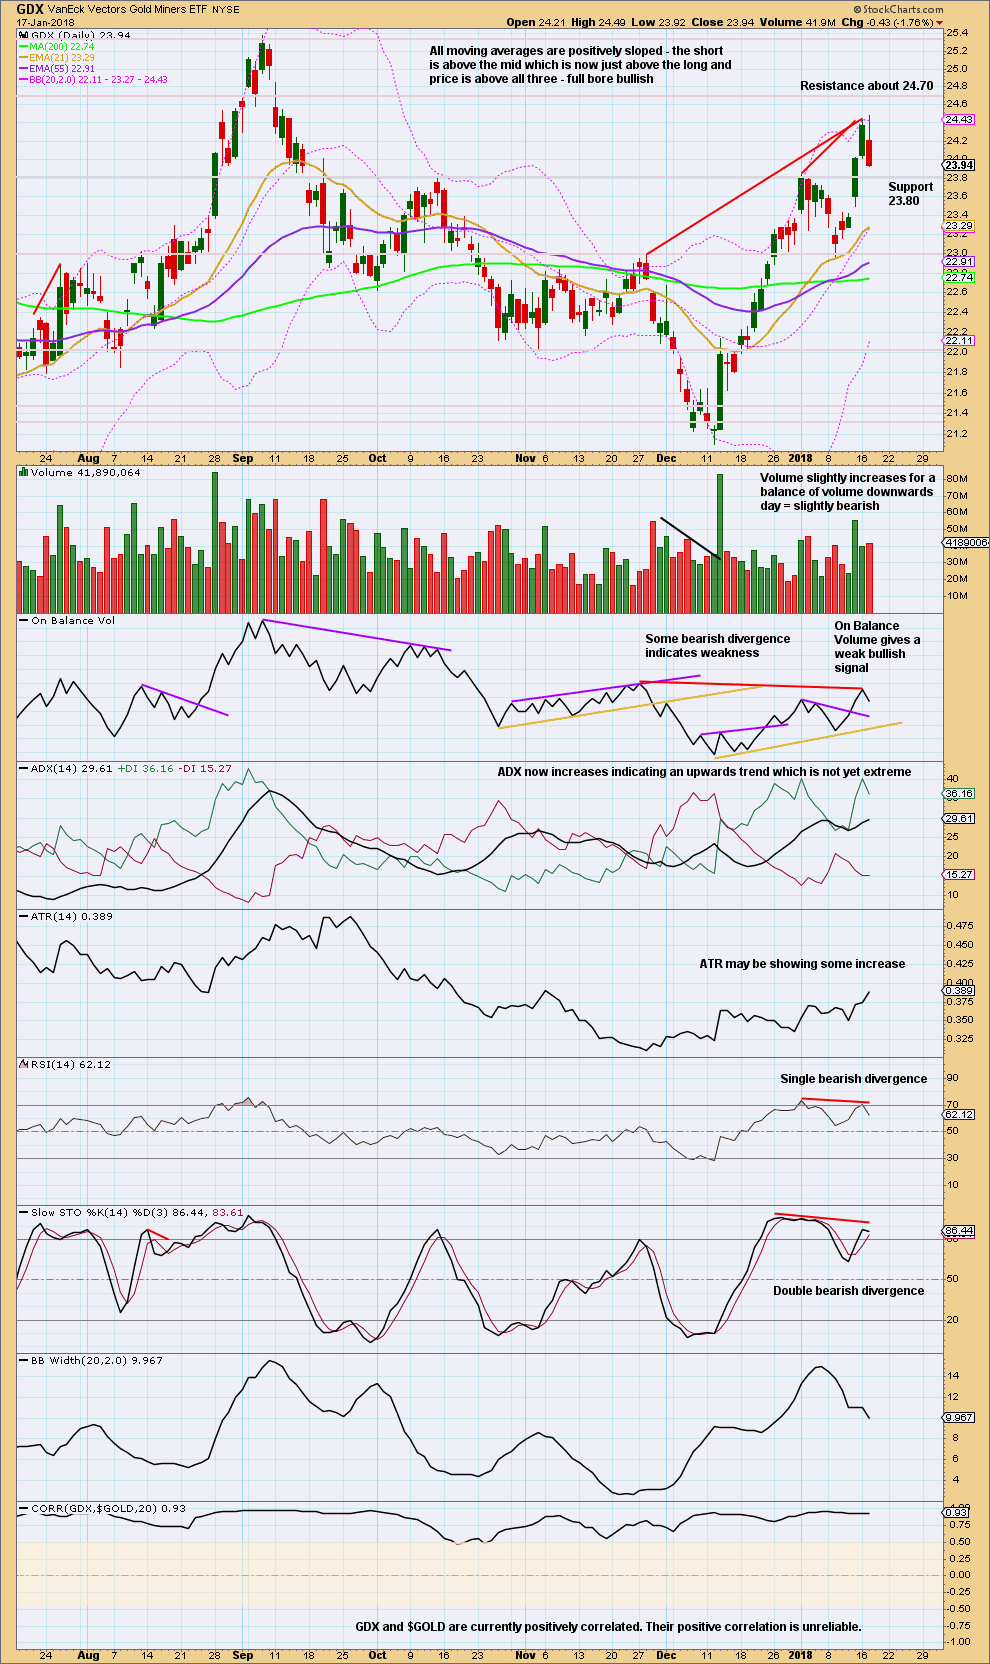
GDX DAILY CHART
Click chart to enlarge. Chart courtesy of StockCharts.com.
If On Balance Volume should be read as a leading indicator, then its failure to make a new high above the prior high of 28th November, 2017, should be read as bearish. Red trend lines indicate this divergence on the chart.
This chart is still bullish though. There is still room for price to rise and the trend to become more extreme before price turns.
There is some weakness evident with divergence between price and On Balance Volume, RSI and Stochastics.
The long upper wick on today’s last candlestick is bearish.
Published @ 07:27 p.m. EST.
Updated hourly chart:
We can have some confidence at this stage in a trend change….
What we cannot have full confidence in yet is what degree this trend change is. Is it at cycle degree as the main wave count expects? Or is it only minor degree and the second weekly wave count expects?
In other words, is this the start of a new downwards trend or is it just a pullback within an upwards trend?
We can only know for sure if price now makes a new low below 1,236.54. At that point the second and third weekly counts would be invalidated, leaving only the one main wave count.
Lara
In your hourly alternate isn’t minor wave 4 vastly disproportionate to minor wave 2 in length?
Yes. Which is another reason why it was an alternate.
It’s invalidated now.
From Goldseek.com
The Next Long Term Investment Cycle…How to position oneself- By Rambus
“My past two weekend reports have armed the investor with ideas for the coming year 2018. This week’s report summarizes those ideas, updates the current PM rally and adds more ideas to the list. It is important to understand the driving force which will fuel the coming bull market in precious metals so I lay it out……..
http://news.goldseek.com/GoldSeek/1516197900.php
This is a must read. Thanks 😀
Thank you Papudi.
Hi Lara,
Why , in the first hourly, is the confidence point 1324.93. Is that just the point of breach of the trendline?
because that’s the invalidation point for the alternate
… which has been invalidated with the drop to 1324.41.
… well Gold price may have marginally dropped below the invalidation point but has not yet retraced 23.6% of recent L1236/H1344…. Imo the bull does not appear to be done yet; a sustained move above 1332 should aim to seek 1341-44+. Let’s see. Downside risk a break below 1312.
Sorry – silly question. Must be tired!
no worries.
all questions are welcome, even the ones which have obvious answers
invalidation point breached and then unbreached? I do not understand.
In yesterday’s summary Lara wrote:”for confidence in this view, first a new low below 1,324.93 and then a breach of the Elliott channel on the hourly charts by downwards movement is required.”
once an invalidation point is breached it does not need to see price remain below that point
My word doc is now three pages and growing. A very important point.