
At least a little upwards movement to a target at 1,339 was expected. Upwards movement has unfolded to reach 1,342.08 so far.
Summary: The main wave count expects a trend change to a new bear market to last one to several years, and the target is 470. However, for the short term, the classic technical analysis today looks bullish.
Full confidence may be had in the new bear market if price can make a new low below 1,236.54 in the next few weeks.
An alternate expects overall upwards movement from here. It would be confirmed only if price makes a new high reasonably above 1,357.09.
New updates to this analysis are in bold.
Last historic analysis with monthly charts is here. Video is here.
Another alternate monthly chart is here.
Grand SuperCycle analysis is here.
MAIN ELLIOTT WAVE COUNT
WEEKLY CHART
Click chart to enlarge.
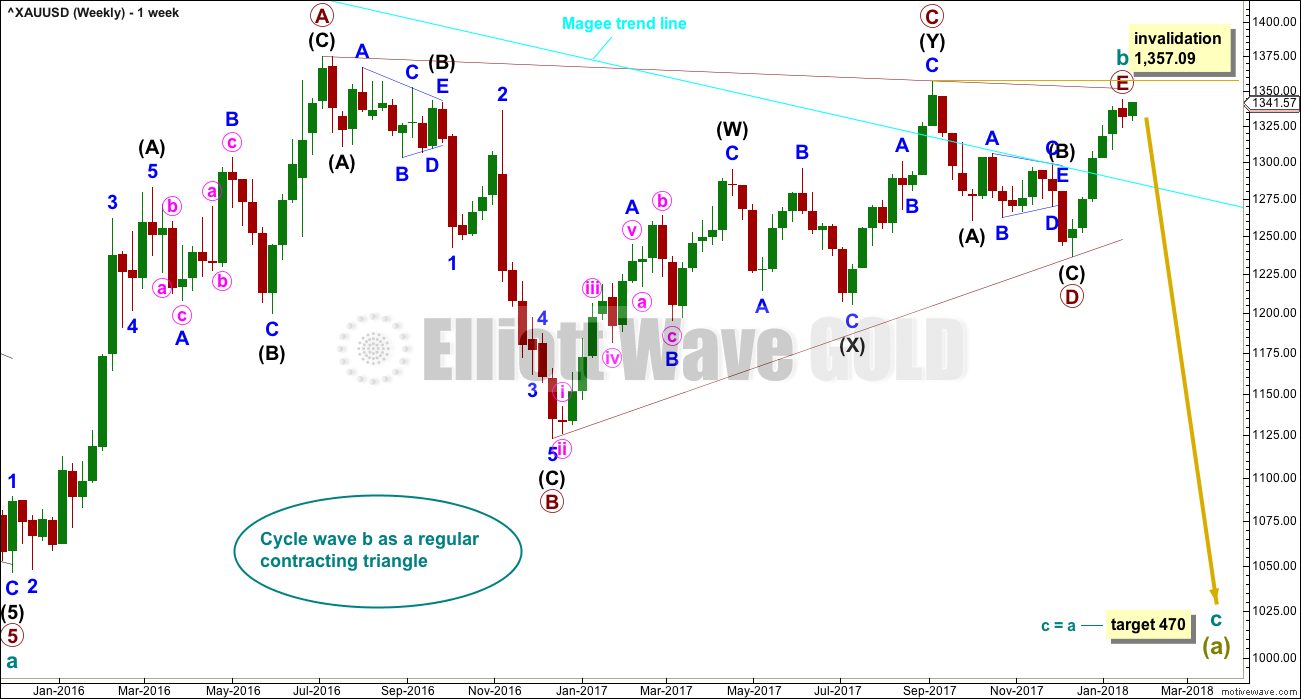
All main wave counts expect that Gold completed a large five down from the all time high in November 2011 to the low of December 2015, which is seen on the left hand side of weekly charts.
If this analysis is correct, then the five down may not be the completion of the correction. Corrective waves do not subdivide as fives; they subdivide as threes. The five down is seen as cycle wave a within Super Cycle wave (a).
Cycle wave b began in December 2015.
This wave count looks at cycle wave b to be most likely a regular contracting triangle.
All sub-waves must subdivide as threes within an Elliott wave triangle, and four of the five sub-waves must be zigzags or multiple zigzags, and the most common sub-wave to be a multiple is wave C. Only one sub-wave may be a more complicated multiple. This triangle meets all these rules and guidelines; all subdivisions fit perfectly at all time frames. It is the main wave count for these reasons, and thus is judged to have the highest probability.
The triangle trend lines have a normal looking convergence.
While primary wave E should also most likely look like an obvious three wave structure at the weekly and daily chart levels, it does not have to do this. It is possible that primary wave E could be over, falling reasonably short of the A-C trend line and being relatively quick. E waves of triangles can be the quickest of all triangle waves.
DAILY CHART
Click chart to enlarge.
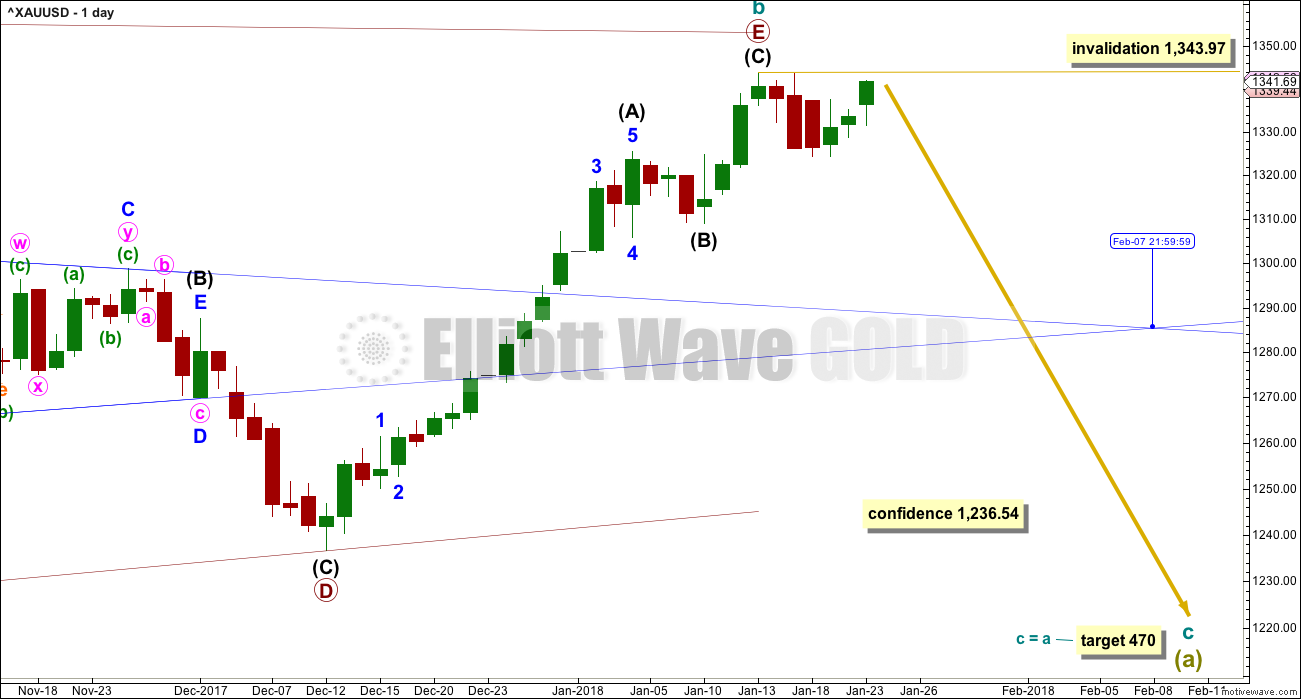
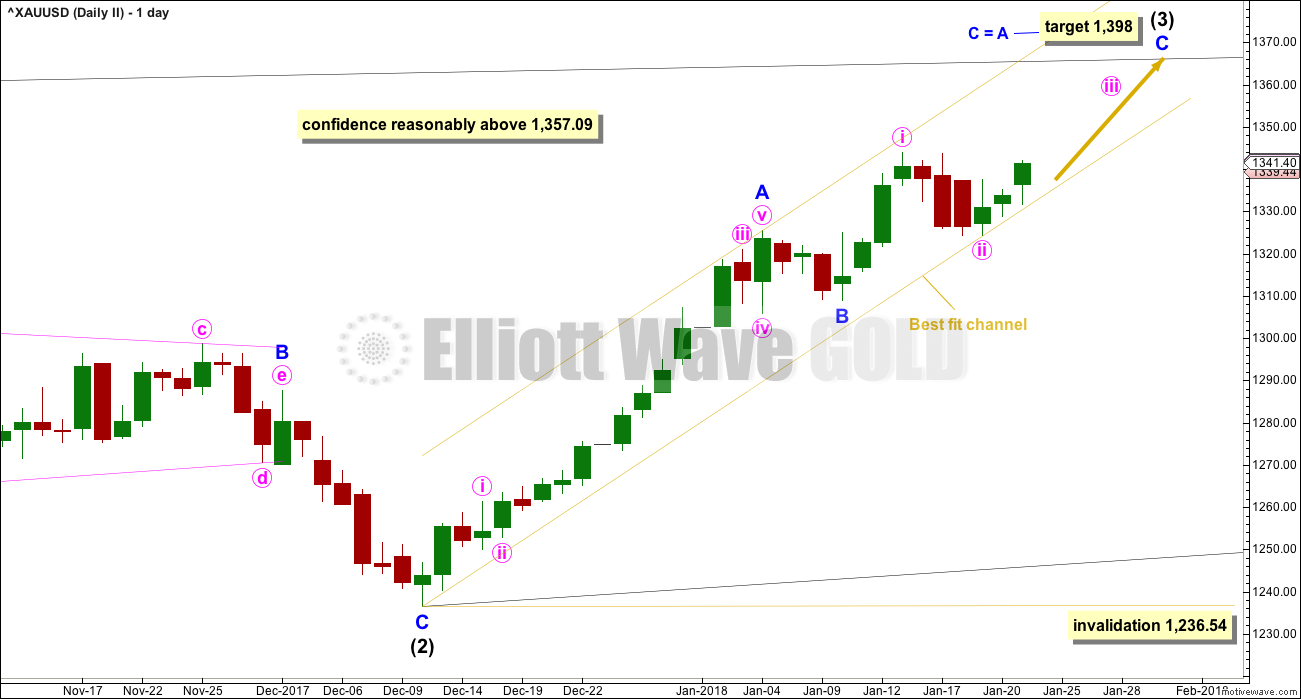
This first daily chart follows on directly from the weekly chart above. The triangle for cycle wave b may have just recently completed.
Primary wave E fits as a completed zigzag and falls reasonably short of the A-C trend line, the most common point for E waves of Elliott triangles to end.
If this wave count is correct, then price needs to move strongly lower next week. Within the new trend, no second wave correction may move beyond the start of its first wave above 1,343.97.
If price makes a new high above 1,343.97 within the next day or so, then this wave count would be adjusted at the daily chart level to see primary wave E continuing higher. Only a new high above 1,357.09 would fully invalidate this wave count at all time frames.
The target for cycle wave c to end assumes the most common Fibonacci ratio to cycle wave a.
A new low below 1,236.54 would invalidate weekly alternate wave counts and provide a high level of confidence in this main wave count.
HOURLY CHART
Click chart to enlarge.
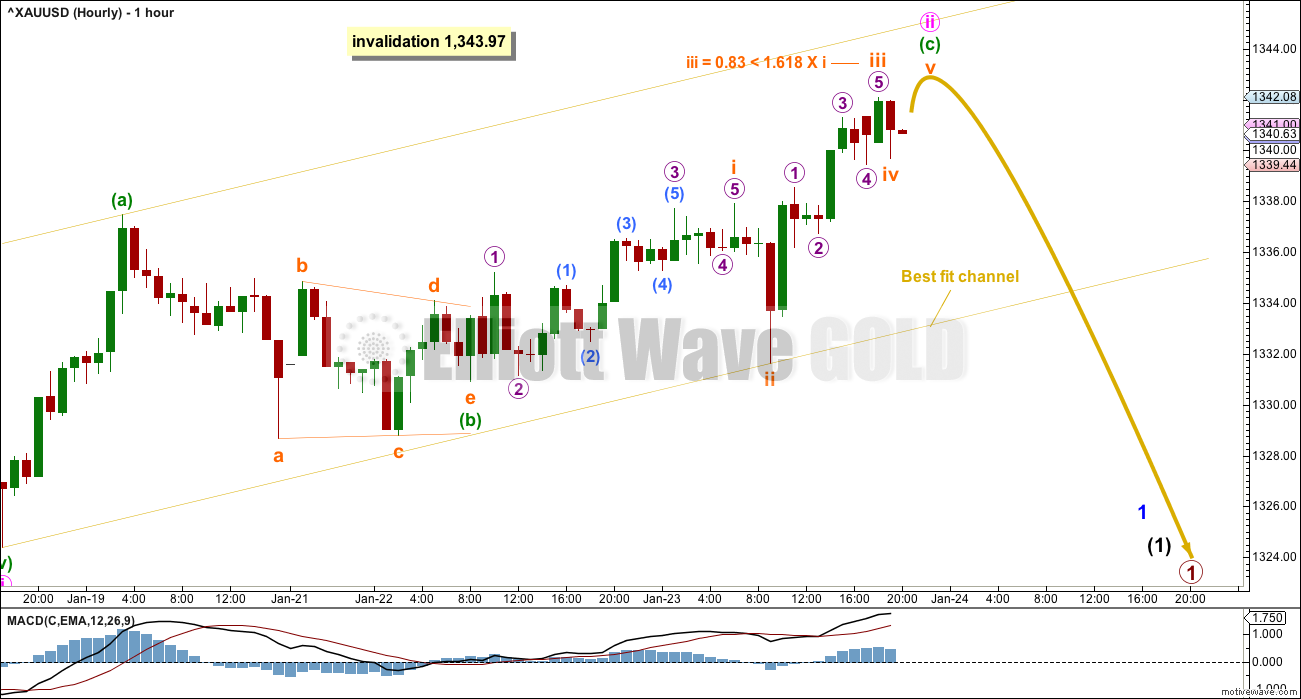
The structure within minute wave ii is relabelled today. It may be completing still as a single zigzag, and minuette wave (c) within it now fits as an incomplete impulse.
The long lower wick of the last candlestick is bullish. At least a little more upwards movement may be expected.
Target calculations at minuette and subminuette wave degrees yield targets which are above the invalidation point. There is already a Fibonacci ratio between subminuette waves i and iii, and so subminuette wave v may not exhibit a Fibonacci ratio to either of subminuette waves i or iii.
As soon as subminuette wave v makes a slight new high above the end of subminuette wave iii at 1,342.08, then it would avoid a truncation and this wave count would then expect a trend change.
If this wave count is correct, then the next wave down should be a third wave that should exhibit an increase in downwards momentum.
SECOND WAVE COUNT
WEEKLY CHART
Click chart to enlarge.
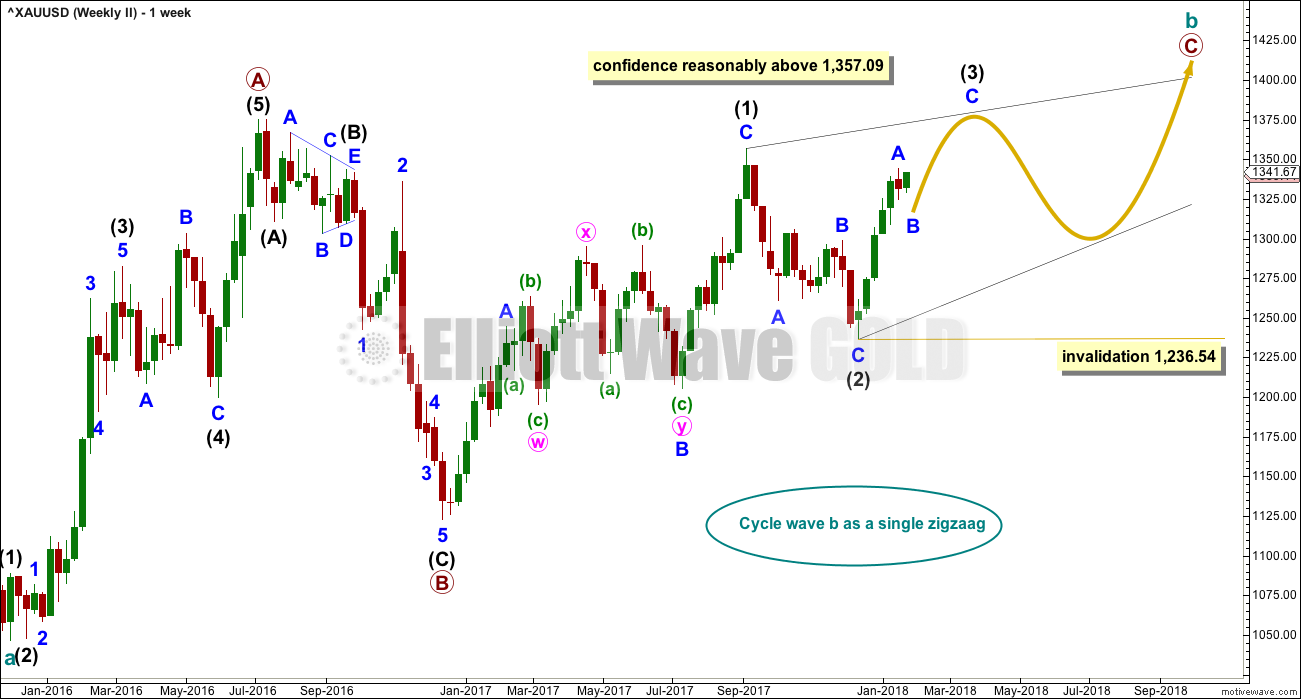
If cycle wave b is a single zigzag, then the upwards wave labelled here primary wave A must be seen as a five wave structure. But this is problematic because (within primary wave A) intermediate wave (4) lasted 12 weeks whereas intermediate wave (2) only lasted 2 weeks. While disproportion between corrective waves does not violate any Elliott wave rules, it does give a wave count the wrong look.
Gold is typical of commodities in that it often exhibits swift strong fifth waves, leading to blowoff tops in bull markets and selling climaxes in bear markets. This tendency is most often seen in Gold’s third waves. When this happens the strong fifth wave forces the fourth wave correction that comes before it to be more brief and shallow than good proportion to its counterpart second wave would suggest. When this happens the impulse has a curved three wave look to it at higher time frames.
It is acceptable for a wave count for a commodity to see a curved impulse which has a more time consuming second wave correction within it than the fourth wave correction.
The impulse has a more time consuming fourth wave than the second in this case though, giving the wave the look of a zigzag. This is unusual, and so the probability of this wave count is low.
Low probability does not mean no probability, so this wave count is possible; when low probability outcomes do occur, they are never what was expected as most likely.
Primary wave C must subdivide as a five wave structure, either an impulse or an ending diagonal. Because the upwards wave of intermediate wave (1) fits as a zigzag and will not fit as an impulse, an ending diagonal is considered.
Ending diagonals require all sub-waves to subdivide as zigzags.
Within intermediate wave (1), to see this wave as a zigzag, minor wave B is seen as a double flat correction. In my experience double flats are extremely rare structures, even rarer than running flats. The rarity of this structure further reduces the probability of this wave count.
Intermediate wave (3) must move beyond the end of intermediate wave (1) above 1,357.09.
Intermediate wave (3) must subdivide as a zigzag. Within the zigzag, minor wave B may not move beyond the start of minor wave A below 1,236.54. At this stage, the last five days of sideways movement look like a correction within an ongoing upwards trend which would favour this alternate wave count. Minor wave B may last from just a few days to a few weeks.
DAILY CHART
Click chart to enlarge.
It is time to provide a daily chart for this bullish alternate.
Within the ending diagonal, intermediate wave (3) must sub-divide as a zigzag.
Within the zigzag, minor waves A and B may be over already and minor wave C upwards may have begun. The target assumes the most common Fibonacci ratio between minor waves A and C.
Within minor wave C, minute waves i and ii may now be over. Minute wave iii may exhibit an increase in upwards momentum.
It is also possible that the zigzag of intermediate wave (3) may be relabelled. Minor wave A only may have been over at the last high, and the last six sessions may have been the start of minor wave B. Minor wave B may not move beyond the start of minor wave A below 1,236.54.
A new high reasonably above 1,357.09 would see the first wave count invalidated and discarded and this second alternate wave count the only remaining wave count. At that stage, expect overall an increase in upwards momentum.
THIRD WAVE COUNT
WEEKLY CHART
Click chart to enlarge.
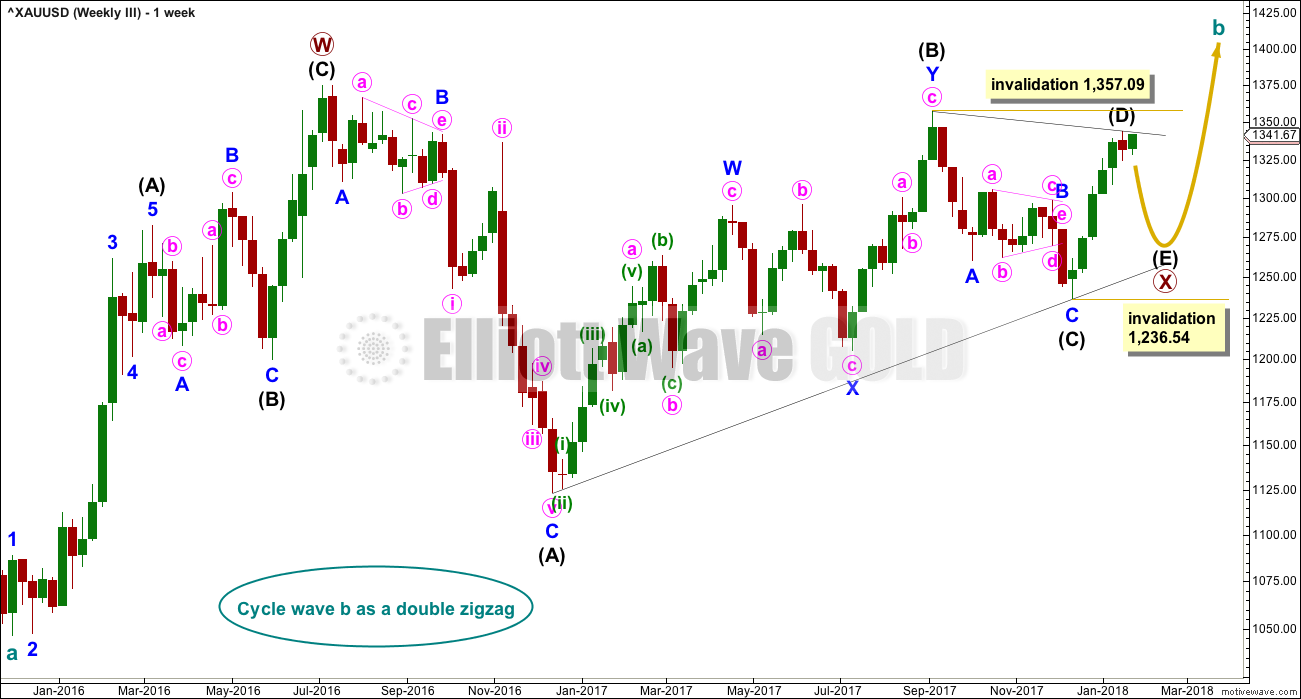
Cycle wave a is still seen as a completed five wave structure. This third wave count looks at cycle wave b as a possible double zigzag.
A triangle may be completing as an X wave within a double zigzag for cycle wave b.
Now the upwards wave labelled here primary wave W is seen as a zigzag. This has a better fit than the first alternate.
Within the triangle for primary wave X, intermediate waves (A) through to (C) may be complete. Intermediate wave (D) may also be complete, but there is room for it to still move higher. If the triangle for primary wave X is a regular contracting triangle, then intermediate wave (D) may not move beyond the end of intermediate wave (B) above 1,357.09. If the triangle is a barrier triangle, then intermediate wave (D) should end about the same level as intermediate wave (B), so that the (B)-(D) trend line remains essentially flat. In practice, this means that intermediate wave (D) may end slightly above 1,357.09 and this wave count would remain valid.
This is why a new high reasonably above 1,357.09 only would invalidate this wave count. This invalidation point is not black and white.
The final sub-wave of intermediate wave (E) may have now begun. Intermediate wave (E) may not move beyond the end of intermediate wave (C) below 1,236.54. This invalidation point is black and white. A new low by any amount at any time frame would invalidate this wave count.
TECHNICAL ANALYSIS
WEEKLY CHART
Click chart to enlarge. Chart courtesy of StockCharts.com.
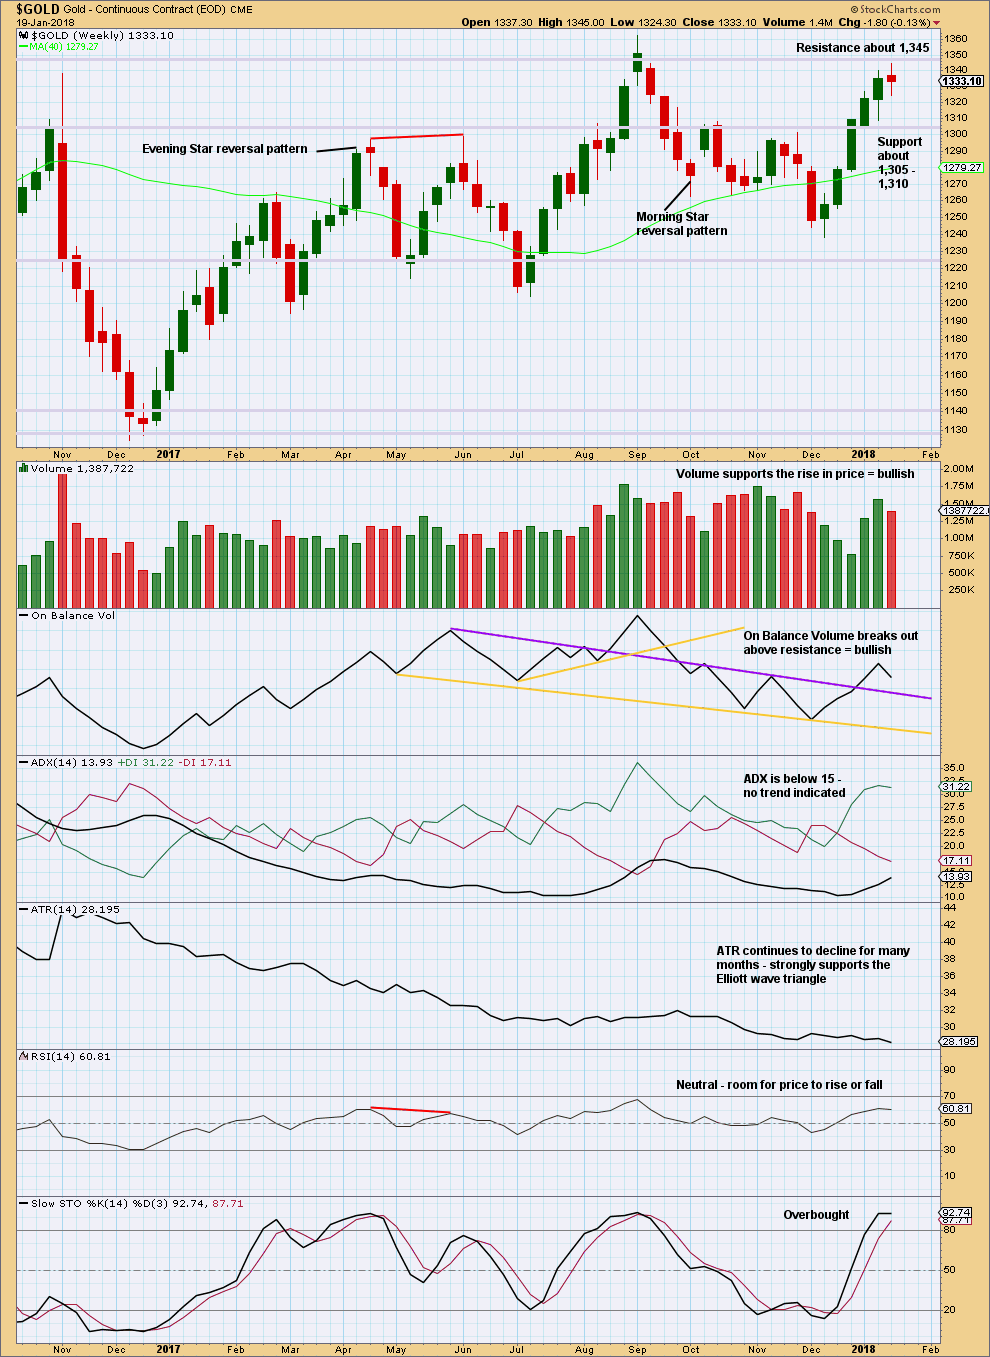
Price found resistance last week, at about 1,345.
The small spinning top candlestick and decline in volume suggest a pause within an upwards trend, or a weak end to the upwards trend.
Stochastics may move further into overbought territory before price turns.
DAILY CHART
Click chart to enlarge. Chart courtesy of StockCharts.com.
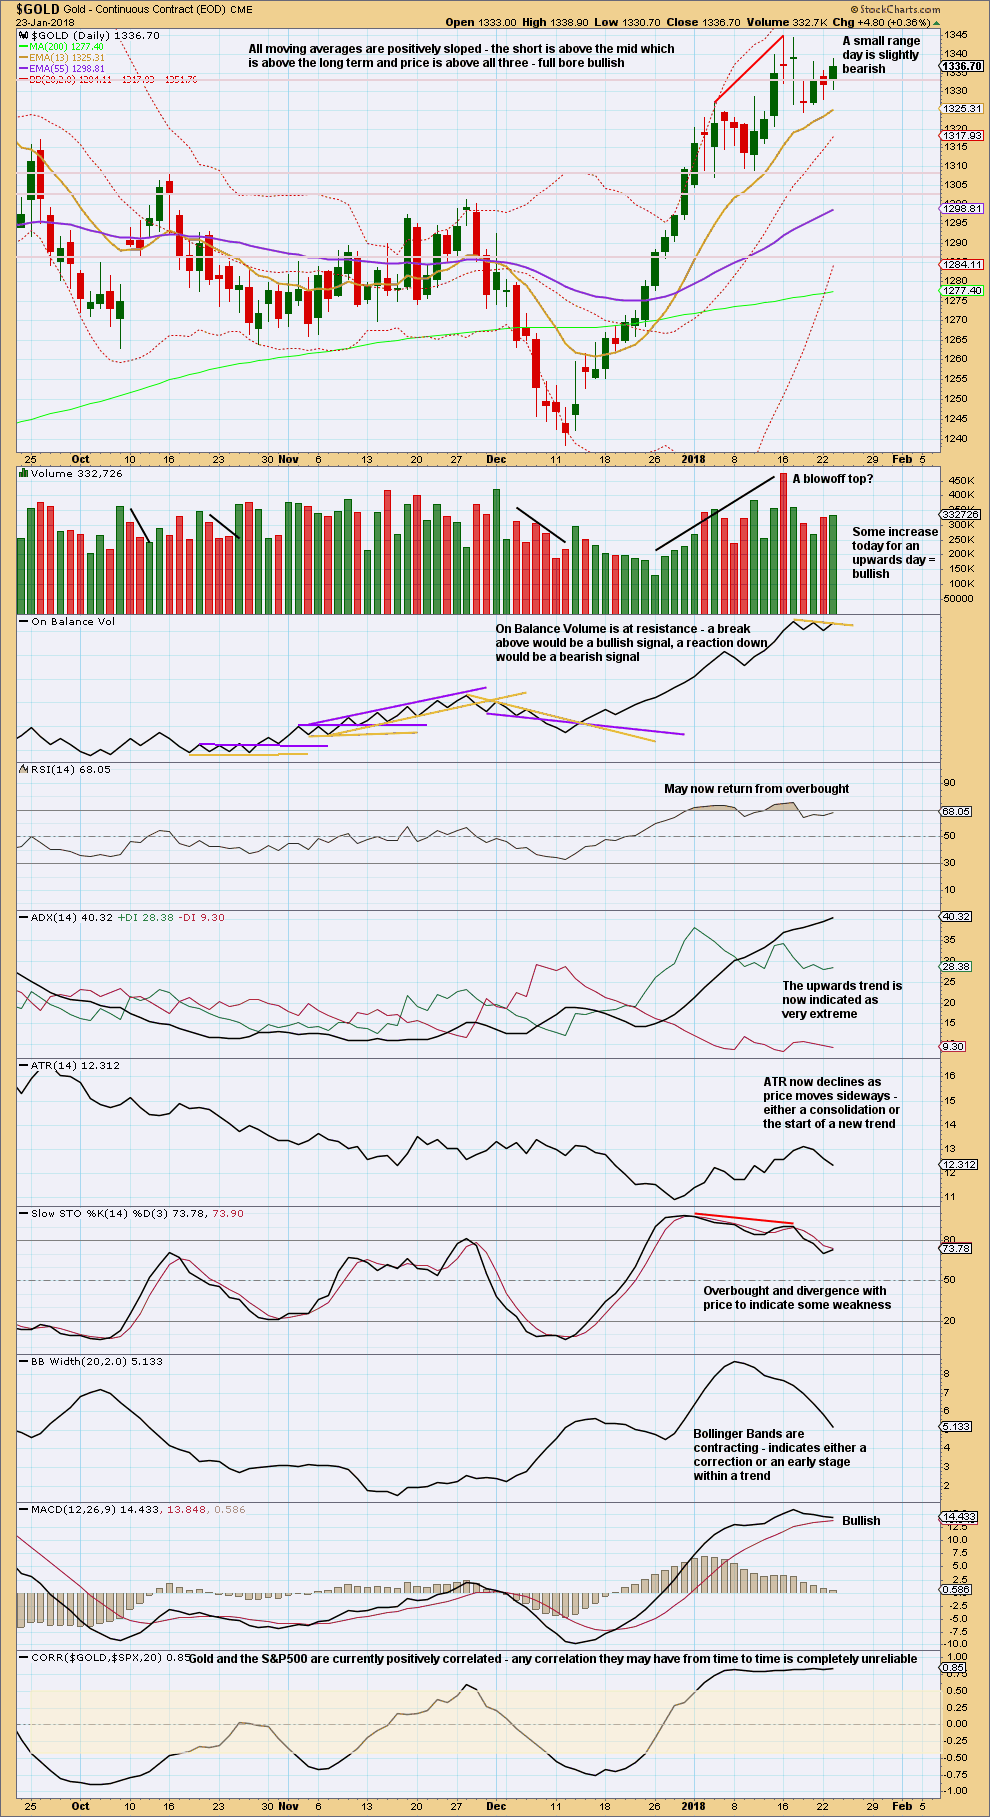
It still looks like a consolidation may be forming and may be followed by an upwards breakout. This view has a little more support today from volume to support an upwards day. This is one reason why a daily chart for the bullish wave count is published today.
GDX DAILY CHART
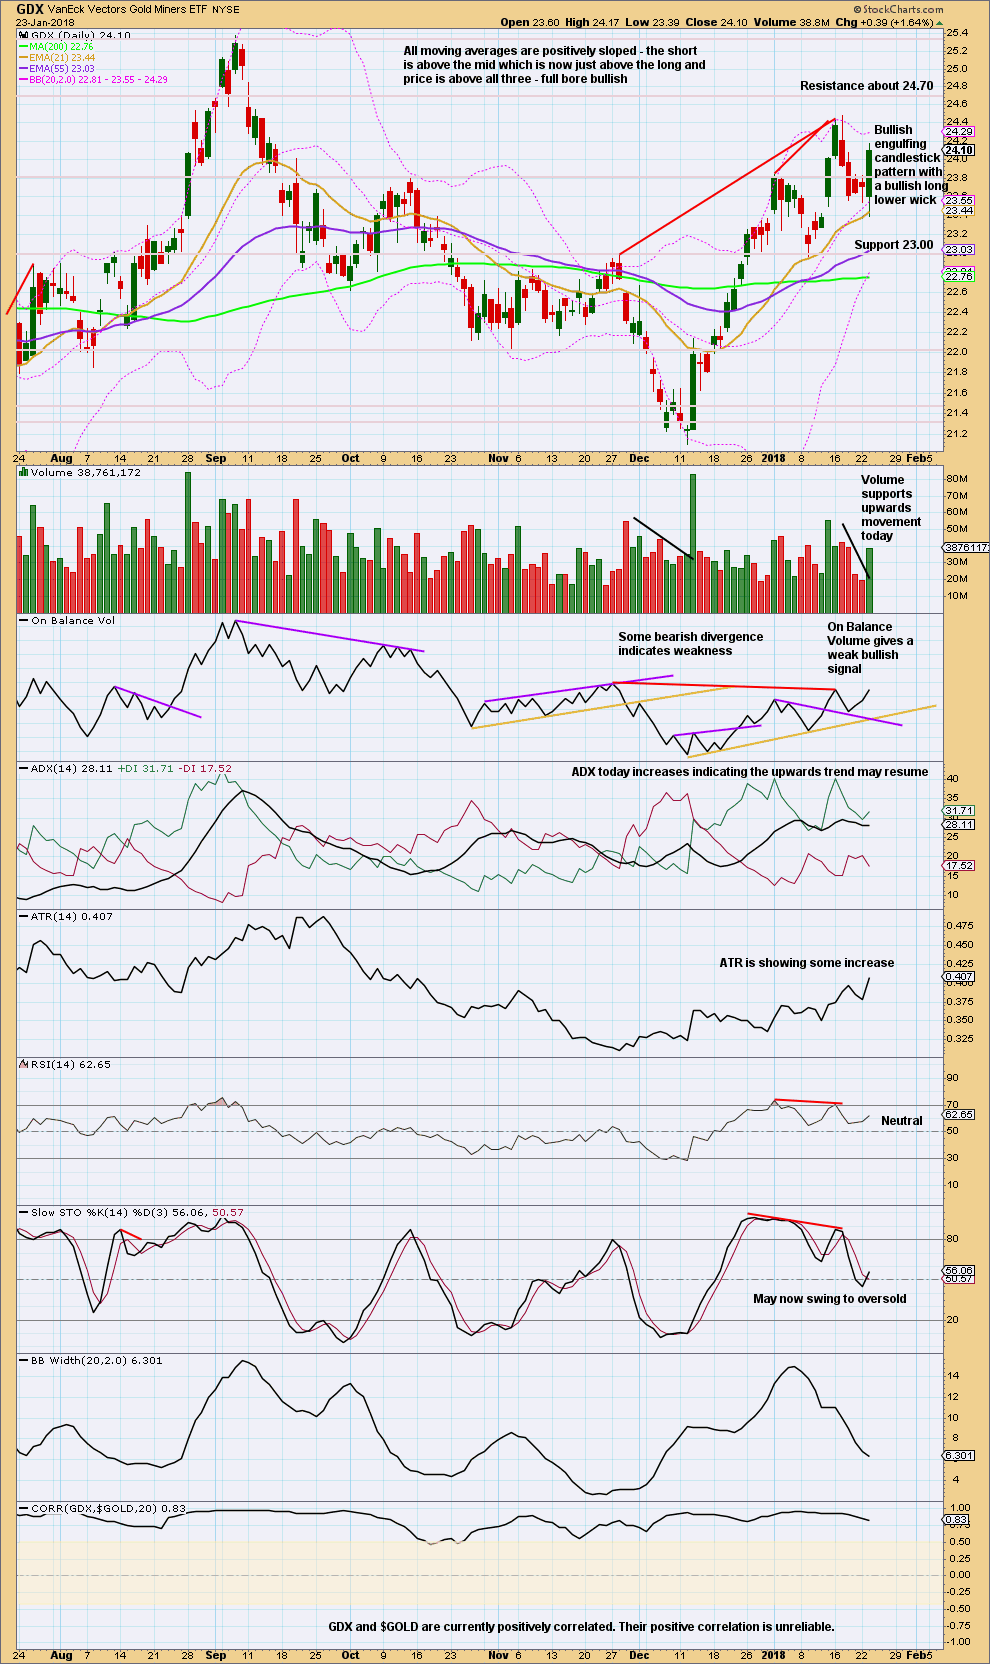
Click chart to enlarge. Chart courtesy of StockCharts.com.
GDX today looks like it may have finished a small pullback within an ongoing upwards trend. This daily candlestick is very bullish and has support from volume.
Published @ 08:45 p.m. EST.
Lara, currencies and commodities including Gold are not traded in a vacuum. Therefore, we should weigh what the charts in other markets are telling to us (a.k.a intermarket analysis). First, as we discussed here earlier with Dreamer’s very helpful contribution, there is an unfolding, near perfect bullish triangle consolidation in XAUJPY, with wave E very likely already in play (I believe that we have already seen the D-wave top just below 150,000). Furthermore, USDJPY is very likely forming a bullish H&S consolidation pattern, the right shoulder near completion now (see attached). According to my indicators, wave E in XAUJPY is expected to bottom at around 135,000. Meanwhile, if USDJPY were indeed to go up from the H&S pattern, then the cumulative effect of the strengthening JPY against Gold and the strengthening USD against JPY would result in a much deeper drop in XAUUSD than your third count anticipates. The wild card in this equation is that it is impossible to tell how far the yen will weaken against the dollar. The Japanese are (in)famous about bold interventionist measures and they have a vested interest in keeping the value of their currency low, even more than any other developed nation. I think that by going long in the PM complex when XAUJPY hits 135,000, the risk/reward ratio will be exceptionally favorable.
I guess that the triangle concept is now scrapped… I think that where it went wrong is the assumption that the move from the 2015 low to the 2016 top was a three. USD holds the key to Gold’s next move. According to Kitco today gold went up 1.25%, of which 0.99%, that is, almost 80% of the entire move can be attributed to the drop in the dollar. However, there is a cluster of near-term resistance levels for Gold and UUP is only a few cents above what is supposed to be a wave 1 top and as such a wave 4 bottom in the same time. I do not see much more upside for Gold here…
The main daily wave count with cycle b as a triangle is invalid.
The third weekly wave count with a triangle for primary X is still valid.
And I still have a big problem with the assumption that Gold and USD are correlated, because the math shows their correlation is unreliable.
If upside is limited for Gold here then the third weekly wave count would be a good explanation. And it is still long term bullish.
Lara,
I was reading up last night and the concept of social mood makes a lot more scientific sense than smart money. The main issue with smart money, to me, has been how do they act as one entity, in tandem?
But in trying to understand social mood, I have a question. Are there subsets of social mood?
At any given time the markets do not move in unison. There are sectors that are trending down while others are moving up. Likewise within sectors as well. I screened for 52 week lows and came up with a boatload, across multiple sectors.
Thank you kindly.
I think the theory goes that each market has its own group of participants, and each group should be at its own point within a pattern. Swings of greed and fear for market players follow a pattern and trace out Elliott waves.
In regards to wider social mood it is only the indicies I think which are a market illustration. They have huge volume and the theory is that they are an indicator of wider social mood. Most people have investments in the indices or within the individual equities that comprise them. Either directly or through retirement savings vehicles.
Thank you, thank you, thank you, Lara. It is all beginning to fall in place – albeit slowly!!
King dollar is plunging. That has a huge impact on gold. Always focus on the big picture….lol
Bullish count updated (second daily):
I’m adjusting the count slightly, IMO this has a better look. It changes the target calculation but not the expected direction.
The target at 1,432 would see intermediate (3) still shorter than intermediate (1) and so the ending diagonal would be contracting. Which is the most common type.
Updated daily chart:
Primary wave E now slightly overshoots the A-C trend line. When triangles end most commonly E waves undershoot the A-C trend line. The other less likely look is with an overshoot, and when that happens it’s usually only a small one.
Hourly chart updated:
Only one more high required for the structure to be complete. But it cannot move above 1,357.09.
This is it for this wave count. If the bullish count is correct, and remember the classic TA favours it, then this bearish count will be invalidated within hours.
Invalidation of this bearish wave count would add reasonable confidence to the bullish wave count.
As for the last correction labelled intermediate (B), price proves now that it must be a corrective structure. And the absolute best fit is a triple zigzag. I’ve only ever seen one of these before, now this is the second.
Hmm… 1355.01.
Nearer and nearer to the invalidation point.
Will the bear survive or will the bull prevail?
At CMP 1353+, Imo Gold price is likely to begin coasting above 1350 (downside risk 1346); which should open up 1359-1368 range. With a high range close on Wednesday can ordinarily expect Gold price to seek further upside continuation on Thursday. Lets see what Gold price has in store. The bulls have been relentless lol….
It’s right on that point now isn’t it Alan 🙁
1,357.09 is the price point to watch. Above that the huge triangle is invalid.
If volume supports upwards movement today then the TA which viewed the last few days as a consolidation within an upward trend would be supported.
Speaking of the “right look” I would like to float another idea. In this scenario we are in the final stage of a very complex B wave within a flat, which is wave b within the Super Cycle a-b-c correction. While I do believe that we should see a substantial move down starting very soon, I think that the downside in this downwave will be limited. At this point only this scenario can be reconciled with the unfolding bullish triangle consolidation pattern in XAUJPY, which is as perfect so far as it gets.
However, this would negate the count of the wave from the 2015 bottom to the 2016 top as a three. Instead, it would need to be considered an impulse, with an expanded fourth. To me, it very much looks like that, as opposed to a three. As a three, it does not have the right look, but, again, this is only my opinion… Lara, what do you think?
Similar to the 3rd count except the move down is much deeper before turning up.
I would like to thank to everybody who contributed to the topic that I initiated about the applicability of the EW principle as a predictive tool. While obviously there is no certainty in the markets and I do not expect it, I think we can still work on improving the probabilities so that we can be on the right side of the trade.
While according to Lara there is no meaningful correlation between Gold and the USD, I think the current price action in Gold is USD driven to a large extent, and Gold will reverse only if the USD did the same. This can happen in any moment. Attached is the monthly chart of the UUP, which in my opinion is in a C wave of an extended flat fourth wave correction. Top of the first wave which should stop and reverse the decline is at 23.14, while yesterday’s closing price was at 23.51. With Gold hovering just below the A-C trendline of a perceived triangle at around 1350 as I am writing this, at the market open today UUP might hit 23.14. If there is a point in time to reverse both for Gold and USD, it is here and now. Stochastics is and has been in oversold territory for some time, which is significant on the monthly timeframe, and the price is now stretching the lower bands of both the Bollinger bands and the Donchian channel, respectively. Lara and others have been mentioning the importance of the “right look” several times. To me, the UUP chart very much looks like that a fifth wave is imminent. While I have been a student of markets for some time, I am far from having a 25-year experience like some members here. Any input or feedback regarding the UUP chart would be appreciated.
: )
: )
Yeah possibly now is the turning point of gold and USD. But if CNY vs USD down, CNY may also support gold hoing up also
No, not according to Lara. According to the math Gold and USD do not have a reliable correlation.
While I may be right or wrong, the math will not be wrong. That’s the thing about math, it is definitive.
Any two sets of data which have a correlation co-efficient that spends time between 0.5 and -0.5 are two sets of data that do not have a reliable correlation.
While Gold and USD are currently negatively correlated, the data absolutely shows that this correlation is unreliable. It may end at any time.
And so to make an assumption about one market based upon your analysis of the other, is to make an assumption on an unreliable relationship.
I’m not going to do that.
Hello !!! $7.09 more for gold to go for invalidating main count.
I am glad Lara has publish alt wave count.
Great Lara!!!
All currency charts are showing gold going much higher. Plus yield curve changing from narrowing to widenning.
These two fundamental at work for gold bullishness.
With the rise in price to a current high of 1346.35, which has surpassed 1343.97, we arrive at an interesting juncture.
The most probable event is that Primary E in the Main Count has not yet been reached, as Lara suggested. If the large triangle is correct, then the invalidation point to watch for will be 1357.09. The high of 1346.35 could be Minor 3 of Intermediate C of Primary E.
What if price exceeds 1357.09?
The single zigzag Second Count would be in play.
If we think out of the box and drop the triangle idea altogether, then much more bullish options may be called into play. But let’s just take it one step at a time.
A message to Nick:
I have realised that I promised to update my BitCoin analysis. I will do this hopefully tomorrow. I’m waiting for a bounce to enter short.
No worries, thanks
Lara, I am confused. In a previous analysis you labelled the downswing from the latest top as minute (magenta?) i (see attached, copied here from the previous analysis for your convenience), that is, a five-wave IMPULSE downwave.
Now, in the current analysis (bullish alternate) on the daily chart the same move, and thereby the same price action and chart structure is apparently labelled as a wave ii (magenta?), that is, a three-wave CORRECTIVE downwave.
By analogy, the same question can be asked about the chart structure what according to the main count is wave E, that is, a corrective 3-wave within a triangle, but in the current bullish daily alternate a (minute?/magenta?) i, within wave (3), that is, again, a 5-wave impulse.
How can the same structure be labelled as both impulse or corrective? Does either count not violate at least one Elliott rule? Please clarify. Thanks.
Often it is impossible to tell with certainty if a move is a three or a five. Zigzags and impulses can often look the same.
It all depends on how many of the small movements in are counted; which ones are and which ones aren’t.
I have the same problem at the weekly chart level.
Look at the wave up from the low in December 2015 to the high in July 2016. The first and third weekly charts count that as a three wave zigzag. The second weekly chart counts it as a five wave impulse.
This is new to me. I am aware that it is impossible to tell whether an unfolding move will end up being only a three or by adding two more waves end up being a five (although it’s place in the bigger structure should provide some clue). I thought that at least complete waves with clear top and bottom can be counted explicitly. If your explanation is correct, then it opens up Pandora’s box, that is, the possibility for countless arbitrary interpretations. This deducts a lot from the value of EW analysis as a predictive tool. Based on Prechter’s books that I have read so far I am not aware of such flexibility in the EW principle. If what you are saying is indeed true, then the EW analysis of any given chart can be massaged, twisted and tinkered according to the personal preference or prejudice of the analyst. I know that I am getting a little philosophical here, but your statement fundamentally shakes my belief system about the EW principle and pretty much degrades it to vudu magic. I have absolutely no intention to offend you in any ways and I very much appreciate your response, but I just cannot hide my disappointment. In the same time I am also trying to engage other members with apparently more experience (Dreamer, et al.) in a discussion in this regard, namely about the practical usefulness of EW analysis in market forecasting.
Occasionally a movement will be a very obvious three and cannot be counted as a five.
The problem will always remain that zigzags and impulses can look very similar.
You are not offending me by any means, but it is becoming rather clear to me that this membership may not be right for you. You seem to want more certainty than I or any other analyst can give you.
All of technical analysis is an exercise in probability. Elliott wave is not an exception.
Simply put, yes, it is frustrating. In the perfect world, there is only one correct Elliott Wave count and it’s the analysts job to find it. This “correct” count should not break any rules and should follow as many guidelines as possible while having “the right look”.
Unfortunately, there is almost always more than one “count” that qualifies. That is why Lara almost always has alternates and often ranks them by probability when one count has a clear advantage over another. This is also why she added Traditional Technical Analysis to her daily analysis a few years ago. It’s like a “second opinion” to support or question the EW counts.
If Elliott Wave was “easy” and always accurate, it would surely be more popular than it is. Most don’t understand the intricacies or find it too difficult and time consuming to apply. That said, when used by a highly skilled analyst, EW is likely the only analytical system that can provide detailed and highly accurate targets. That’s why Lara’s disciplined, detailed, and unemotional approach to analysis is so valuable.
Social mood and price movements are far more sophisticated than any one system or analysis type can always accurately predict. If there was one perfect analytical system, we would all be rich.
In summary, with a highly skilled analyst (Lara), all we can expect from Elliott Wave and TA is an “edge” to beat the markets. We also need to be disciplined in when we choose to buy and sell by patiently waiting for high probability setups such as “3rd waves”.
Hope this helps.
Surely E/W analysis is not the only tool one would use for trading. As Dreamer puts it, Lara’s analysis provides an edge. Beyond that it is up the individual how they trade. There has been nothing bearish about Gold price since the 1236 low barring a drop in between to 1308. RSI, StochRSI, momentum etc has remained bullish with little or no let up. Earlier last week sometime the 20dma crossed above 100dma (bullish cross?) and presently 50dma is creaping up and close to cross above 100dma (bullish cross when that happens?). Perhaps the only bearish sign or highly overbought is with CMP at 1347 above the weekly upper band which happens to be below the daily upper band. Let’s see how long Gold price can sustain these overbought levels before reversing. Imo lucky at this stage if Gold price gets to drop to 1335. GL Annapanna!
No, no, no Annapanna. You doesn’t get the real meaning and inplication of EW. EW is not strict, it is not give you a definite answer only, its wave pattern actually varies with the market action from time to time and record as a new chart pattern. Market changes from time to time, EW does either, this is the brilliant properties of EW. By your experience and skill, you can interpret the wave pattern according to your knowledge, experience, information and news. It does not give you a definite answer, just like the present situation, we look at the weekly chart or monthly to interpret the wave pattern, just like this case, I have a tendency to intrepret it in bullish view, but Lara’s analysis preferably a bearish interpret, both analaysis holds, but as the price already breached the weekly candles declining channel for 2 months, so I prefer interpret it as bullish look and then in detail to further to unflod its structurs in lower wave grade pattern to see whether price is walking as we expect. Sometimes, the wave pattern is very obvious, like 3rd wave, you could easily make money on that, but sometimes the B wave, too much variation, it could have several interpretation, you need to make decision by yourself which count you will take, bull or bear, depends on the real world market happenings, bond rate, usd index, currency rate, government actions and wills. EW is an excellent tools, you can use the SuperCycle or Cycle wave pattern to predict the price trend and have invalidation point to verify you analysis works or not,* the tool channel study* give you very useful way to make a decision. Upon my interpretation, if gold is on bearish , the price already fall earlier and do not let you escape rather than breach the declining channel and slowly climbing up. Price is in crucial moment, and market also in crucial moment, bond rate, price,USD. Gold price also waiting the market action in order to deprive its wave look.
I just want to share points of view and exchange ideas; please excuse me if my views have deficiency .
And so higher grade wave pattern is very important, as it could five you a prediction.
Just like last year July, I already have my Gold wave count in bullish interpretation, at that time price tries several times to fall below 1250 but price resist to fall further, Lara’s analysis give me a bear look, bear view if Gold running in bearish way, I keep this in my mind and does not border me. EW is wonderful, the only thing you do not understand the real meaning, the real implications of EW it is. You will saying that, how comes, EW counts always changing if the previous count fail. This is because you do not thoroughly understand EW. I have the same saying too when I began to learn EW 25 years ago.