
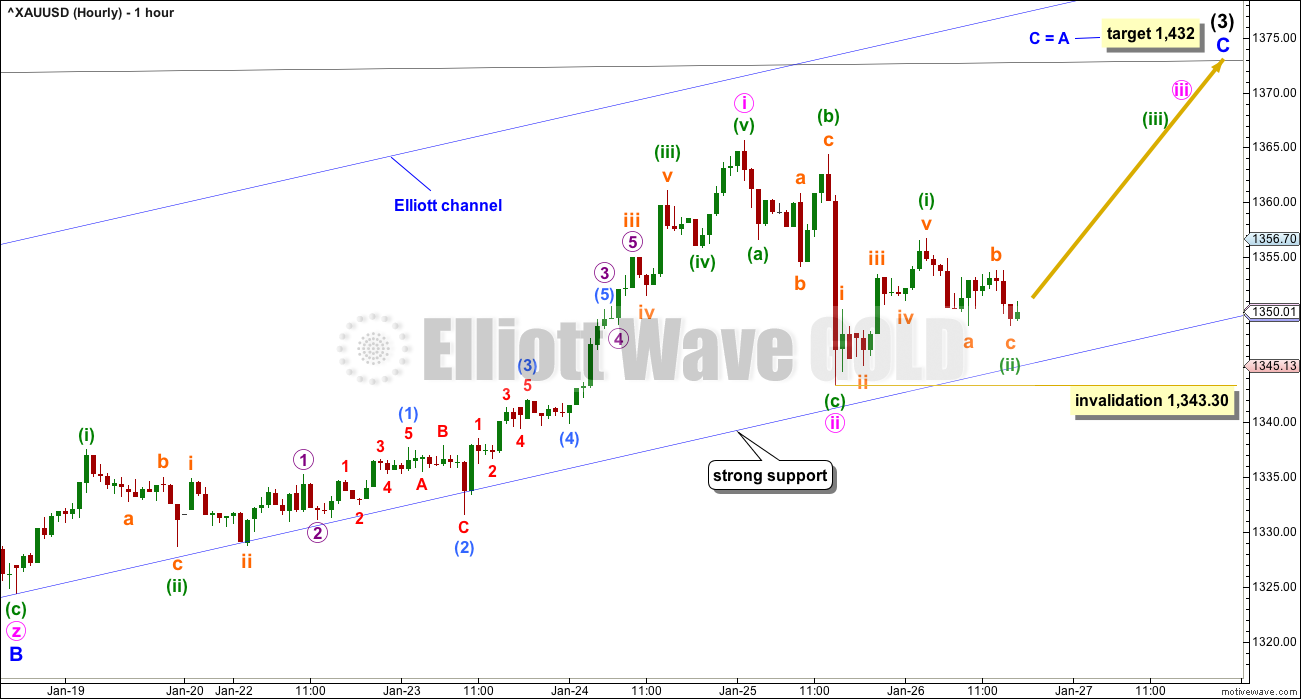
Downwards movement still remains contained within the channel and above the short term invalidation point. Sideways movement for Friday leaves the Elliott wave count the same.
Summary: The target for this upwards wave to end is at this stage still 1,432. Assume the upwards trend remains intact while price remains within the blue channel on the main daily and hourly charts.
If price breaks below the lower edge of the channel (which is drawn the same way on all charts), then expect a consolidation or pullback to last a few weeks has begun.
New updates to this analysis are in bold.
Grand SuperCycle analysis is here.
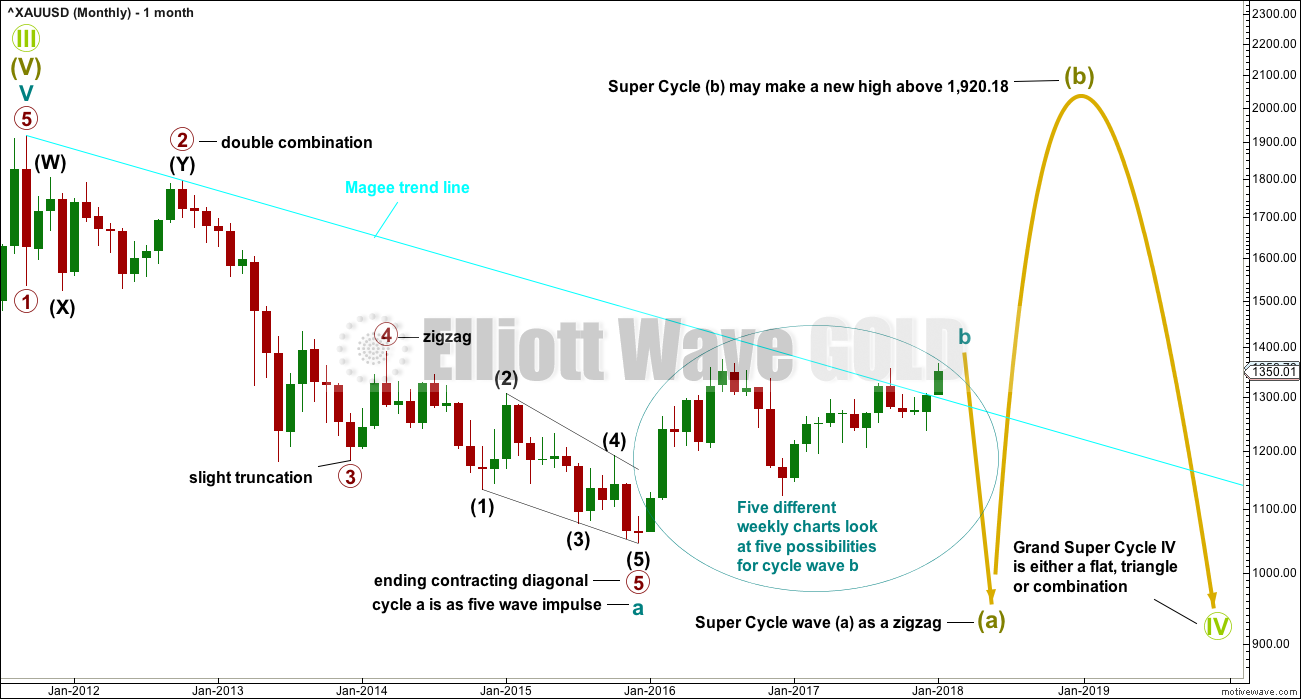
MAIN ELLIOTT WAVE COUNT
MONTHLY CHART
Click chart to enlarge.
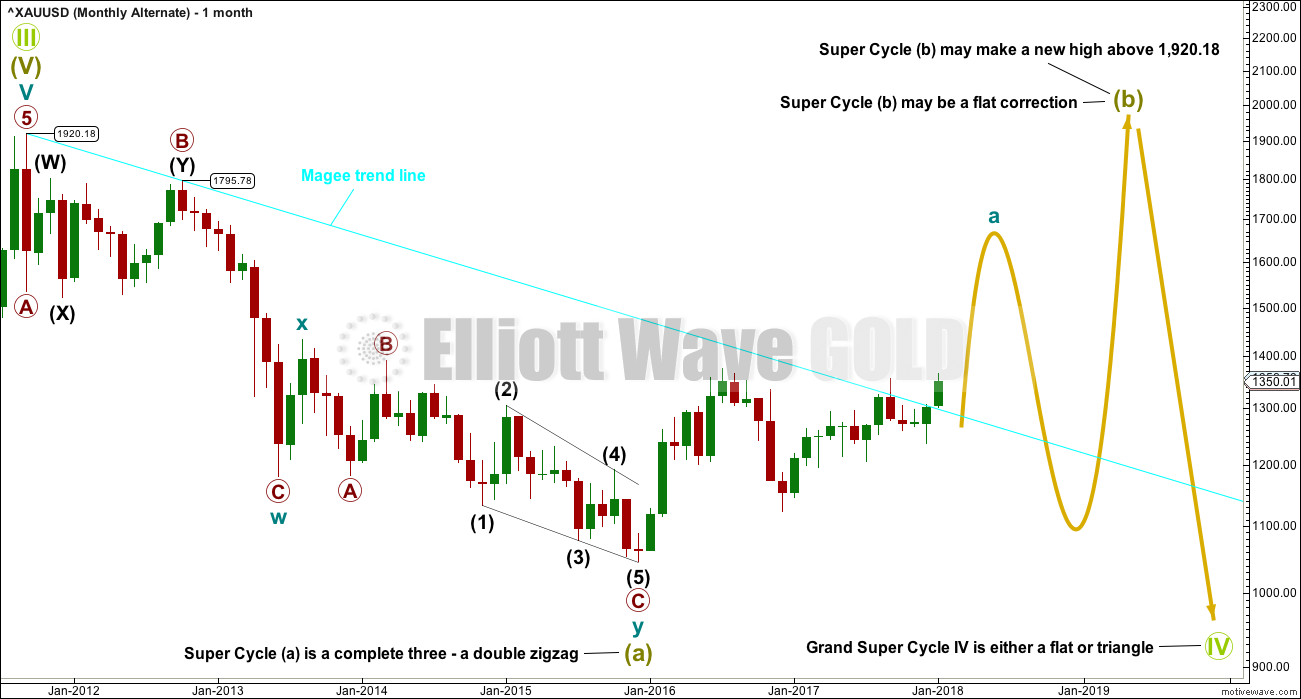
The main wave count will look at the large downwards wave from the all time high as a five wave impulse. For this main wave count, it will be labelled as cycle wave a, within a zigzag for Super Cycle wave (a).
It is also possible to move the degree of labelling up one degree and see this as a five wave structure complete for Super Cycle wave (a).
Both degrees of labelling would be valid, but in the interests of keeping charts and ideas to a manageable level only one shall be published at this stage. The difference will not be material for at least a year and probably more.
If cycle wave a is a five, then cycle wave b may not move beyond its start above 1,920.18.
Cycle wave b may be any one of more than 23 possible corrective structures. Five different ideas for cycle wave b will be considered this week on weekly charts.
When cycle wave b is complete, then cycle wave c downwards should unfold. Cycle wave c would most likely reach about equality in length with cycle wave a.
If this wave count unfolds as expected, then a huge zigzag downwards may be complete when cycle wave c completes. That would then be expected to be followed by a huge three wave structure upwards, most likely another zigzag for Super Cycle wave (b), which may make a new all time high.
The larger structure for Grand Super Cycle wave (IV) would be starting out with a huge zigzag downwards, indicating either a flat, triangle or combination.
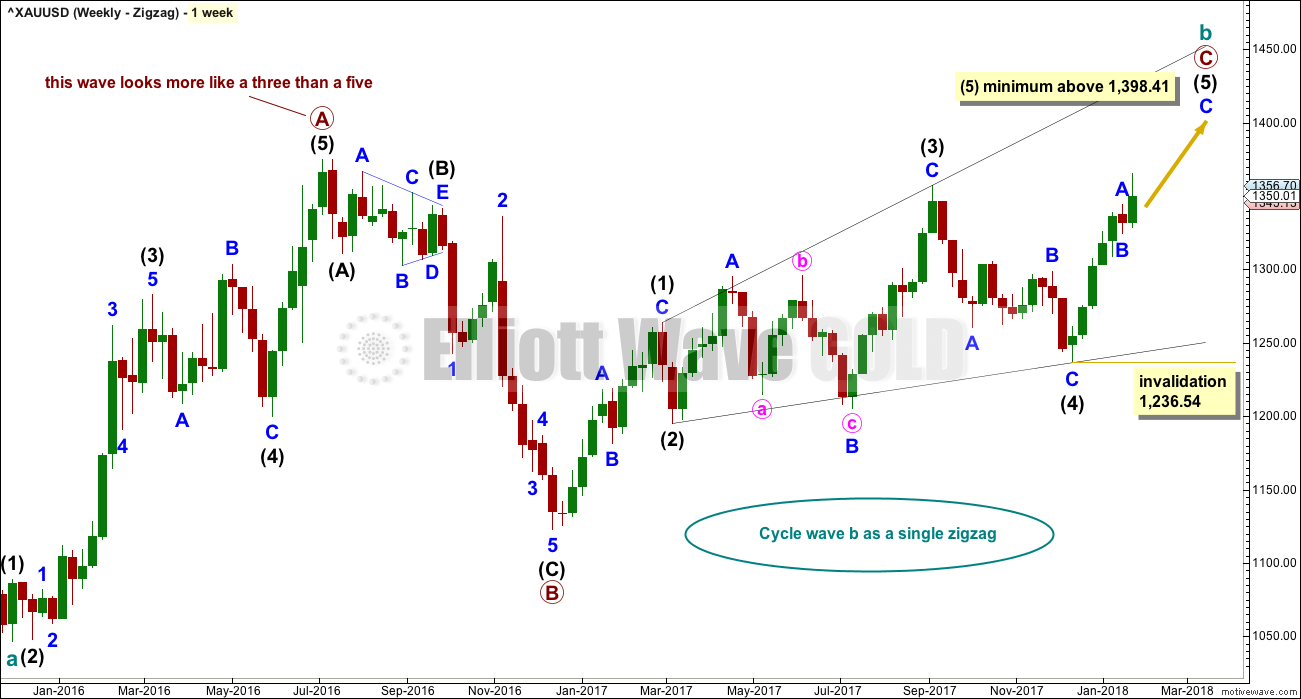
FIRST WEEKLY CHART
Click chart to enlarge.
Cycle wave b may be a single zigzag. Zigzags subdivide 5-3-5. Primary wave C must subdivide as a five structure and may be either an impulse or an ending diagonal. Overlapping at this stage indicates an ending diagonal. Today, this first weekly chart changes the way the diagonal of primary wave C is labelled. This has a better look.
Within an ending diagonal, all sub-waves must subdivide as zigzags. Intermediate wave (4) must overlap into intermediate wave (1) price territory. This diagonal is expanding: intermediate wave (3) is longer than intermediate wave (1) and intermediate wave (4) is longer than intermediate wave (2). Intermediate wave (5) must be longer than intermediate wave (3), so it must end above 1,398.41 where it would reach equality in length with intermediate wave (3).
Within the final zigzag of intermediate wave (5), minor wave B may not move beyond the start of minor wave A below 1,236.54.
This first weekly chart sees the upwards wave labelled primary wave A as a five wave structure. It must be acknowledged that this upwards wave looks better as a three than it does as a five. Alternate weekly charts below consider the possibility that it was a three.
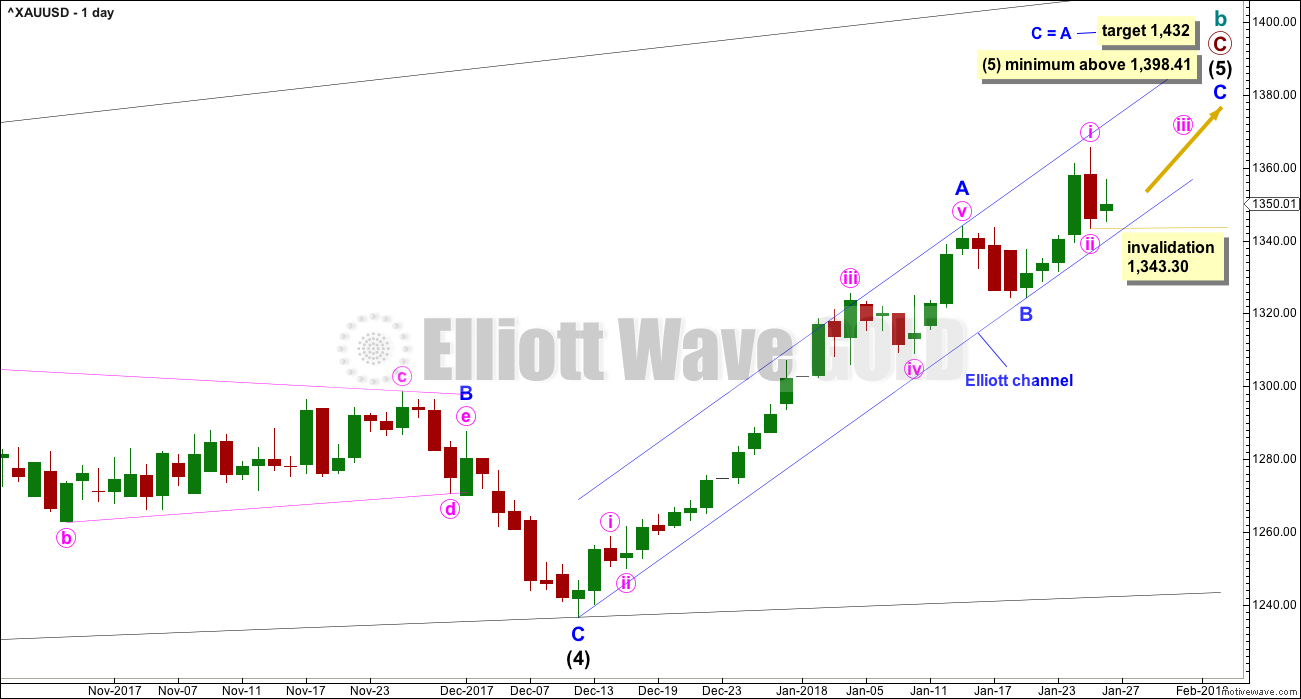
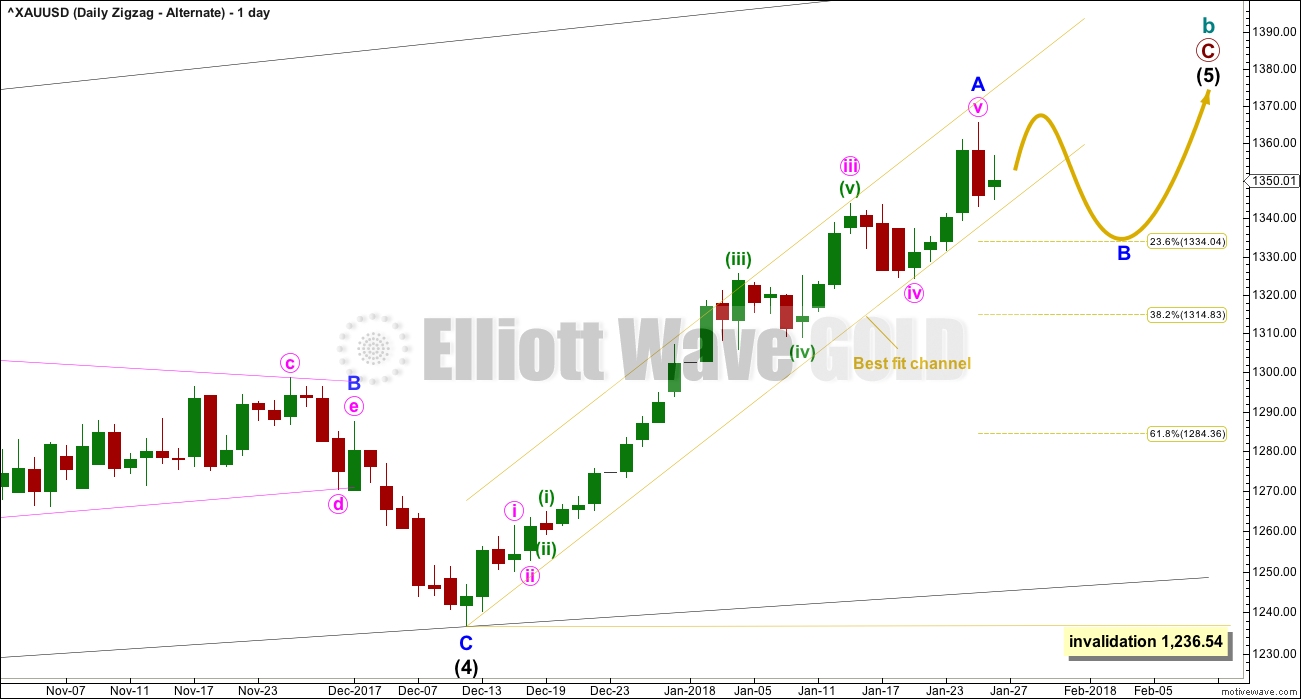
FIRST DAILY CHART
Click chart to enlarge.
Within the ending diagonal, intermediate wave (5) must sub-divide as a zigzag.
Because we should always assume the trend remains the same until proven otherwise, it would be safest at this time to assume the upwards trend remains intact while price remains within the blue channel. This is still the main wave count today for this reason.
Within the zigzag, minor waves A and B may be over already and minor wave C upwards may have begun. The target assumes the most common Fibonacci ratio between minor waves A and C.
Minor wave C must subdivide as a five wave structure, either an impulse or an ending diagonal. It would most likely be an impulse.
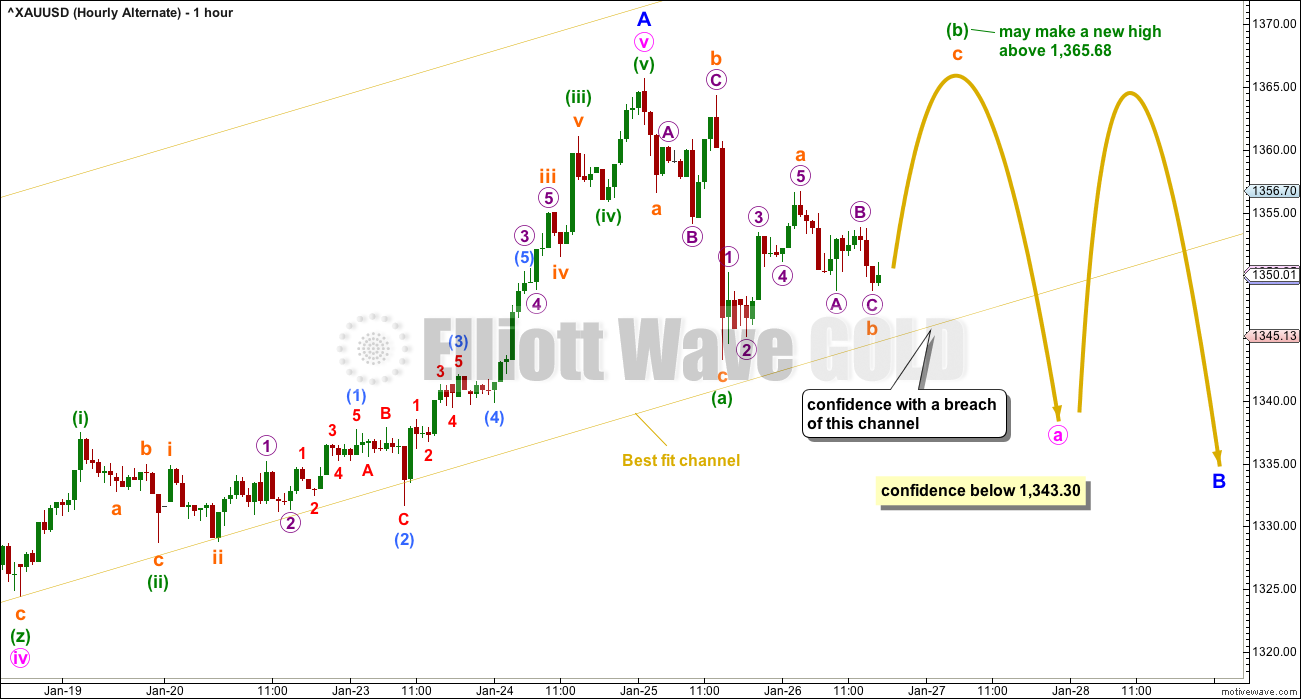
HOURLY CHART
Click chart to enlarge.
Minor wave C must subdivide as a five wave structure, and within it only minute waves i and now ii may be complete. Minute wave iii upwards may be just beginning.
Within minute wave iii, the correction for minuette wave (ii) may not move beyond the start of minuette wave (i) below 1,343.30.
If minor waves A and B are already both complete, then minor wave C should continue to find support at the lower edge of the Elliott channel. It may overshoot the upper edge, but it may not move below the channel.
ALTERNATE DAILY CHART
Click chart to enlarge.
It is also possible that only minor wave A has just completed at Thursday’s high. A breach of the yellow best fit channel (which is drawn the same on all daily charts) would see this alternate daily chart become the only daily chart.
Minor wave B may be a reasonably time consuming consolidation or a quicker sharper pullback within the upwards trend, and it may end about either of the 0.382 or 0.618 Fibonacci ratios (neither may be favoured).
Minor wave B may not move beyond the start of minor wave A below 1,236.54.
ALTERNATE HOURLY CHART
Click chart to enlarge.
It is still possible that minor wave B has only just begun, but it may be about a quarter of the way through already. The first wave down is now a completed three wave zigzag. Upwards movement at the end of Friday’s session has overlapped slightly back into the price territory of subminuette wave a within minuette wave (a). An impulse downwards may not be developing because the last wave up may not be a fourth wave correction as it would now overlap into what would be its counterpart first wave price territory.
If minor wave B is incomplete and has begun with a quick three wave structure downwards, then minor wave B may be a flat, combination or triangle. These are all sideways movements.
Minute wave a is labelled as incomplete and unfolding as a three wave structure. It may be a flat correction.
Within a flat correction, minuette wave (b) may make a new price extreme beyond the start of minuette wave (a).
This wave count expects choppy overlapping sideways movement next week for a typical consolidation within the upwards trend. This wave count absolutely requires a breach of the channel for confidence.
SECOND WEEKLY CHART
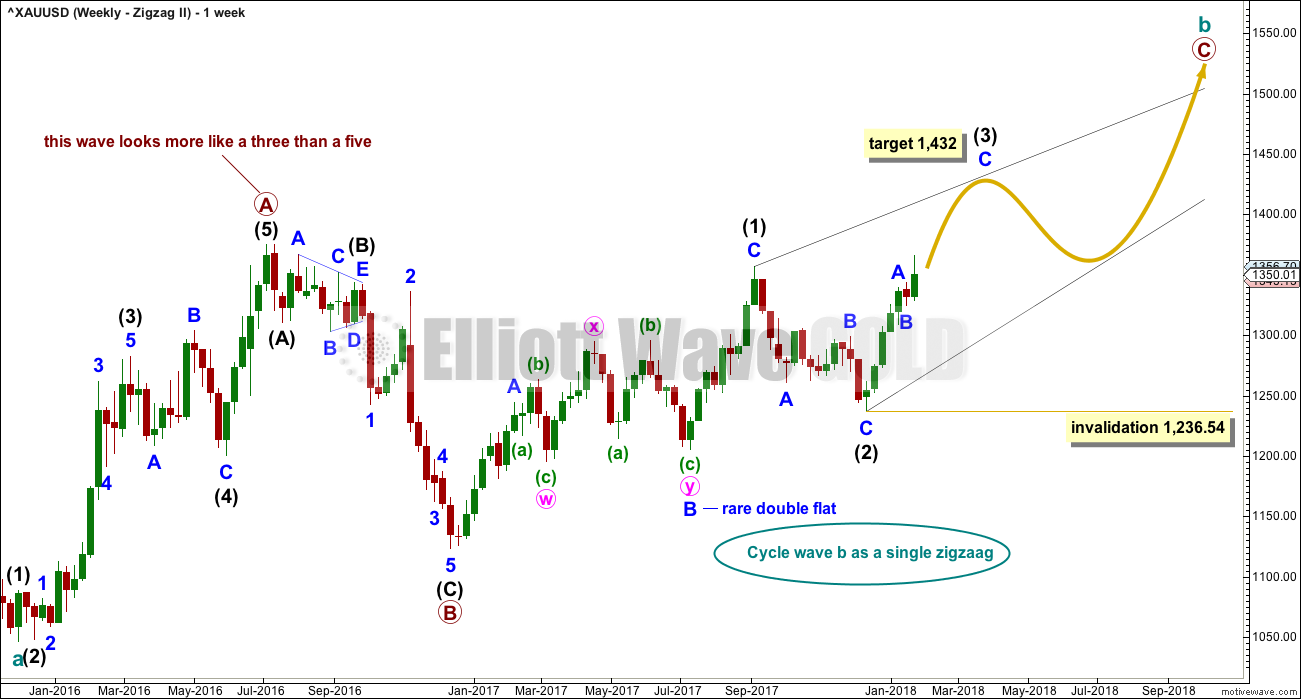
Click chart to enlarge.
This wave count still sees cycle wave b as a possible zigzag. But the structure of primary wave C within it is different.
Primary wave C is still seen as a diagonal but with only intermediate wave (1) over at the last high.
A zigzag upwards still is needed to complete; here, it is only intermediate wave (3) of a possible diagonal. When intermediate wave (3) is complete, then a major trend change would still be expected. Intermediate wave (4) should then unfold lower to overlap back into intermediate wave (1) price territory and be reasonably deep.
Second and fourth waves of diagonals commonly correct from 0.66 to 0.81 of the first and third waves.
Because this second weekly chart does not diverge from the first weekly chart in the target nor the expectation of a major trend change about that point, it will not be published on a daily basis at this time. When it begins to diverge in expectations, then it will again be published.
THIRD WEEKLY CHART
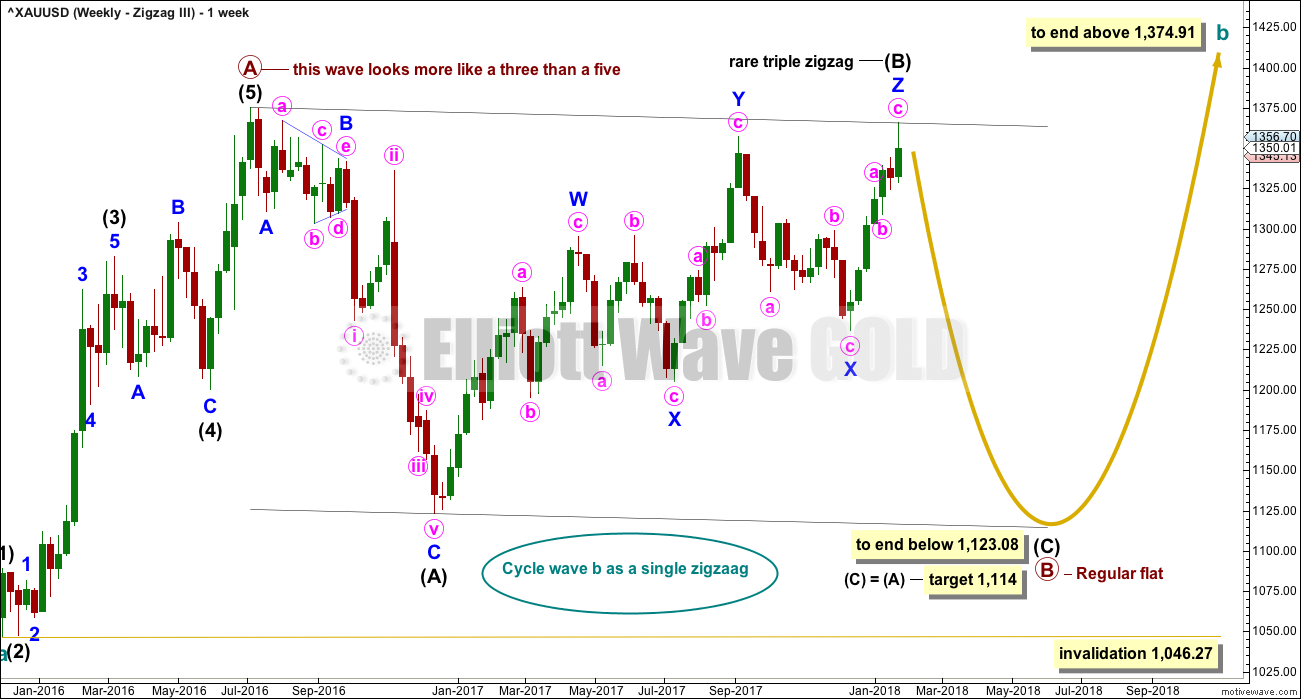
Click chart to enlarge.
Primary wave B may be incomplete.
This weekly chart still looks at cycle wave b as a zigzag, but primary wave B within it an incomplete regular flat correction.
This wave count still suffers from the problem of trying to see primary wave A as a five. If primary wave A was a five wave structure, then primary wave B may not move beyond its start below 1,046.27.
If primary wave B is an incomplete regular flat correction, then within it intermediate wave (B) may be now just complete as a very rare triple zigzag. In my 10 years now of Elliott wave analysis I have only ever seen two triple zigzags before. This may be the third. The rarity of this structure must necessarily reduce the probability of this wave count.
A new low below 1,236.54 would add some confidence to this wave count.
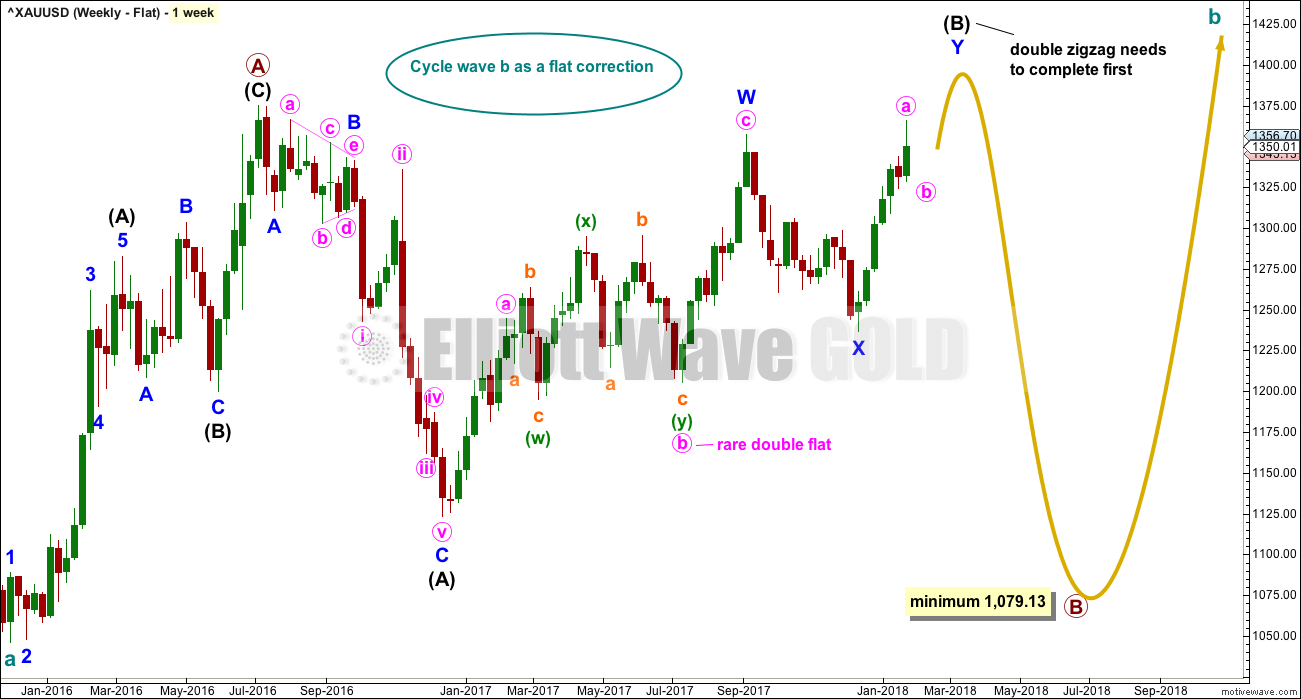
FOURTH WEEKLY CHART
Click chart to enlarge.
Cycle wave b may still be completing as a flat correction.
Primary wave A may be a complete zigzag within the flat correction. This has a better look than trying to see this upwards wave as a five, although both ideas are valid.
If cycle wave b is a flat correction, then within it primary wave B must retrace a minimum 0.9 length of primary wave A at 1,079.13 or below. Thereafter, primary wave C upwards may begin and should move above the end of primary wave A at 1,374.91 to avoid a truncation.
Primary wave B may make a new low below the start of primary wave A at 1,046.27 as in an expanded flat. These are very common structures.
The only problem in this wave count is the double flat of minute wave b within minor wave W, within intermediate wave (B). Double flats are rare structures, as rare as triple zigzags.
If intermediate wave (B) is a double zigzag, then within the first zigzag labelled minor wave W, minute wave b lasted 22 weeks and shows up clearly on the monthly chart. Minute wave b within minor wave Y should also last at least a few weeks for the double zigzag to have the right look.
The purpose of a second zigzag in the double is to deepen the correction when the first zigzag does not move price deep enough. To achieve this purpose the second zigzag in the double usually ends substantially beyond the end of the first zigzag. Minor wave Y should be expected to move higher to achieve its purpose.
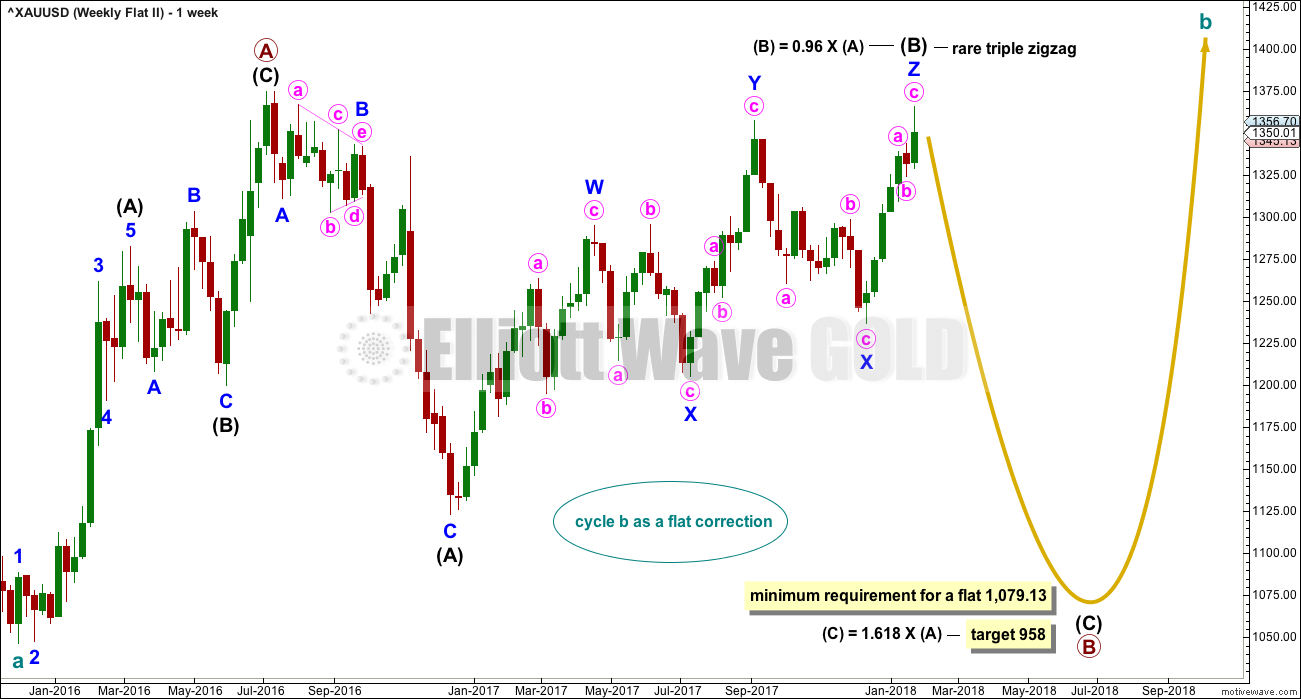
FIFTH WEEKLY CHART
Click chart to enlarge.
This fifth weekly chart still sees cycle wave b as a flat correction, and within it intermediate wave (B) may be a complete triple zigzag. This would indicate a regular flat as intermediate wave (B) is less than 1.05 the length of intermediate wave (A).
If cycle wave b is a flat correction, then within it primary wave B must retrace a minimum 0.9 length of primary wave A at 1,079.13 or below. The most common length of B waves within flats is from 1 to 1.38 times the length of the A wave. The target calculated would see primary wave B end within this range.
ALTERNATE HISTORIC ELLIOTT WAVE COUNT
MONTHLY CHART
Click chart to enlarge.
The large wave down from September 2011 to November 2015 may also be seen as a three wave structure, a double zigzag.
If the big wave down is a multiple three wave structure, then Grand Super Cycle wave (IV) may be either a flat or triangle. It may not be a combination because they may not have multiples within multiples.
If Grand Super Cycle wave (IV) is a flat correction, then within it Super Cycle wave (b) must retrace a minimum 0.9 length of Super Cycle wave (a) at 1,832.79.
If Grand Super Cycle wave (IV) is a triangle, then there is no minimum requirement for Super Cycle wave (b). There is only the structural requirement that it should be a three wave structure.
Super Cycle wave (b) would most likely be a single or multiple zigzag and would most likely be reasonably deep.
If cycle wave a within Super Cycle wave (b) is a three wave structure, then Super Cycle wave (b) may be a flat correction. It could also be a triangle, but that would not be able to meet the expected depth.
SECOND ALTERNATE HISTORIC ELLIOTT WAVE COUNT
MONTHLY CHART
Click chart to enlarge.
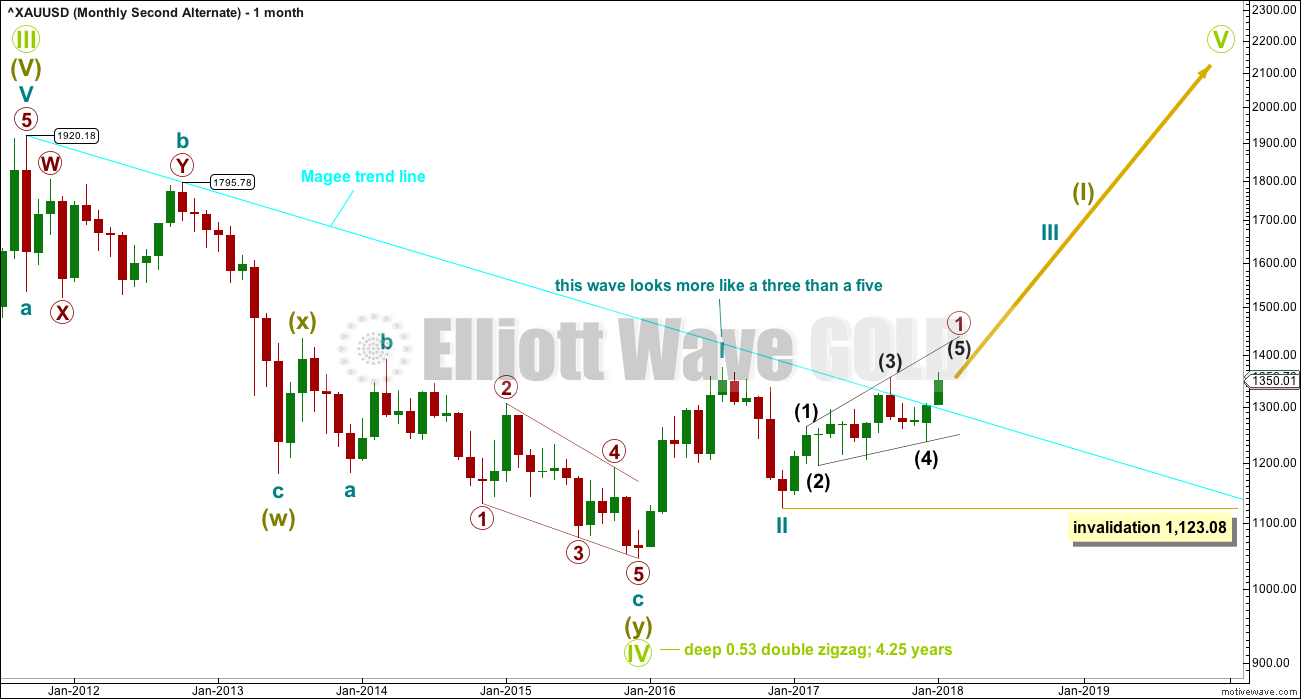
It is possible that Grand Super Cycle wave IV is over. It would be rather brief though at only 4.25 years. However, Grand Super Cycle wave II in the Grand Super Cycle analysis is expected to have lasted only about 8 years, so this possibility should be accepted.
If there has been a trend change at Grand Super Cycle degree in the end of November 2015, then a new five wave structure upwards should develop from there at the monthly chart level.
Gold will often form long slow basing movements. Its first waves can be short and its second waves long lasting and deep.
Cycle waves I and II may be complete within Super Cycle wave (I).
Within cycle wave III, primary wave 1 may be unfolding as a leading diagonal. When it is complete, then primary wave 2 may not move beyond the start of primary wave 1 below 1,123.08.
TECHNICAL ANALYSIS
WEEKLY CHART
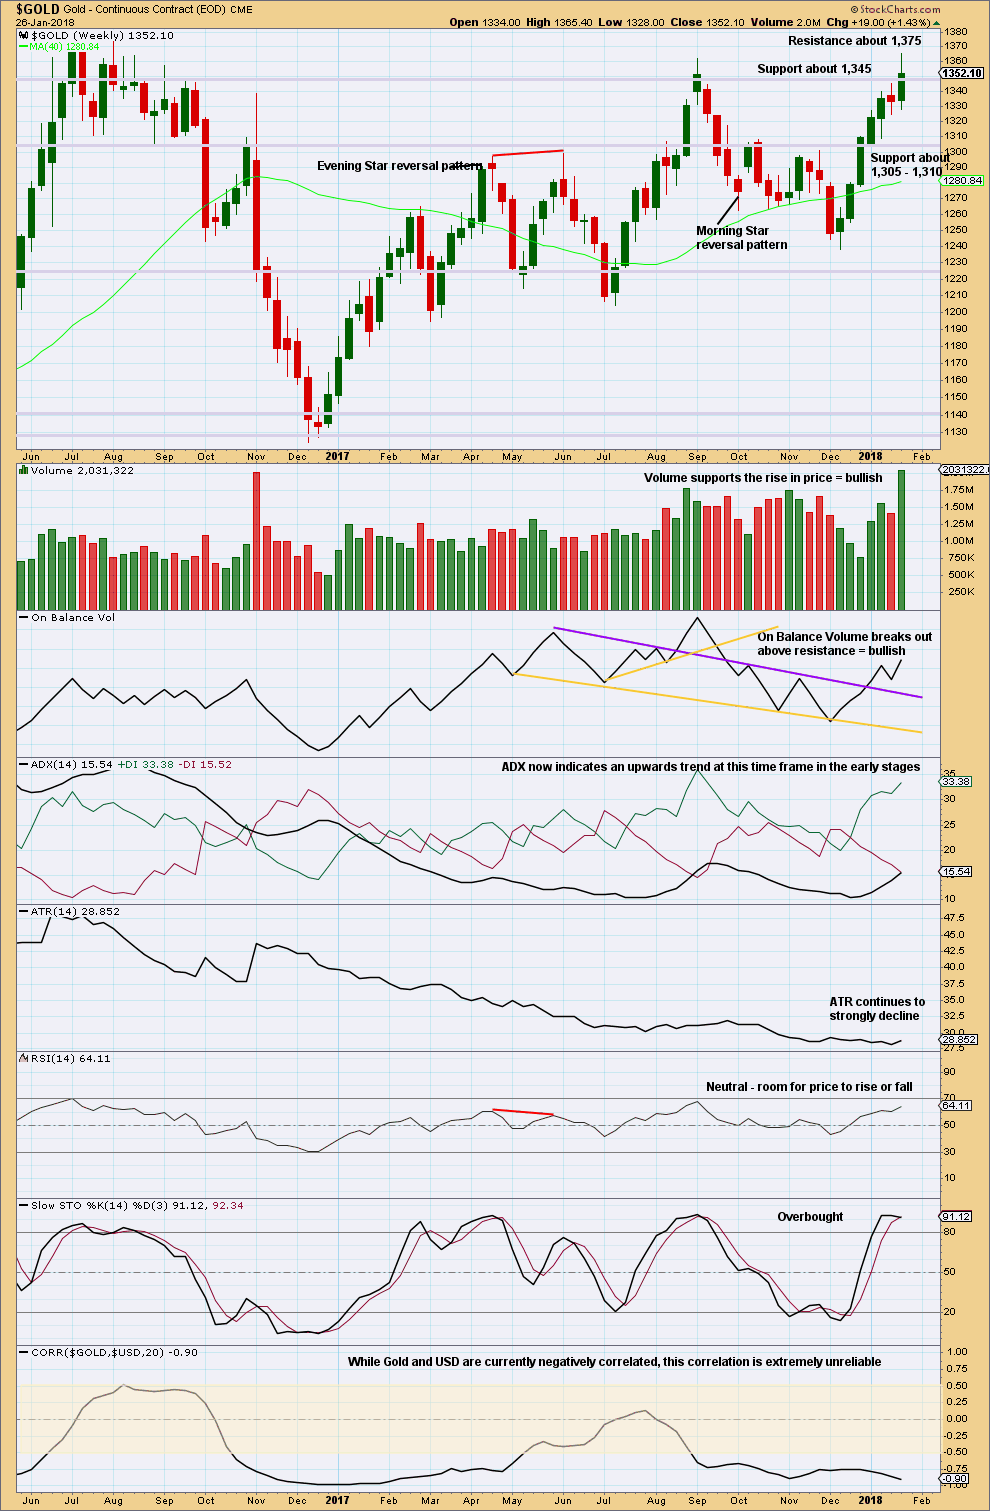
Click chart to enlarge. Chart courtesy of StockCharts.com.
Prior resistance about 1,345 may now be support. This upwards trend may still be in the relatively early stages.
Markets do not move in straight lines when markets trend; there are corrections and consolidations within the trend.
On Balance Volume, ADX and RSI all indicate more upwards movement is possible and looks likely.
The negative correlation between Gold and the USD disappeared for about four months as recently as early May 2017 to late August 2017. While these two markets are currently strongly negatively correlated, they may not be so in the near future. The correlation may disappear at any time. Looking at the correlation co-efficient on the monthly chart shows periods of up to a year where these two markets are not correlated, usually when Gold is consolidating.
Currently, Gold is still within a huge consolidation range delineated by resistance about 1,375 and support about 1,195 to 1,235. With price now closing in on a resistance zone and Stochastics overbought, a downwards swing or pullback is possible soon. If price can break above resistanace at 1,375, and if it does so with support from volume, then a classic upwards breakout would be indicated.
Within this large consolidation, it is now this completed upwards week that has strongest volume. This suggests an upwards breakout from the huge consolidation is now more likely than downwards.
DAILY CHART
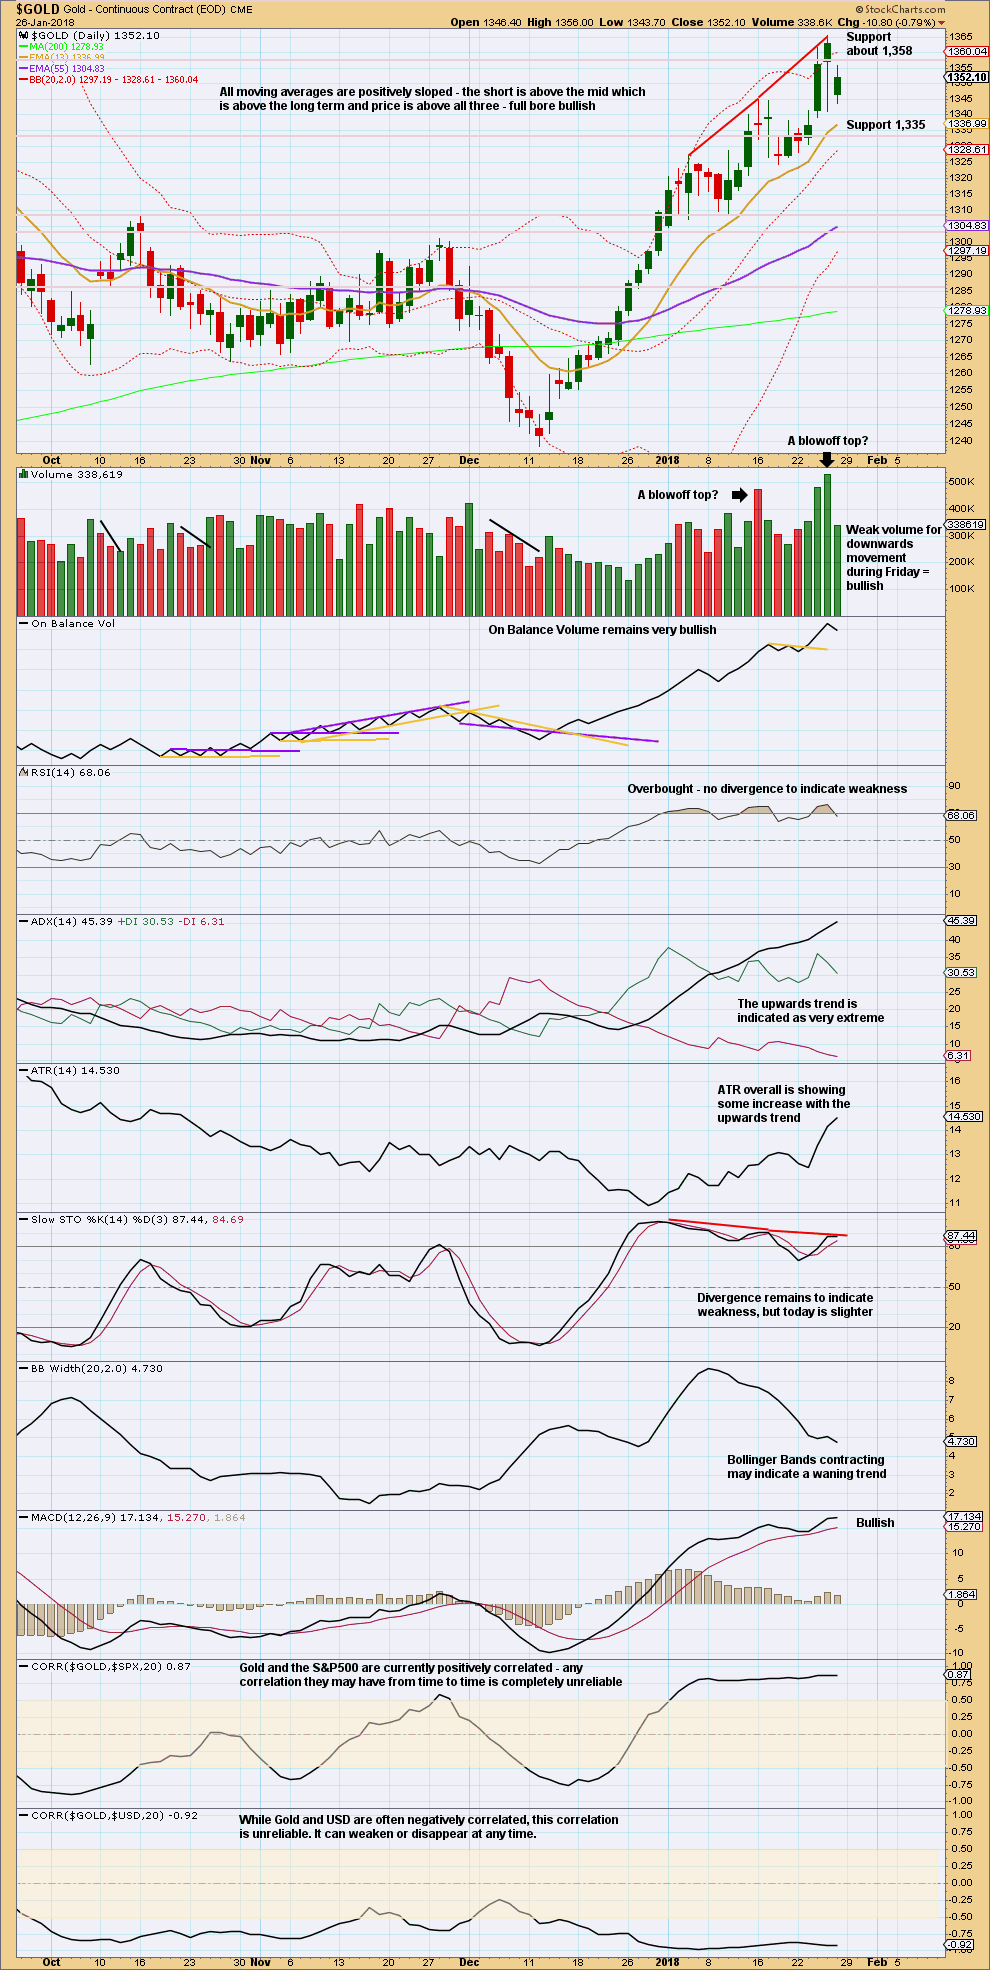
Click chart to enlarge. Chart courtesy of StockCharts.com.
The upwards trend is still stretched and extreme, but there is still not enough weakness evident to indicate it looks likely to end here.
The short term volume profile is still bullish.
GDX DAILY CHART
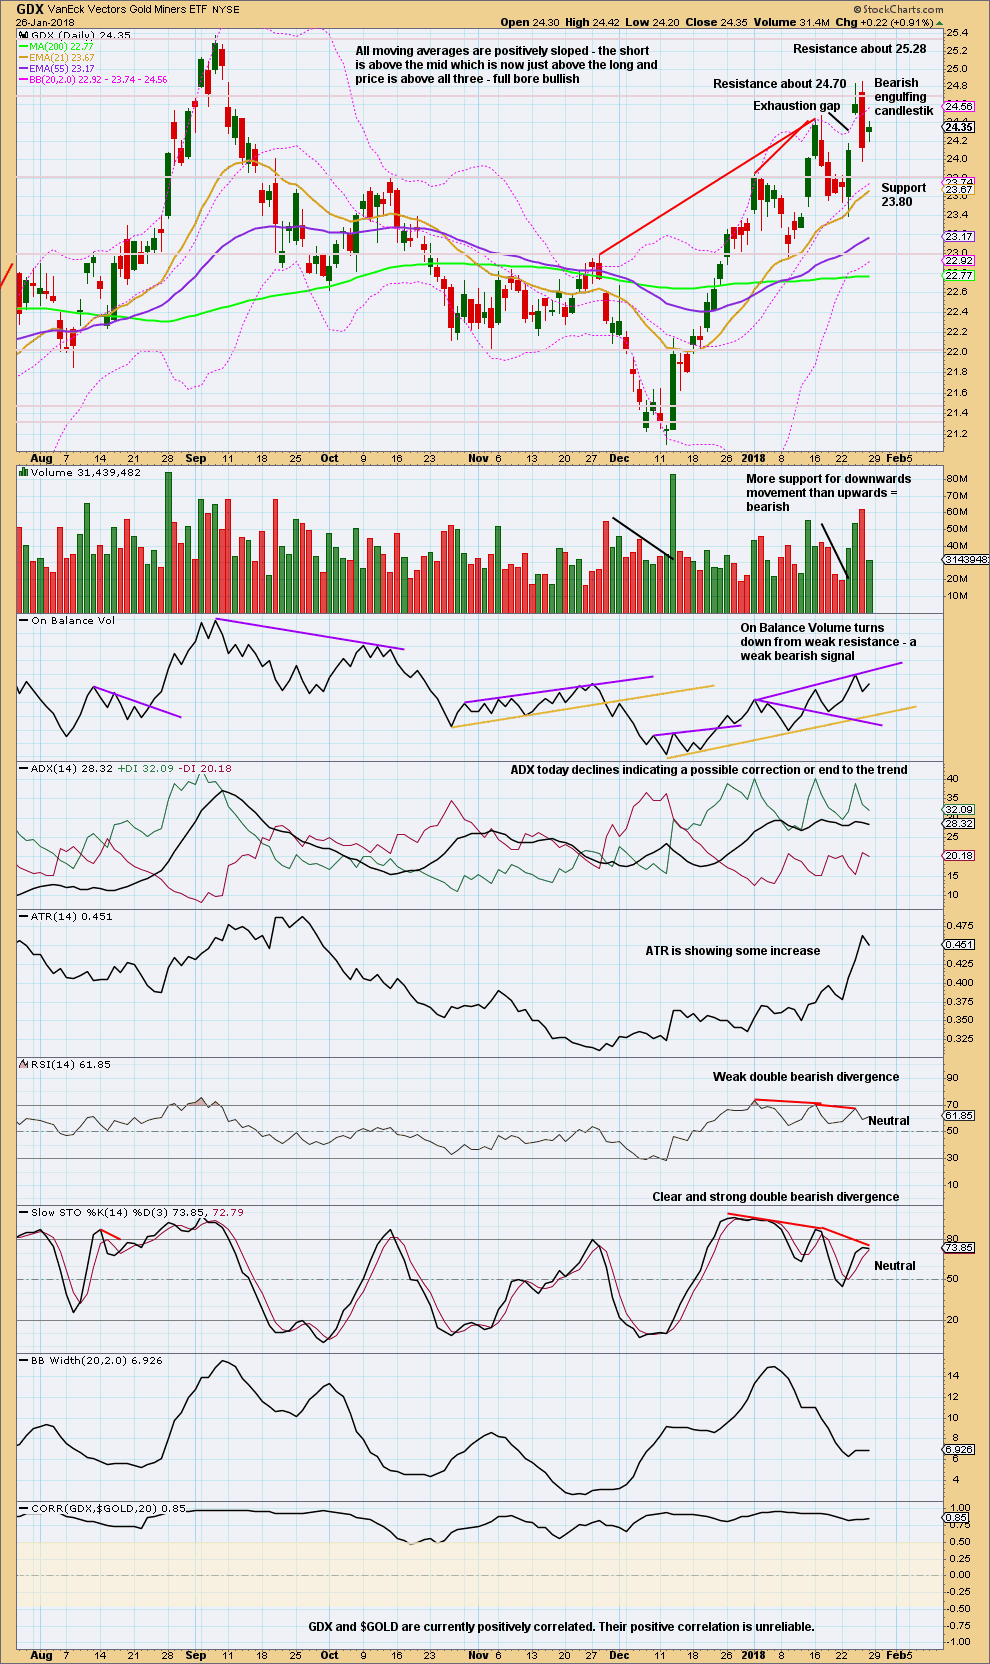
Click chart to enlarge. Chart courtesy of StockCharts.com.
The strong bearish engulfing candlestick must change the analysis of GDX from bullish to neutral or bearish.
Published @ 07:20 p.m. EST on 27th January, 2018.
An interesting mix of view points here as to which count members think may be the right one.
I’m not going to try and pick a winner. But I do have to pick one or two weekly charts only to publish. There is just no way I can manage an analysis this long each day, and it’s too much to expect members to read through each day.
And so I’ll pick a bull and a bear, and I’ll pick based upon probability in terms of EW; least rare structures, best fit.
My pick does not mean the other alternates may not happen. And I’ll publish them again if they begin to diverge from the two I’m publishing.
I hope that makes sense to members. I think it’s a logical approach to making this analysis manageable and accessible.
Alt Daily?
Yes. Along with the alt hourly 🙂
Looks like a double zigzag for minor B
After going thru Lara’s excellent analysis I believe gold is following second alternative Monthly chart where Grand Super cycle wave IV is complete.
It is matching with Kondratief wave cycle which is in up turn for next 8 years.
All commodities are going to go up.
https://www.investopedia.com/terms/k/kondratieff-wave.asp
I think the Weekly flat could be playing out and this is minute b. i.e.. this is following the US Dollar index which is in a 4th wave up to be followed by a final 5th down.
For myself the ideal running path is in between 4th and 5th alternatives.
Thanks for all contributions, especially Lara’s indepth illustration
Impressive amount of information and in-depth analyses. Also a credit to High level of interactions between a several members with expert like knowledge, to share and to debate.
I am more inclined to follow Lara’s view of correlation. Hers is the definition from statistics. I reproduce below an excerpt from a statistics textbook meant as an elementary course.
——————————————————————————
In statistics, the correlation coefficient r measures the strength and direction of a linear relationship between two variables on a scatterplot. The value of r is always between +1 and –1. To interpret its value, see which of the following values your correlation r is closest to:
Exactly –1. A perfect downhill (negative) linear relationship
–0.70. A strong downhill (negative) linear relationship
–0.50. A moderate downhill (negative) relationship
–0.30. A weak downhill (negative) linear relationship
0. No linear relationship
+0.30. A weak uphill (positive) linear relationship
+0.50. A moderate uphill (positive) relationship
+0.70. A strong uphill (positive) linear relationship
Exactly +1. A perfect uphill (positive) linear relationship
Thanks Alan and Lara. This agrees with the StockCharts definition. It all comes down to how you want to interpret and use the data.
Lara, I realize that you are tired of discussing the topic of the $USD and Gold Correlation, but I’d like to bring it up again, using the StockCharts Correlation tool for discussion. I think there may be a better way to describe the Correlation between Gold and the USD.
For me, and maybe others, the way you describe the correlation tool on your charts is not the same as StockCharts describes the tool in their “ChartSchool”
One of the statements found here
http://stockcharts.com/school/doku.php?st=correlation&id=chart_school:technical_indicators:correlation_coeffici
is “The Correlation Coefficient tells us the relationship between two securities. Over a given time period, the two securities move together when the Correlation Coefficient is positive. Conversely, the two securities move in opposite directions when the Correlation Coefficient is negative.”
There really isn’t a “No Correlation” zone from .5 to -.5. The only place where there is truly “No Correlation is at Zero. It’s really a sliding scale as the number moves away from Zero in either direction. The higher the number above zero, the Stronger the Positive Correlation and the lower the number below zero, the Stronger the Negative Correlation.
I tried to illustrate this point showing Example 1 and 2 on the attached Weekly Charts. I wanted to do this on a monthly chart, but not being a StockCharts member, I had to settle for weekly.
The other point I’d like to make is that when you look at the longer term Monthly Chart (I grabbed a copy from your video), you see that since 2011, there are only 3 brief periods of time when Gold and the USD were not Negatively Correlated to some degree.
So, in summary, I think the $USD and Gold have a fairly consistent record of Negative Correlation on the long term monthly chart that is pretty reliable. It can also be said that the Strength of the Negative Correlation is unreliable because it consistently oscillates from Weak to Strong.
Thanks for your consideration.
I think Alan has answered this question well.
When I did my BSc we used a correlation co-efficient, and so I am used to using it as a statistical tool in the way I was taught.
You are right that between 0.5 to -0.5 there may be a weak relationship, but the problem with that is with a weak relationship it could be due to chance and not because the one set of data is influenced by the other.
And that only perfectly at 0 are the two sets of data not correlated.
It is the issue of the weak relationship and possibility it is due to chance. That’s how it’s used in Biology anyway and how I learned to use it. It’s how it’s used as a statistical tool.
Lara, just got through a marathon session of your 3 videos, over 1.5 hours. You really put a lot of effort into this. 👍 😅 🤩 Thank you very much!
Even though the dreaded triangles are gone, we now have even more complex mind blowing counts to keep track of. 🤯
PS: If annapanna was still around, even she would be impressed. I really liked the injection of new interaction in your comments section, but agree that the tone was abrasive and overly presumptuous.
I’m glad you have the time to watch it all!
I think it’s a bit too much. But I also think it had to be done at least once at this point.
If any of these alternates are invalidated then I’ll update this marathon. But goodness, neither I nor you all could manage this every day!