
A new high above 1,287.61 switched the analysis to bullish. At that time, two wave counts had a target about 1,308. This target has been exceeded so far up to 1,325.56.
Summary: Assume the trend remains up while price remains within the channel on the hourly charts. The target is at 1,340.
If price breaks below the channel, assume a multi week consolidation has arrived for a B wave.
All wave counts expect that price may not make a new high above 1,357.09.
New updates to this analysis are in bold.
Last monthly charts for the main wave count are here, another monthly alternate is here, and video is here.
Grand SuperCycle analysis is here.
MAIN ELLIOTT WAVE COUNT
WEEKLY CHART
Click chart to enlarge.
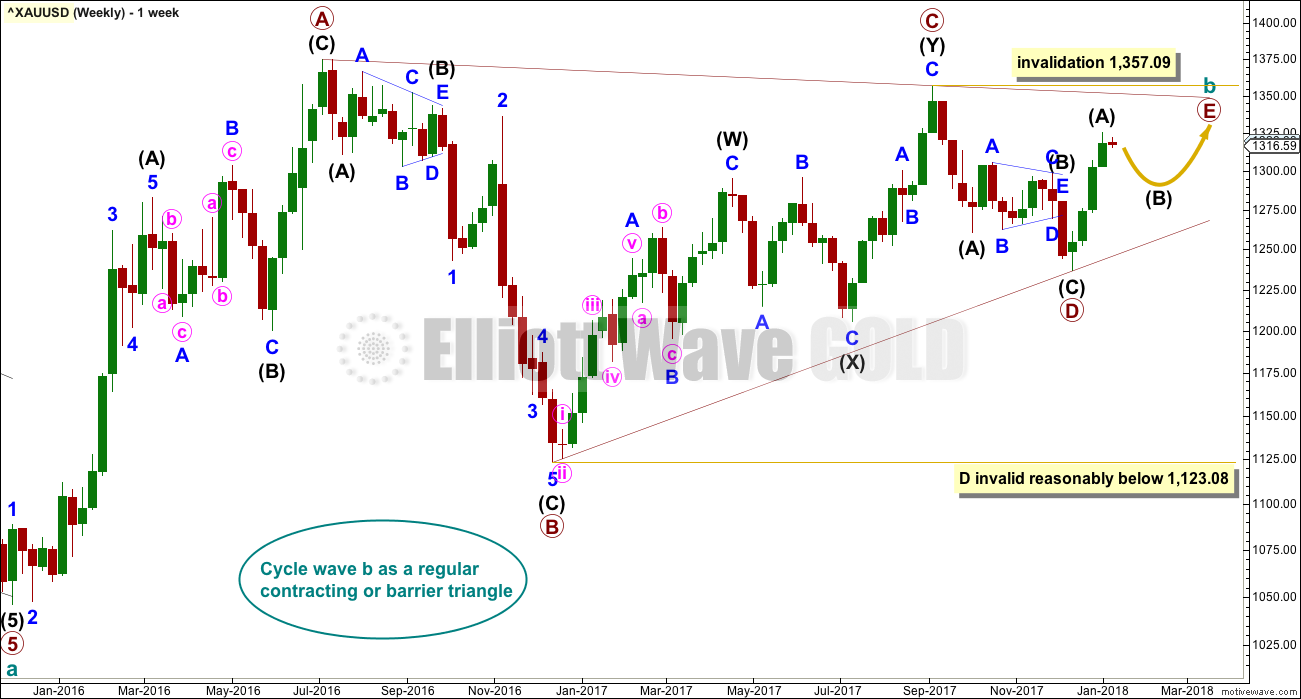
All wave counts expect that Gold completed a large five down from the all time high in November 2011 to the low of December 2015, which is seen on the left hand side of both weekly charts.
If this analysis is correct, then the five down may not be the completion of the correction. Corrective waves do not subdivide as fives; they subdivide as threes. The five down is seen as cycle wave a within Super Cycle wave (a).
All wave counts then expect cycle wave b began in December 2015.
There are more than 23 possible corrective structures that B waves may take. It is important to always have multiple wave counts when B waves are expected.
It looks unlikely that cycle wave b may have been over at the high labelled primary wave A. Primary wave A lasted less than one year at only 31 weeks. Cycle waves should last one to several years and B waves tend to be more time consuming than other Elliott waves, so this movement would be too brief for cycle wave b.
This wave count looks at cycle wave b to be most likely a regular contracting triangle.
The triangle trend lines have a normal looking convergence. Primary wave D now looks fairly likely to be complete, and it looks like an obvious three wave structure at the weekly chart level.
Primary wave E should also be most likely to look like an obvious three wave structure at the weekly and daily chart levels. That means that within it intermediate wave (B) should be fairly time consuming.
Primary wave E would most likely end reasonably short of the upper A-C trend line. If it does not end there, then the next less likely place for it to end would be with a slight overshoot of the A-C trend line.
When primary wave E is complete, then the whole structure for cycle wave b may be complete. At that stage, a downwards breakout would be expected.
Primary wave E may not move beyond the end of primary wave C above 1,357.09.
FIRST DAILY CHART
Click chart to enlarge.
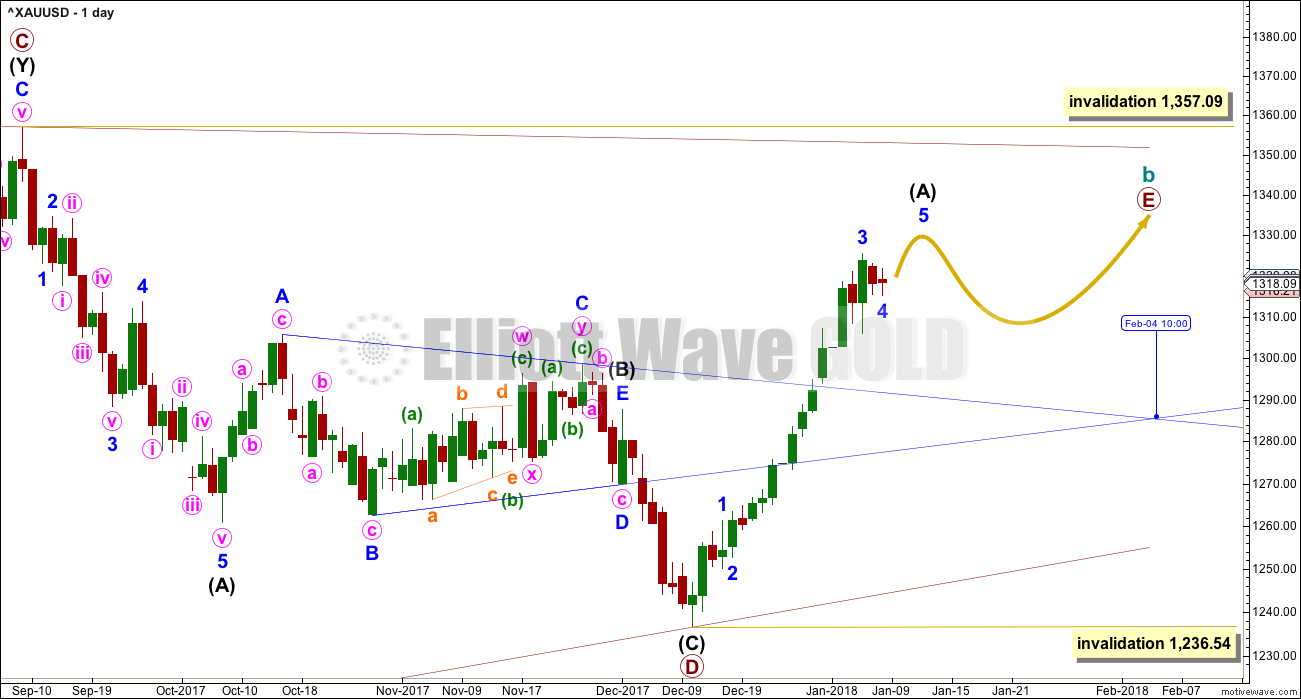
This first wave count follows on directly from the weekly chart above. It looks at primary wave E underway as a single zigzag. Zigzags subdivide 5-3-5. So far only wave A of the zigzag of primary wave E may be almost complete.
Within the zigzag, intermediate wave (A) may require only a final fifth wave upwards. While price remains within the best fit channel on the hourly charts below, it should be expected that the trend remains up. There is no evidence of a trend change yet.
When intermediate wave (A) is complete, then intermediate wave (B) may unfold over several weeks.
Thereafter, intermediate wave (C) should move higher to end above the end of intermediate wave (A) to avoid a truncation.
The trend lines of the triangle of intermediate wave (B) within primary wave D are extended outwards. The point in time at which triangle trend lines cross over will often see a trend change (although not always a major trend change). That may be the point in time at which primary wave E ends, which at today’s calculation would be on the 4th of February.
2 HOURLY CHART
Click chart to enlarge.
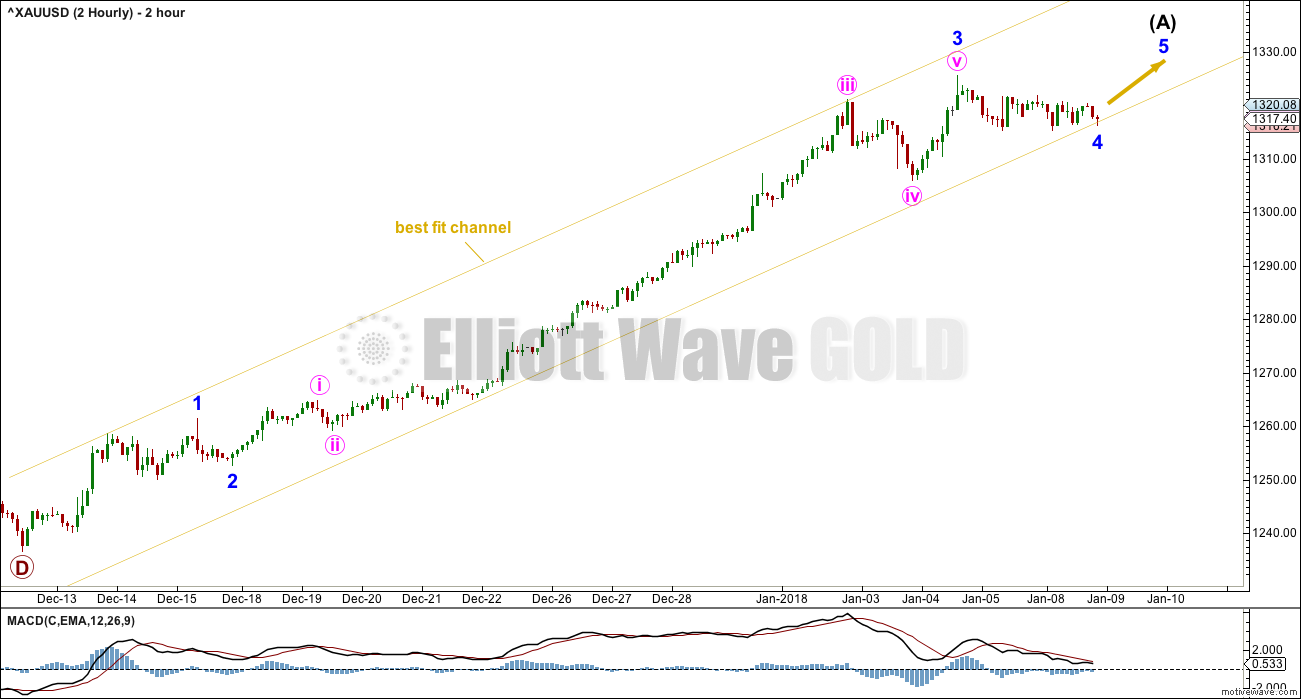
The 2 hourly chart is provided so that all of intermediate wave (A) may be seen. Copy the best fit channel to hourly charts.
The bottom line today is that while price remains within this channel there has been no evidence of a trend change. Assume the trend remains the same, upwards, until proven otherwise.
When price breaks below the lower edge of the channel with at least one full hourly candlestick below and not touching the lower edge, preferably with clear downwards movement (not sideways), then that shall provide some evidence of a trend change.
HOURLY CHART
Click chart to enlarge.
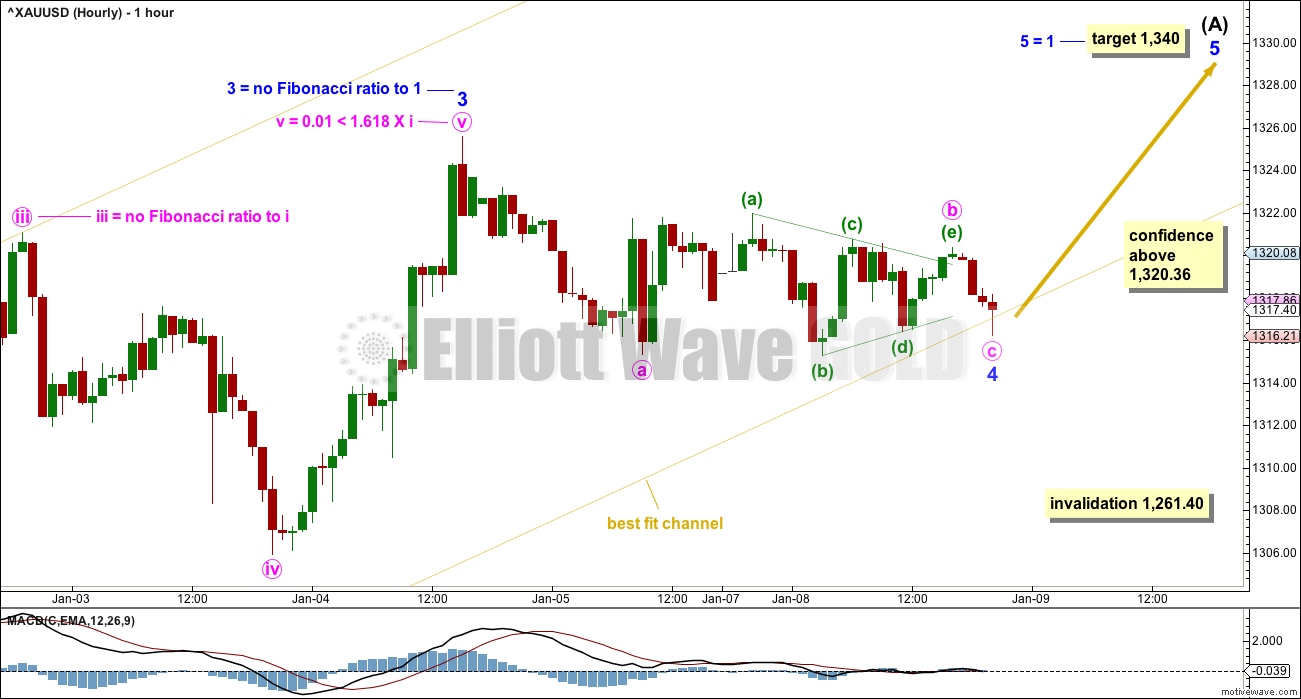
This first hourly chart follows on from the daily chart above and looks at the end of intermediate wave (A).
Fibonacci ratios are provided for this main wave count and the alternate below, so that members may see the difference. The alternate has better ratios, but this main wave count does have one particularly close ratio for minute wave v.
Members may have some confidence in this wave count and the target if price makes a new high above 1,320.36.
Minor wave 4 may not move into minor wave 1 price territory below 1,261.40. However, this wave count would be discarded long before the invalidation point is reached if price breaks below the lower edge of the best fit channel.
ALTERNATE HOURLY CHART
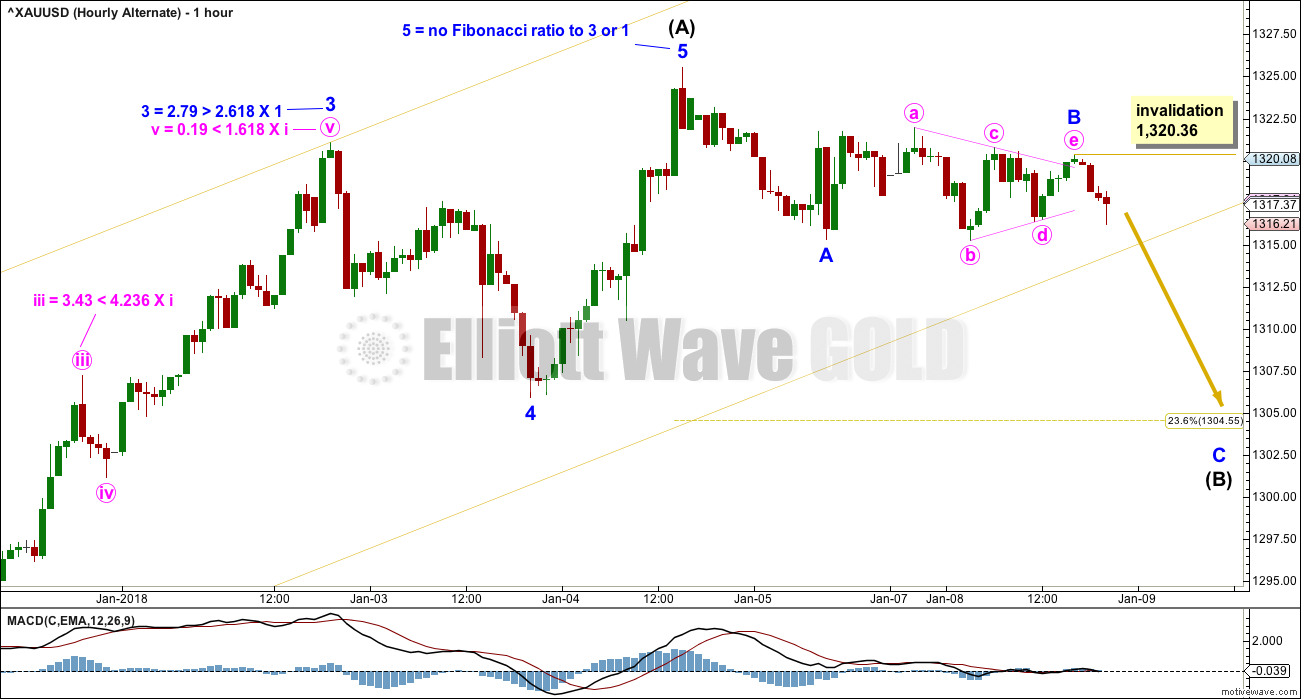
Click chart to enlarge.
This wave count looks at the possibility that intermediate wave (A) may be a completed five wave impulse.
Intermediate wave (B) may have begun. Within intermediate wave (B), a triangle may have just completed that may be minor wave B. No second wave correction within minor wave C may move beyond the start of its first wave above 1,320.36.
The degree of labelling within intermediate wave (B) may need to be moved down one. If this wave count is indicated as correct by a breach of the best fit channel, then that would be considered.
SECOND DAILY CHART
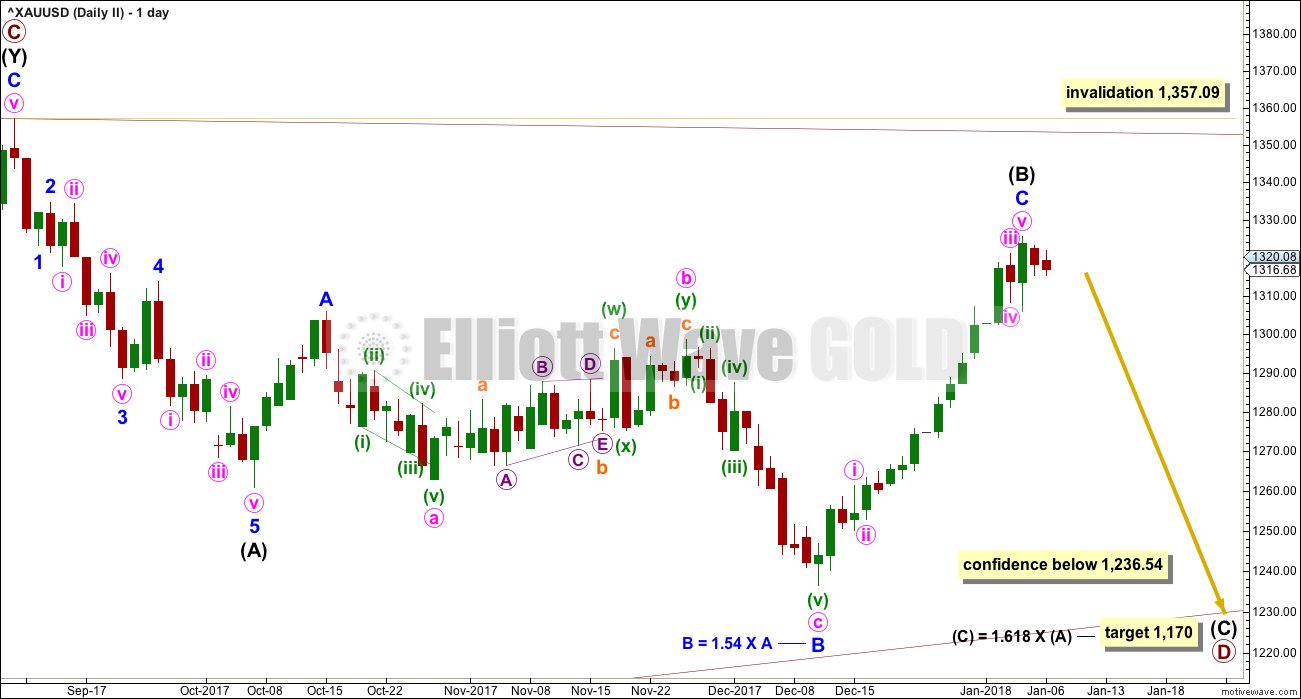
Click chart to enlarge.
This wave count was labelled as “third daily chart” in last analysis. It is now the second.
It is possible that within the large triangle for cycle wave b primary wave D may still be incomplete. Within primary wave D, intermediate wave (B) may be completing as a flat correction. It may be over here or it may move a little higher.
The target for intermediate wave (C) would see primary wave D have a normal length to primary wave C.
Intermediate wave (B) may not move beyond the start of intermediate wave (A) above 1,357.09. If it gets up that high, it should find strong resistance about the upper A-C trend line; triangles normally adhere very well to their trend lines.
ALTERNATE ELLIOTT WAVE COUNT
WEEKLY CHART
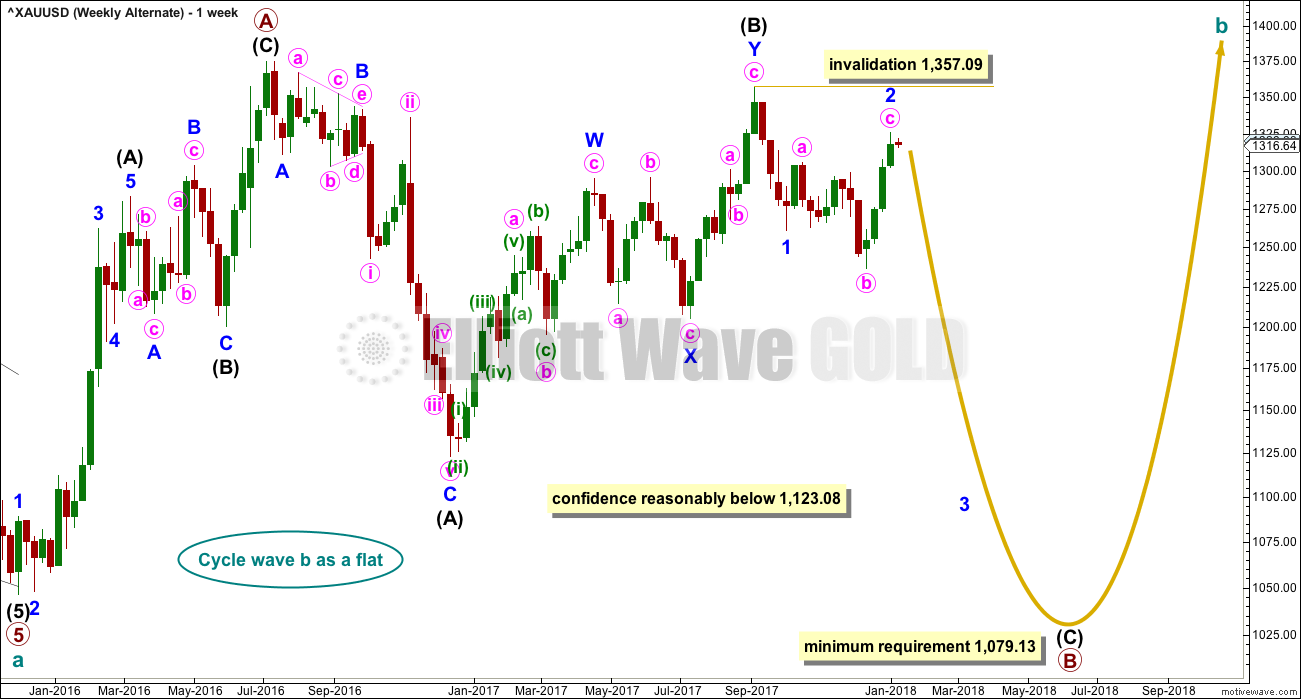
Click chart to enlarge.
All wave counts are identical to the low labelled cycle wave a. Thereafter, they look at different possible structures for cycle wave b.
Cycle wave b may be a flat correction. Within a flat primary, wave B must retrace a minimum 0.9 length of primary wave A at 1,079.13 or below.
Within intermediate wave (C), minor wave 2 may not move beyond the start of minor wave 1 above 1,357.09.
TECHNICAL ANALYSIS
WEEKLY CHART
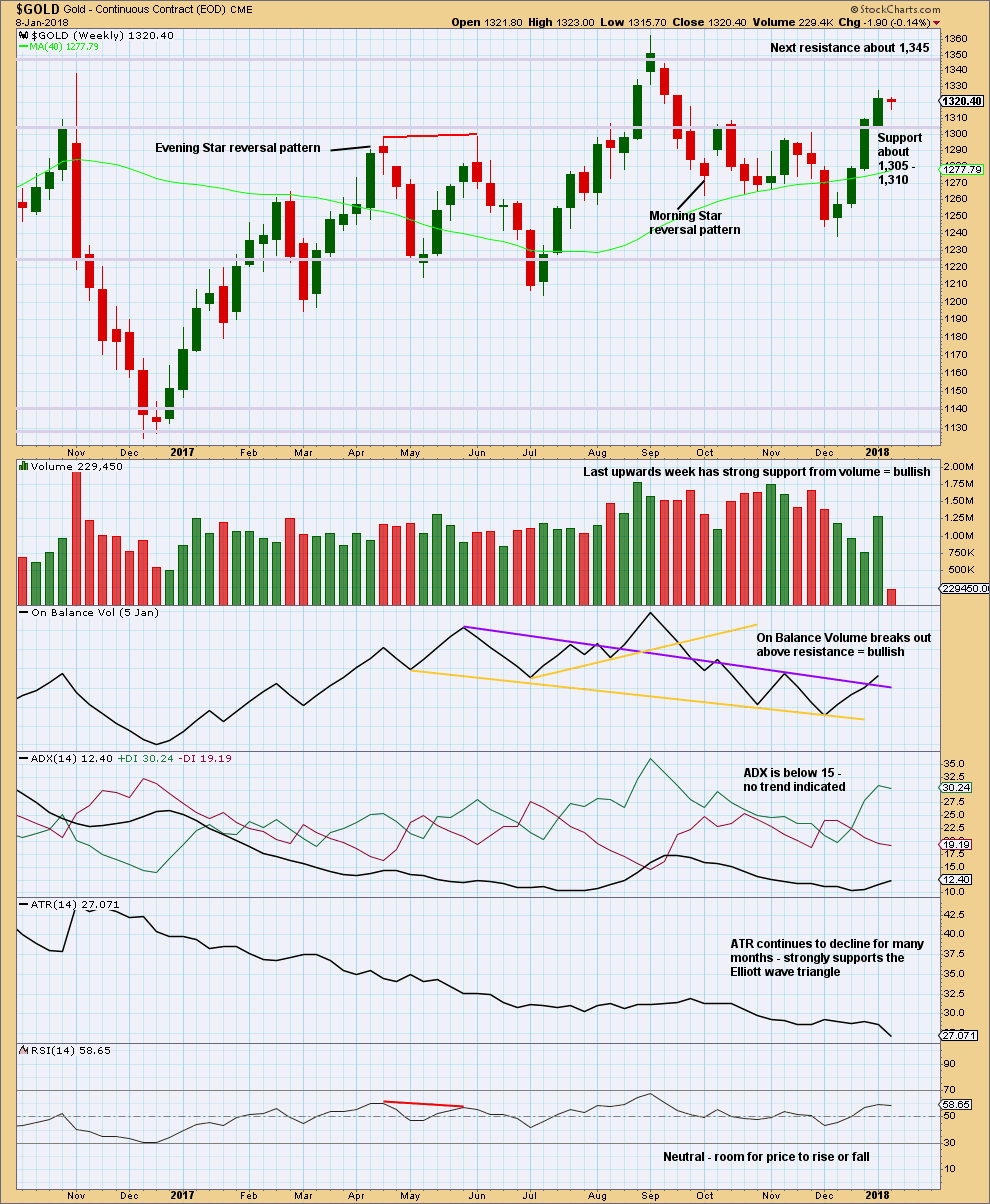
Click chart to enlarge. Chart courtesy of StockCharts.com.
Now that price has again broken above resistance at 1,305 to 1,310, that area may now provide support. Next resistance is about 1,345.
DAILY CHART
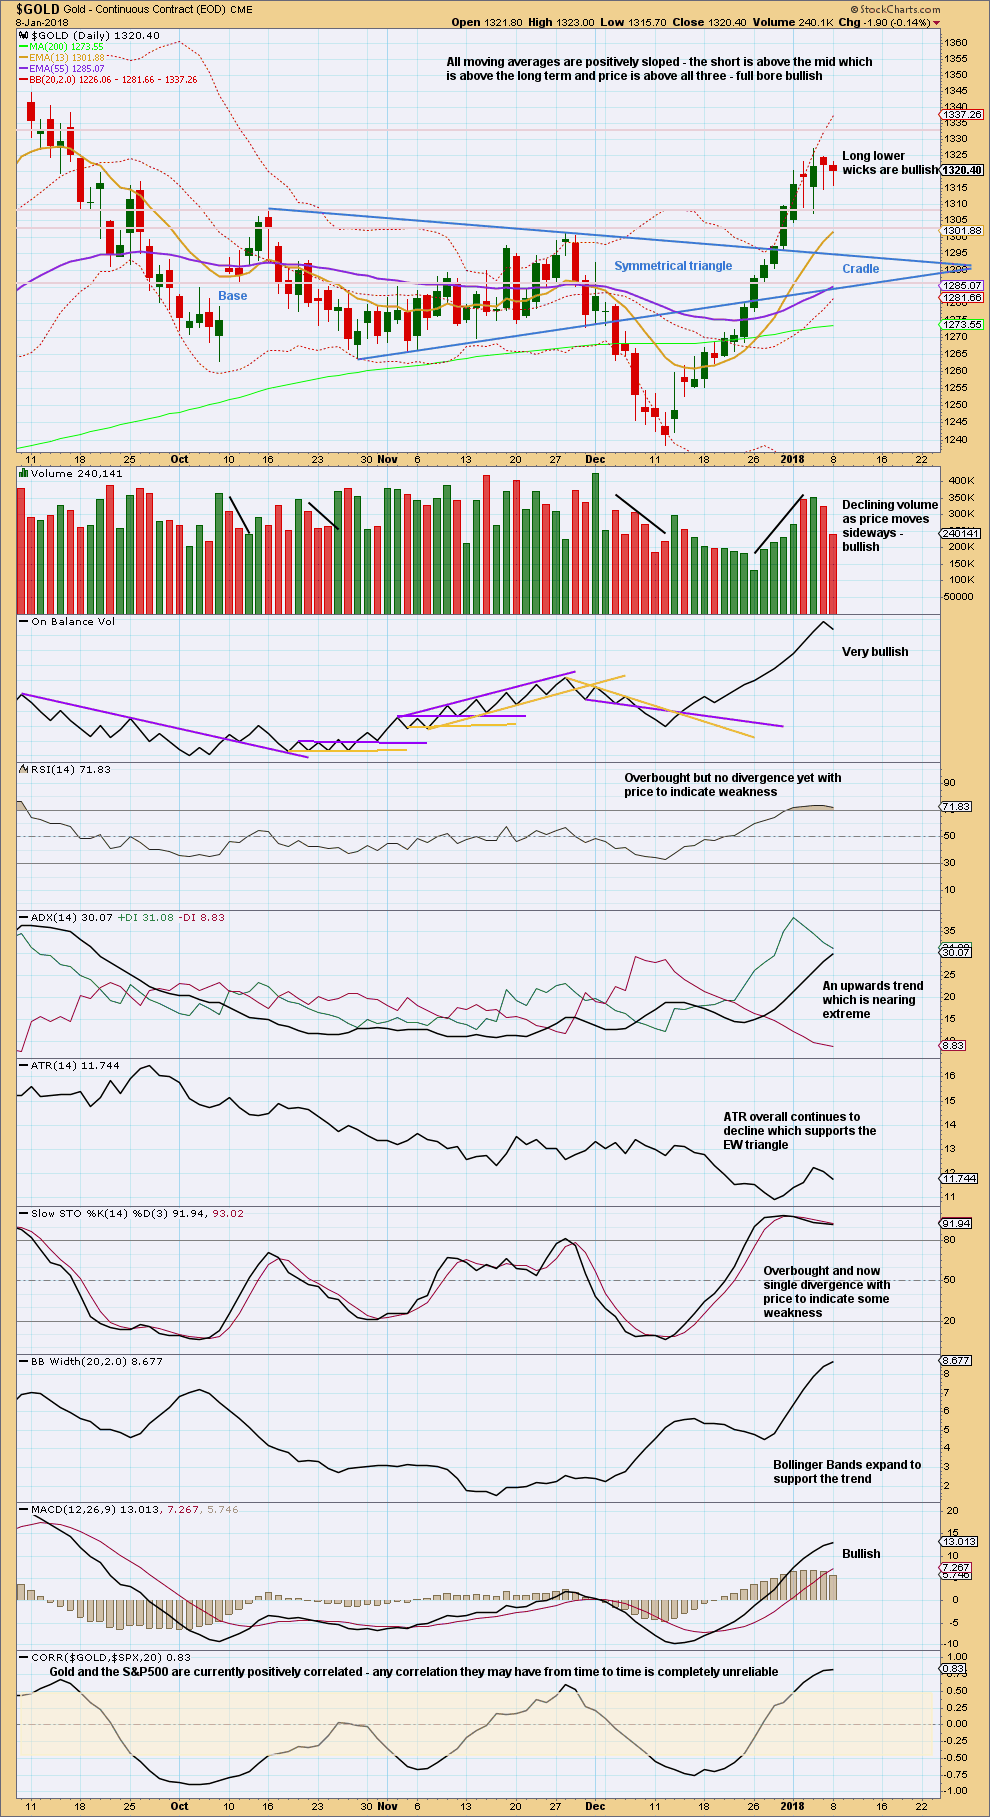
Click chart to enlarge. Chart courtesy of StockCharts.com.
Sideways movement of the last two days looks like a small pause within an upwards trend. The trend is stretched and nearing extreme, but there is not enough weakness yet to indicate an end to it. It can continue higher.
Overall, this chart is fairly bullish, and that is why the Elliott wave count expects a fifth wave up to continue higher.
GDX DAILY CHART
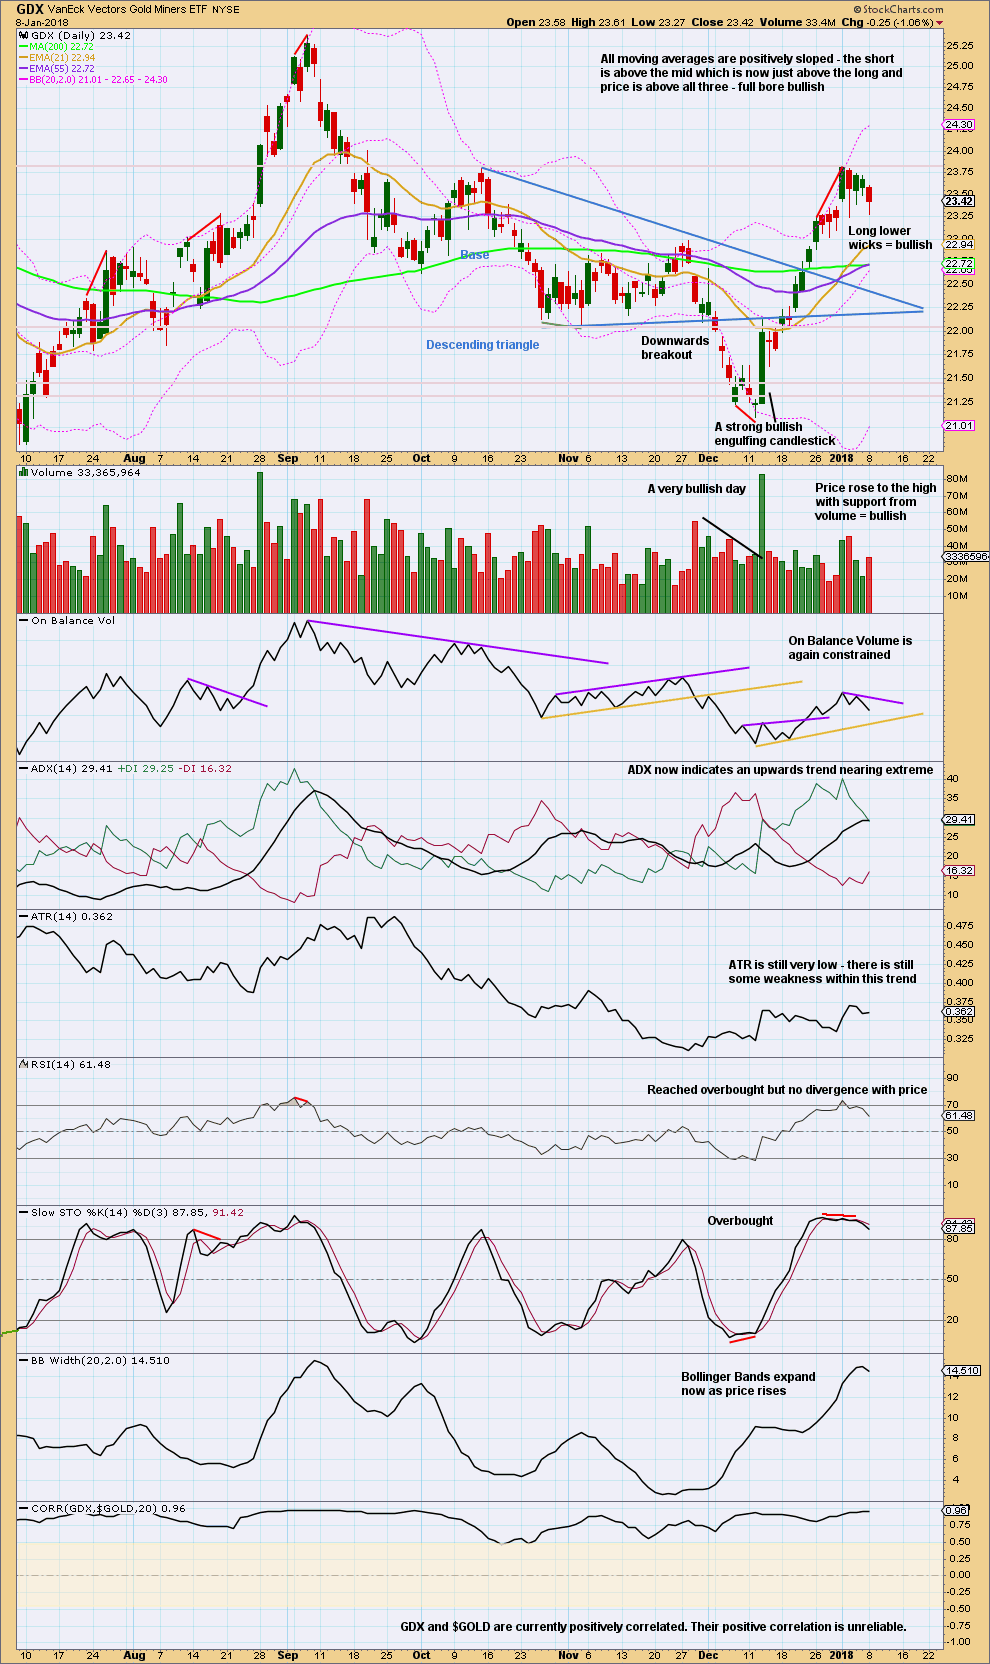
Click chart to enlarge. Chart courtesy of StockCharts.com.
Comments today are all on the chart.
Published @ 10:07 p.m. EST.
2 hourly chart updated:
I think I really do need to move the degree of labelling within intermediate (B) all down one degree, that looks too quick.
Only minor A may be completing lower as a zigzag.
With price breaking below the channel it now looks very much like intermediate (A) is complete.
Attention now must turn to intermediate (B).
Longer standing members will know how much I dislike B waves. They really are the worst. Lets look at the last few within this huge cycle b triangle for some indication of what we may now expect for the next weeks.
Hi Alan: Your target of 1305.93 is not too far away now! Imo an interim top at 1326 has probably been signaled. CCI on the daily & weekly has turned neutral (below 100) and could head lower helping massage Gold price down with it lol…. Lets see what happens if Gold price can be contained below 1315-17 🙂
Hi Lara,
In the 2 hourly chart, minor 2 is 7 bars long and minor 4 is 28 bars long.
The need for corrections to be roughly equal in time, for sake of proportionality, does not apply to sub-day smaller time frames, is that correct?
Thank you kindly.
Well spotted.
It’s a rough guideline.
And I’m only going to accept it while price remains within the channel.
Sometimes for Gold it has disproportionate second and fourth waves, but when that happens it’s usually the second wave that takes so much longer and the fourth wave which is quicker. When that happens it makes Gold’s impulses have a three wave look to them.
This is opposite, which is a bit concerning.
These are valuable points gained from your experience. Will go into my Word document, “Special EW points of gold”. For instance, you mentioned yesterday that E waves, of a triangle, usually undershoot for gold, with overshoot being rarer – added to the doc.
Thank you kindly.
You’re welcome. The guideline about E waves of triangles applies to all markets.
The observation of second and fourth wave disproportion applies mostly to commodities.
Thank you very much Lara. I have now changed the name of the doc to “Special EW points from Lara”, indicating therein points specific to commodities (changed from Gold to Commodities). Sincerely appreciated.