
Last analysis had three Elliott wave counts. One wave count was invalidated with a new high above 16.602, so only two wave counts now remain.
Summary: A sideways consolidation and then a short upwards thrust is now expected. The sideways consolidation may last at least two weeks.
New updates to this analysis are in bold.
Last monthly chart is here.
The Elliott wave counts are presented this week in order of probability.
ELLIOTT WAVE COUNTS
MAIN WAVE COUNT
WEEKLY CHART
Click chart to enlarge.
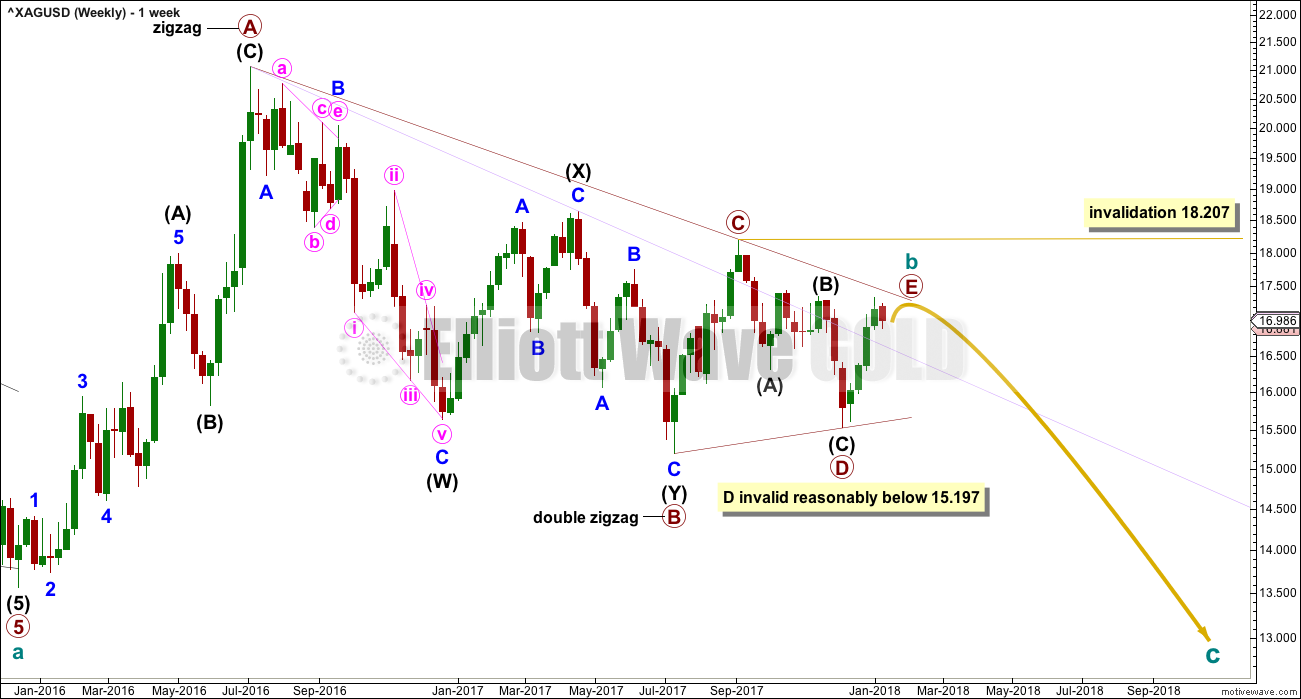
It remains possible for Silver that a large regular contracting triangle may be completing.
Within a triangle, one of the sub-waves must be a more complicated multiple, usually a multiple zigzag. This may be complete for primary wave B.
The triangle may now need only the final sub-wave of primary wave E upwards to complete it. Primary wave E would most likely fall reasonably short of the A-C trend line.
Primary wave E may not move beyond the end of primary wave C above 18.207.
Primary wave E should subdivide as a zigzag, and within it intermediate wave (B) should last about two to four weeks.
DAILY CHART
Click chart to enlarge.
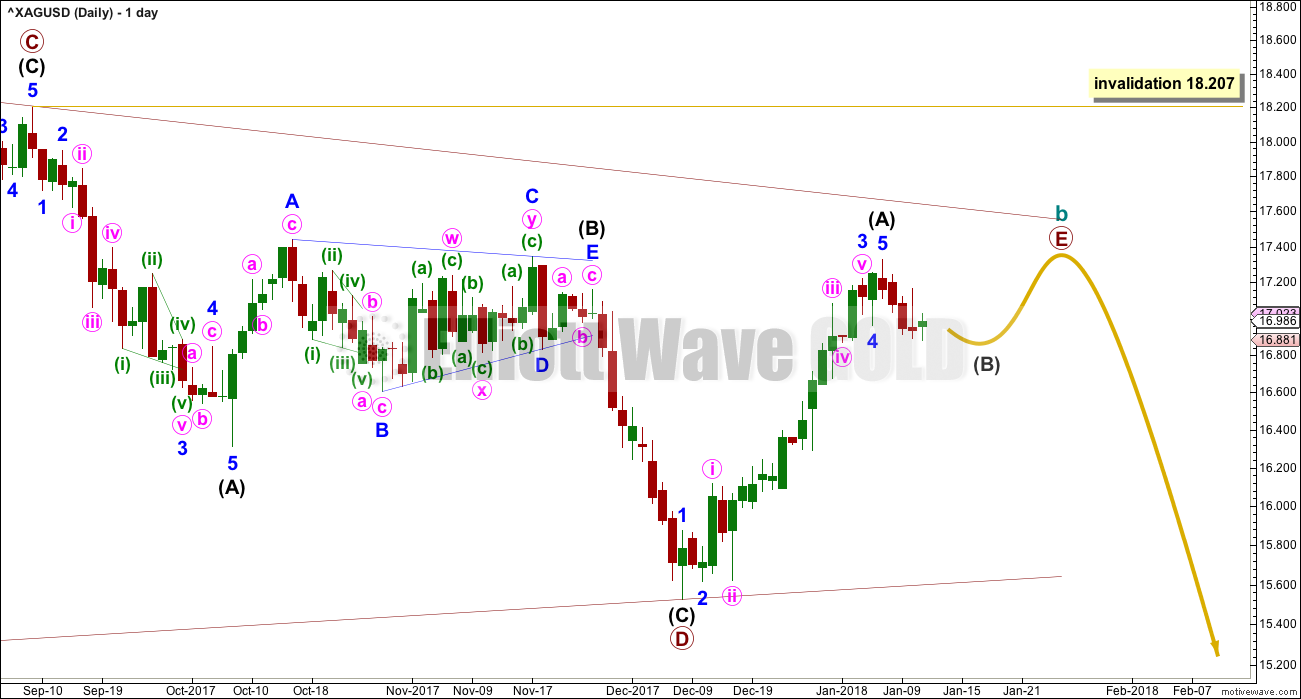
Primary wave E should be an obvious three wave structure, and intermediate wave (B) within it may be complicated and time consuming.
Within the zigzag of primary wave E, intermediate wave (B) may not move beyond the start of intermediate wave (A) below 15.525.
Although it is also possible that primary wave E is complete at the last high, it would have a better and more typical look if it continued further as a more obvious three wave structure. Only a new low below 15.525 would at this stage see the triangle of cycle wave b labeled as complete.
ALTERNATE WAVE COUNT
WEEKLY CHART
Click chart to enlarge.
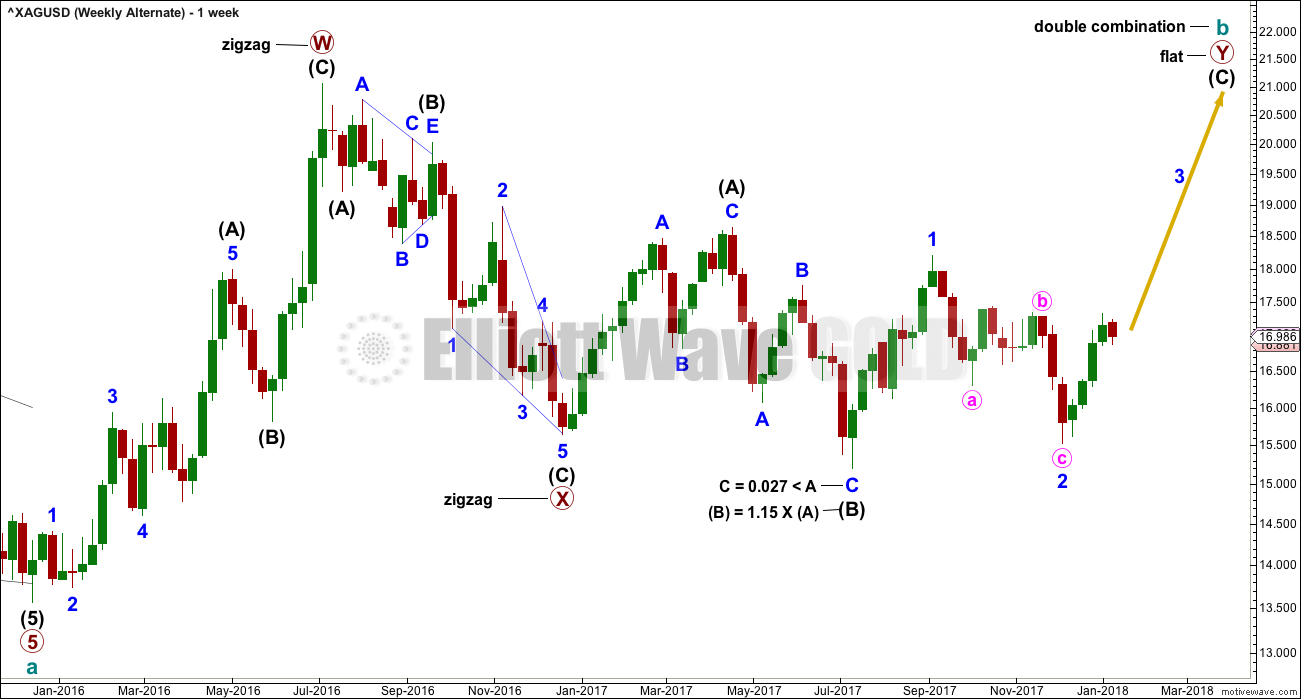
Cycle wave b may be completing as a double combination: zigzag – X – flat. The second structure, a flat correction for primary wave Y, may be underway.
Within a flat correction, intermediate wave (B) must retrace a minimum 0.9 length of intermediate wave (A) at 15.938. Intermediate wave (B) has met this minimum requirement; the rule for a flat correction is met. Intermediate wave (B) is longer than 1.05 times the length of intermediate wave (A) indicating this may be an expanded flat. Expanded flat corrections are the most common type. Normally their C waves are 1.618 or 2.618 the length of their A waves.
The target calculated would see primary wave Y to end close to same level as primary wave W about 21.062. The purpose of combinations is to take up time and move price sideways. To achieve this purpose the second structure in the double normally ends about the same level as the first.
While the combination wave count at the weekly chart level does not currently work for Gold, it does still work for Silver. They do not have to complete the same structures for cycle wave b, and fairly often their structures are different.
At this stage, the duration of minor wave 2 now looks wrong. This wave count is now less likely.
DAILY CHART
Click chart to enlarge.
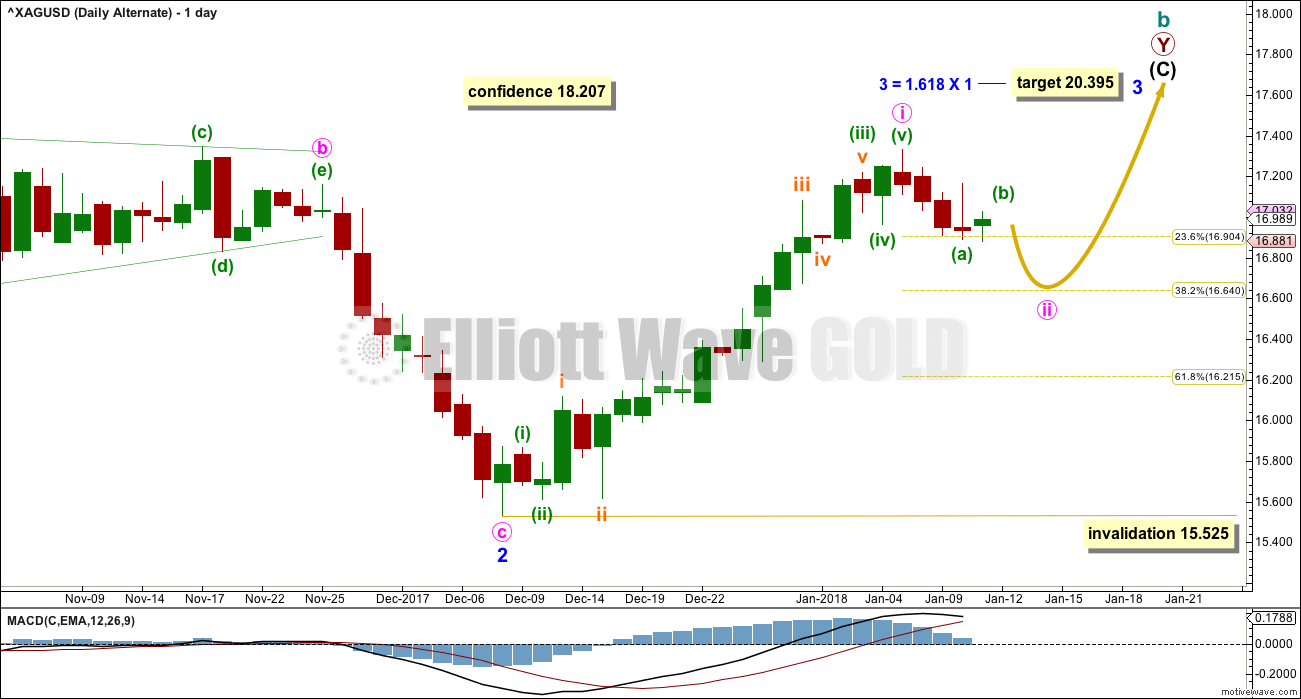
Minor wave 3 may only subdivide as an impulse and must move above the end of minor wave 1 at 18.207.
Minute wave i may be complete within the impulse of minor wave 3. Minute wave ii may not move beyond the start of minute wave i below 15.525.
The target for minor wave 3 expects the most common Fibonacci ratio to minor wave 1.
TECHNICAL ANALYSIS
WEEKLY CHART
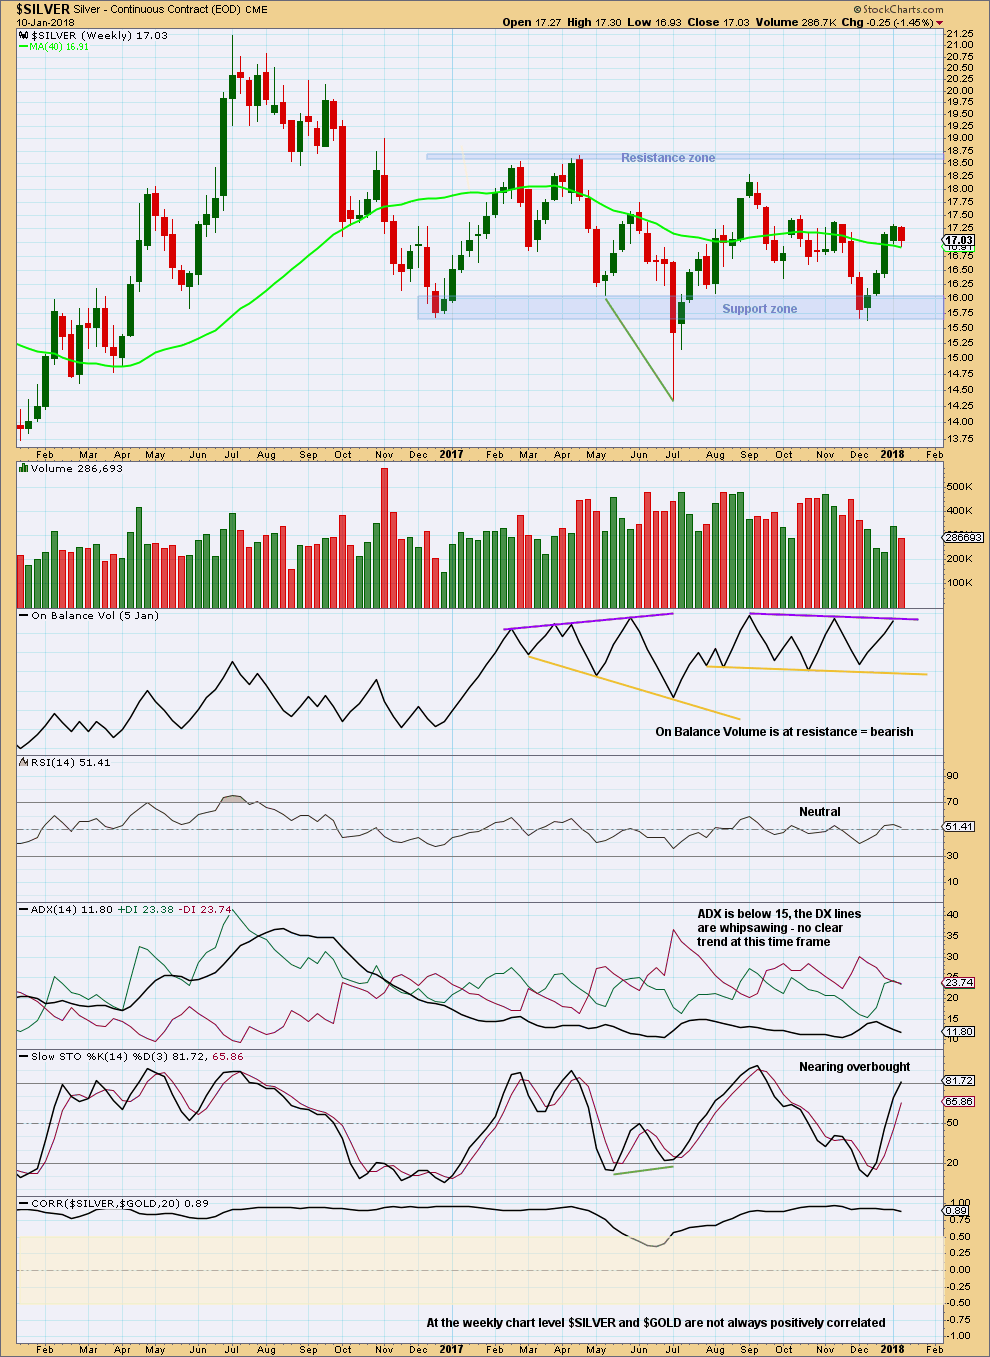
Click chart to enlarge. Chart courtesy of StockCharts.com.
With On Balance Volume at resistance and Stochastics almost overbought, the rise in price may halt here.
DAILY CHART
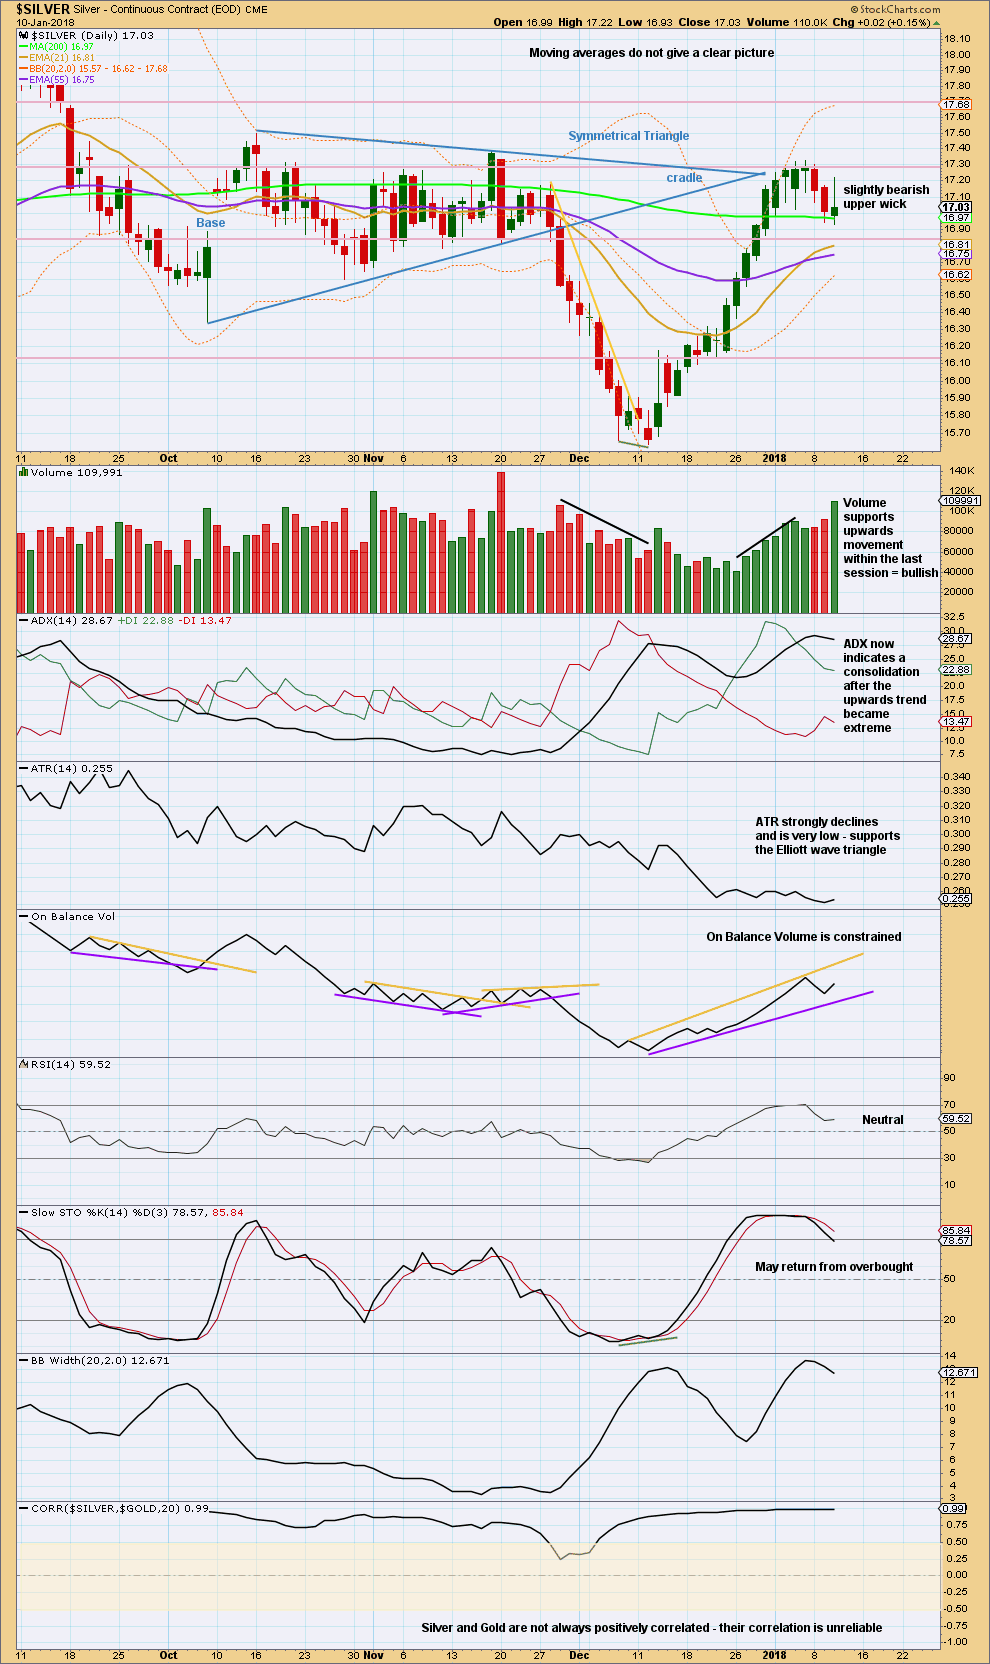
Click chart to enlarge. Chart courtesy of StockCharts.com.
Price has hit resistance about 17.30.
Next support is about 16.85.
Published @ 01:38 a.m. EST.