It is time to step back and look at monthly charts for Silver, including a new alternate that is in line with Gold analysis.
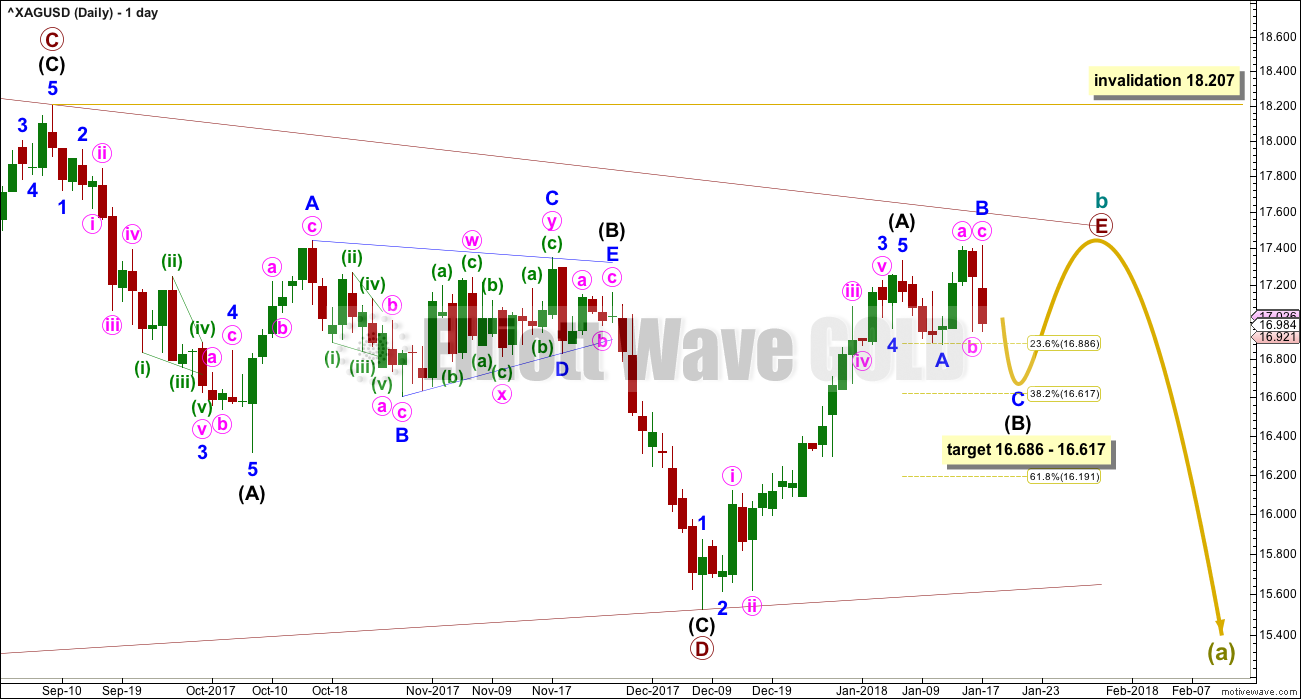
Summary: A small downwards wave to about 16.686 – 16.617 is expected, then a final last upwards thrust to a new high above 17.330.
At that point the wave counts diverge.
New updates to this analysis are in bold.
ELLIOTT WAVE COUNTS
MAIN WAVE COUNT
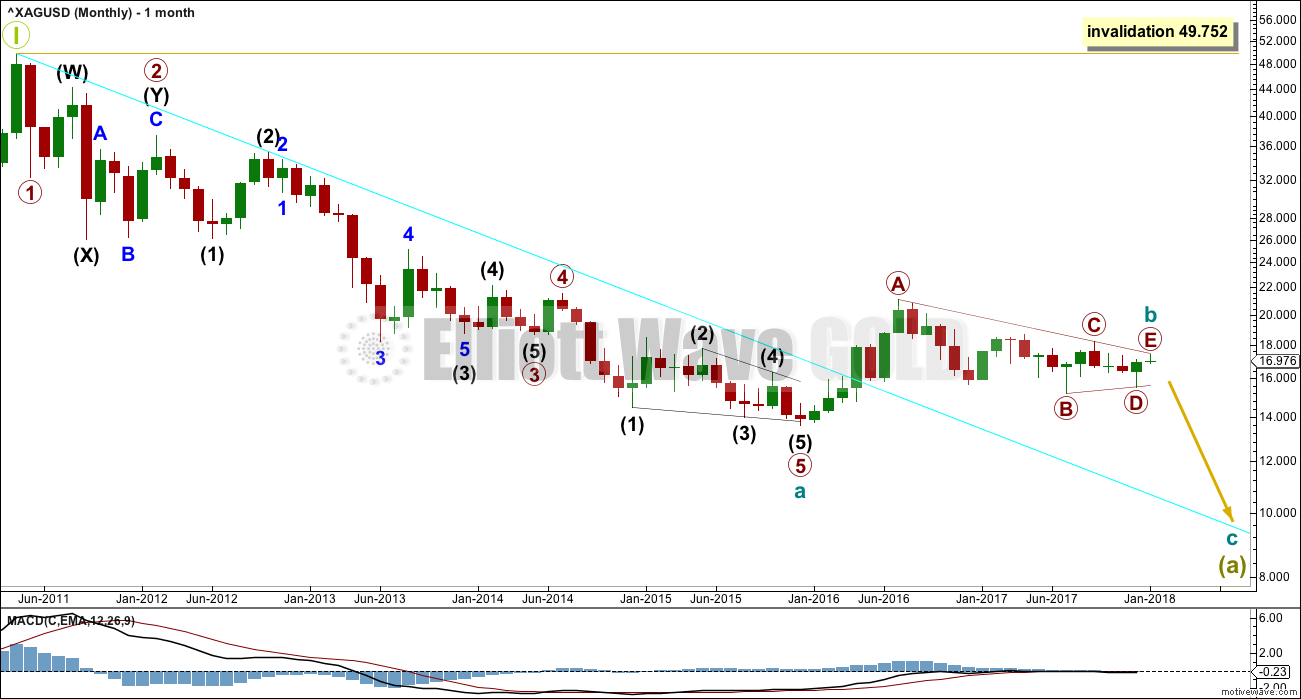
MONTHLY CHART
Grand Super Cycle wave I may have ended at the last high. That may also be the end of a Grand Super Cycle wave III, to be in line with Gold analysis (but for Silver there is not as much historic data available).
Either way, the structure may be the same whether this be a second or fourth wave correction.
The Grand Super Cycle correction may be an incomplete flat or combination, with Super Cycle wave (a) downwards an incomplete zigzag.
Within the zigzag, cycle wave b may have just ended as a triangle. Cycle wave c may now begin.
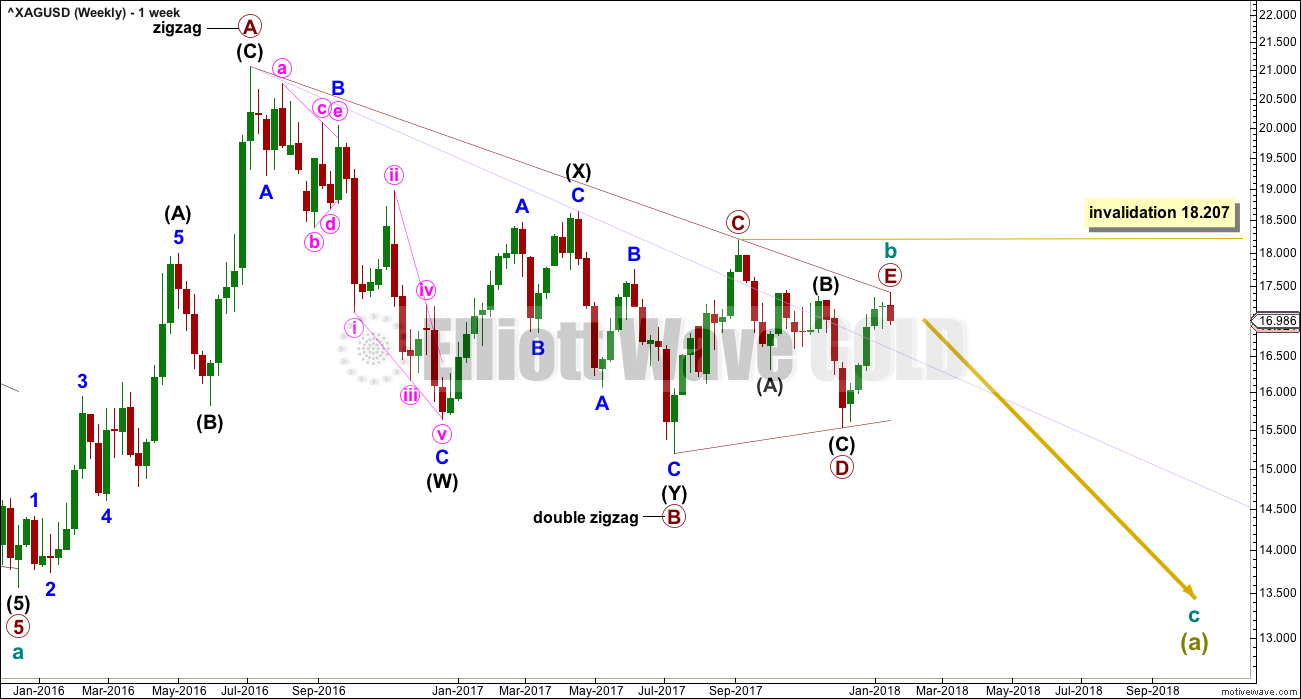
WEEKLY CHART
The triangle may now be almost complete. Primary wave E may end with an overshoot of the A-C trend line as it is very close to that line now.
At its end, primary wave E may look like a three wave structure here at the weekly chart level.
Primary wave E may not move beyond the end of primary wave C above 18.207.
DAILY CHART
Intermediate wave (B) may be an incomplete flat correction. This wave count fits all subdivisions.
Minor wave B fits on the hourly chart very well as a zigzag. It is difficult to see this wave up as a complete five, so it would be very difficult to see this as intermediate wave (C).
Minor wave C would be very likely to make at least a slight new low below the end of minor wave A at 16.881 to avoid a truncation and a very rare running flat.
The target calculated for intermediate wave (B) to end would see minor wave C reach about 1.618 the length of minor wave A, and intermediate wave (B) end close to the 0.382 Fibonacci ratio of intermediate wave (A).
Thereafter, intermediate wave (C) should move above the end of intermediate wave (A) at 17.330 to avoid a truncation.
Primary wave E may be over in a few more sessions.
Thereafter, this wave count expects a trend change at cycle degree.
A target for cycle wave c to end may be calculated when the possible start of it is known. That cannot be done yet.
SECOND WAVE COUNT
WEEKLY CHART
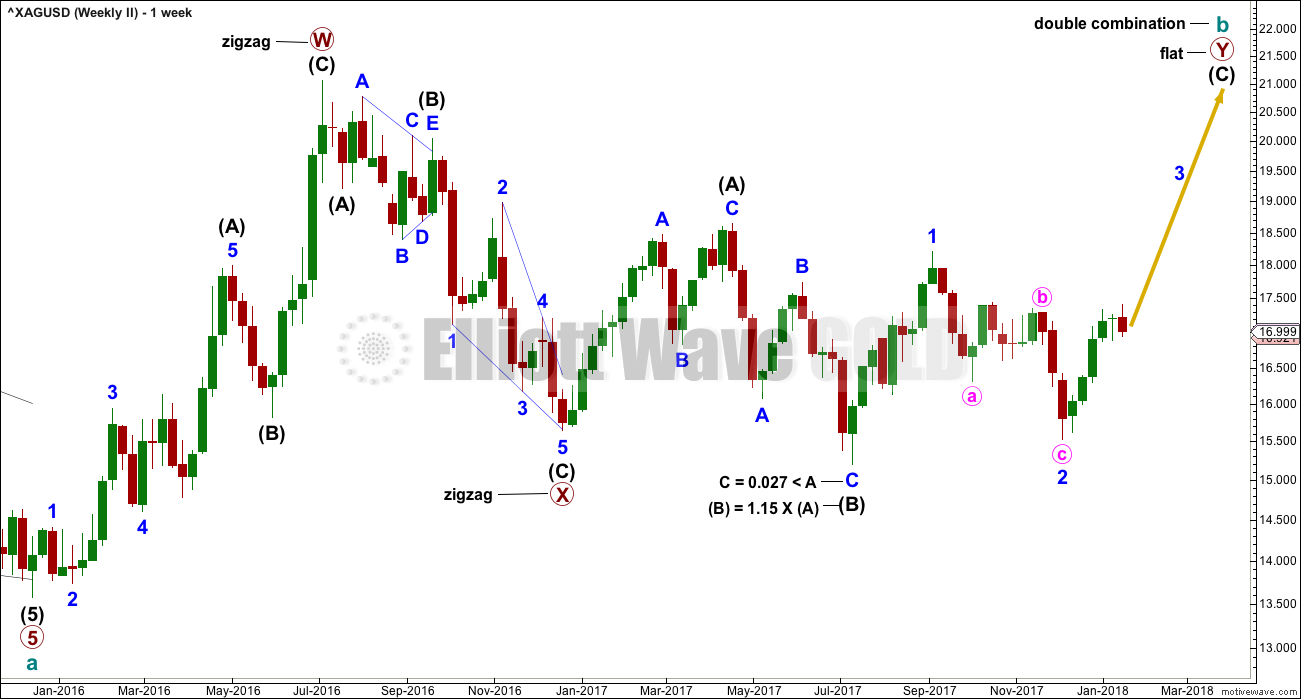
Both the first and second wave counts see the large fall in price from April 2011 to December 2015 as a five wave structure. Thereafter, they differ on what structure cycle wave b may be taking.
Cycle wave b may be completing as a double combination: zigzag – X – flat. The second structure, a flat correction for primary wave Y, may be underway.
Within a flat correction, intermediate wave (B) must retrace a minimum 0.9 length of intermediate wave (A) at 15.938. Intermediate wave (B) has met this minimum requirement; the rule for a flat correction is met. Intermediate wave (B) is longer than 1.05 times the length of intermediate wave (A) indicating this may be an expanded flat. Expanded flat corrections are the most common type. Normally their C waves are 1.618 or 2.618 the length of their A waves.
The target calculated would see primary wave Y to end close to same level as primary wave W about 21.062. The purpose of combinations is to take up time and move price sideways. To achieve this purpose the second structure in the double normally ends about the same level as the first.
While the combination wave count at the weekly chart level does not currently work for Gold, it does still work for Silver. They do not have to complete the same structures for cycle wave b, and fairly often their structures are different.
At this stage, the duration of minor wave 2 now looks wrong. This wave count is now less likely.
DAILY CHART
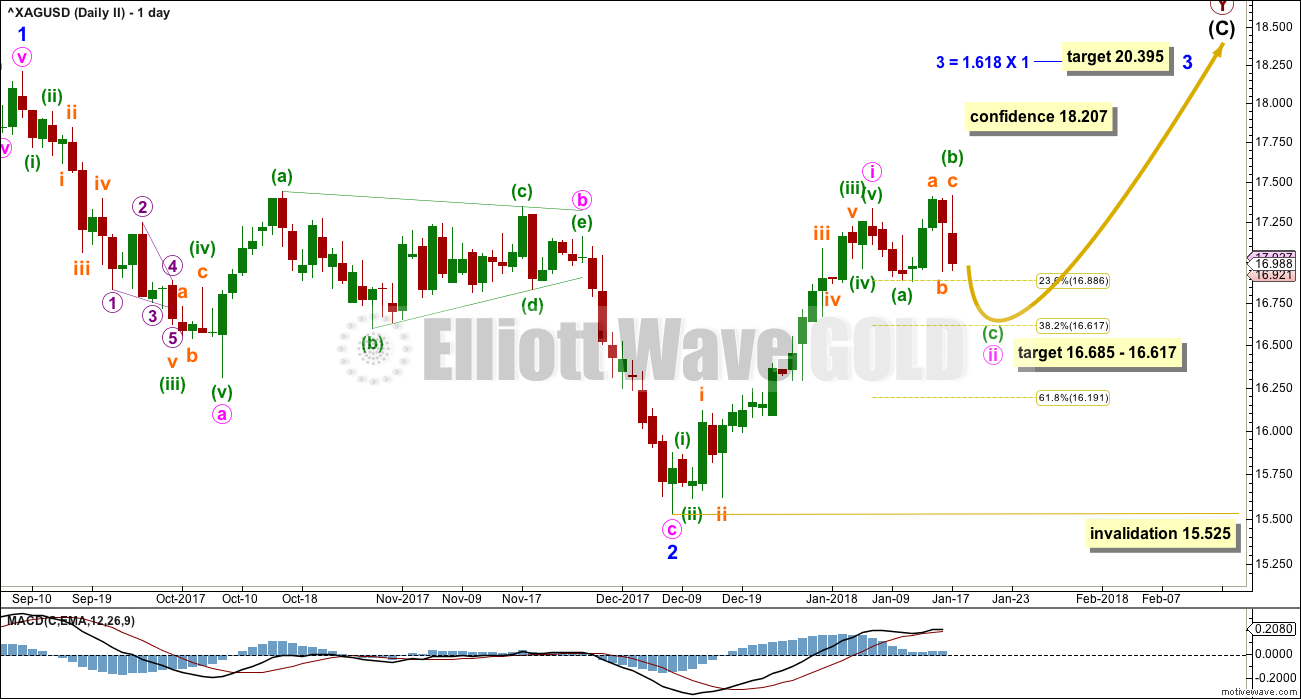
Minor wave 3 may only subdivide as an impulse and must move above the end of minor wave 1 at 18.207.
Minute wave i may be complete within the impulse of minor wave 3. Minute wave ii may not move beyond the start of minute wave i below 15.525.
At this stage, the structure for minute wave ii is seen in the same way as intermediate wave (B) for the first wave count. Both wave counts see this piece of movement as a possible incomplete flat correction.
The target for minor wave 3 expects the most common Fibonacci ratio to minor wave 1.
ALTERNATE WAVE COUNT
MONTHLY CHART
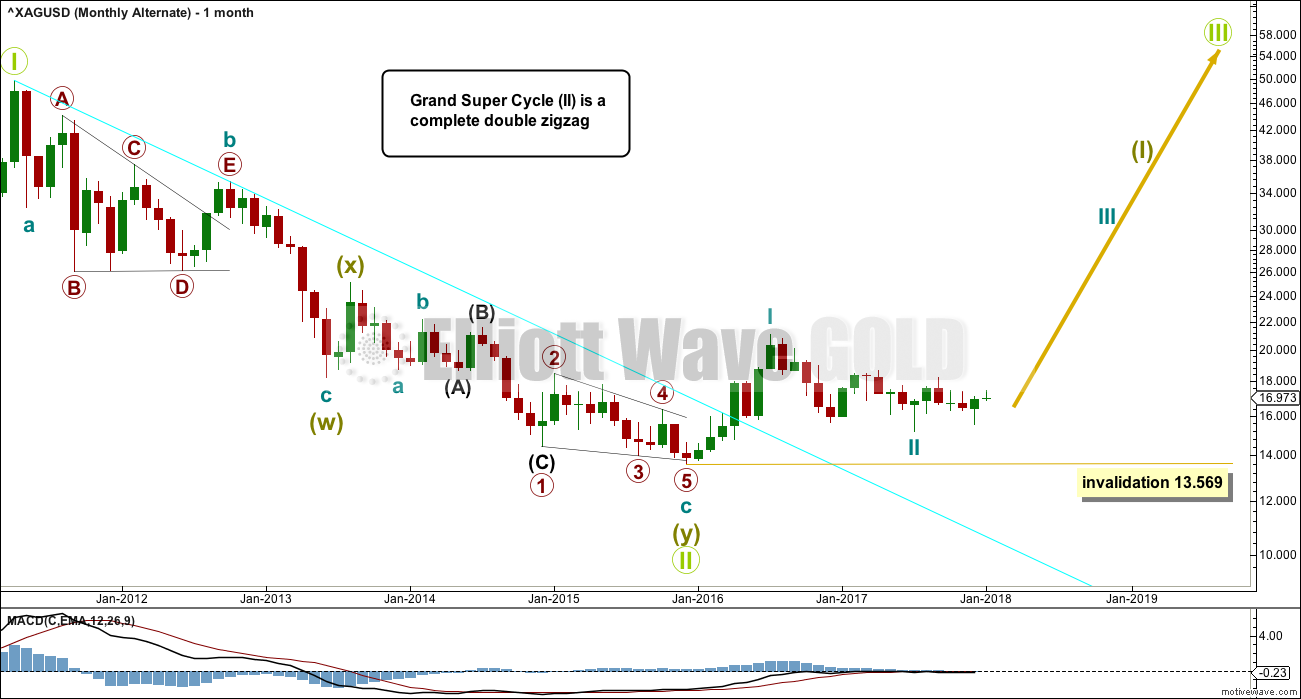
This alternate wave count looks at the possibility that the large downwards wave may have been a double zigzag and may be the complete correction. A new bull market may have begun to last generations at the low in December 2015.
Within the new bull market, cycle wave II (if it continues further) may not move beyond the start of cycle wave I below 13.569.
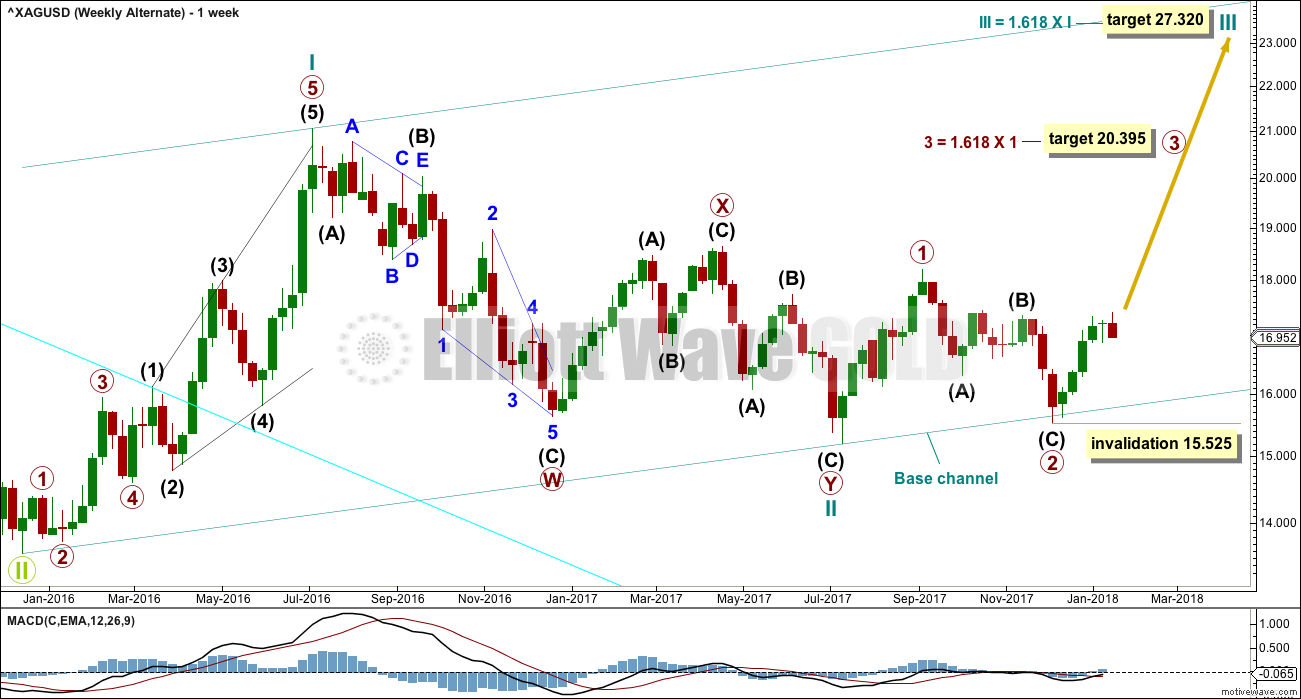
WEEKLY CHART
A series of two overlapping first and second waves may now be complete for cycle waves I and II, and primary waves 1 and 2.
A third wave now at two large degrees may be beginning.
Targets calculated for third waves assume the most common Fibonacci ratios to their respective first waves. As price approaches each target, if the structure is incomplete or price keeps rising through the target, then the next Fibonacci ratio in the sequence would be used to calculate a new target.
Within primary wave 3, no second wave correction may move beyond the start of its first wave below 15.525.
The large base channel about cycle waves I and II nicely shows where primary wave 2 found support. A lower degree second wave correction should find support (in a bull market) about a base channel drawn about a first and second wave one or more degrees higher.
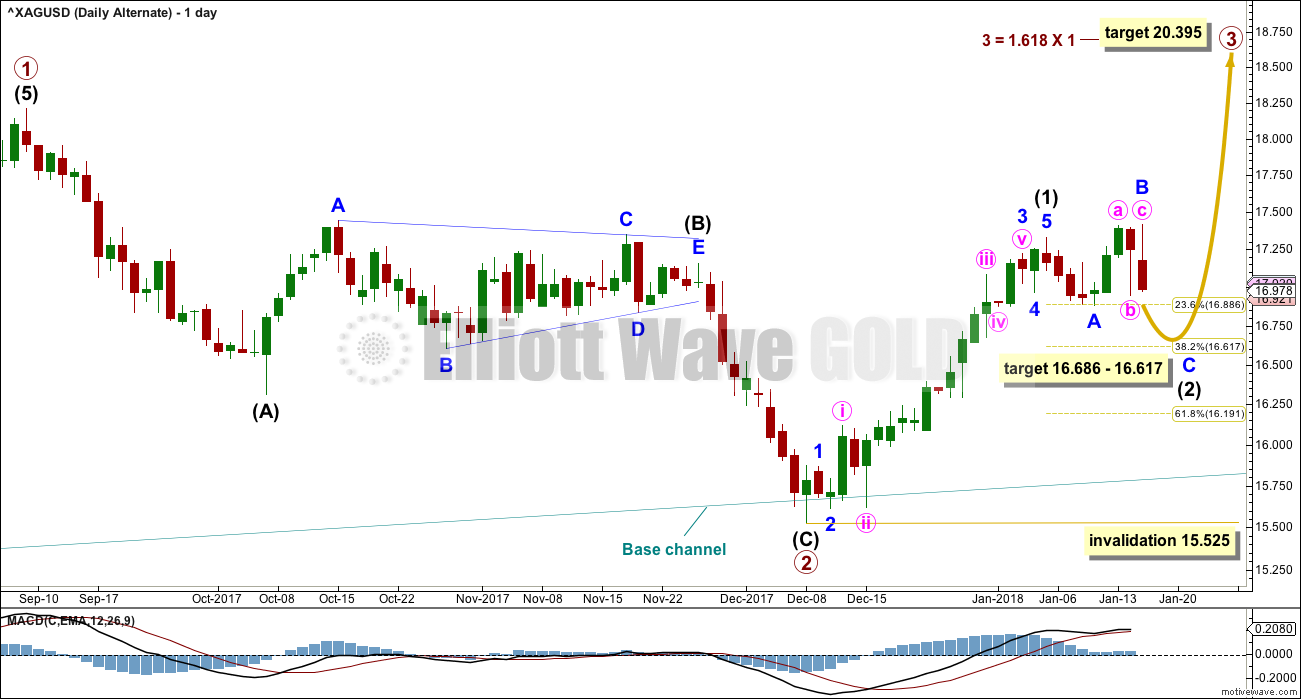
DAILY CHART
For the short term, all wave counts expect the same movement next. An expanded flat correction is here labelled intermediate wave (2).
Minor wave C would be very likely to move at least slightly below the end of minor wave A at 16.881 to avoid a truncation and a very rare running flat.
The target zone would see minor wave C end about 1.618 the length of minor wave A, and intermediate wave (2) end about the 0.382 Fibonacci ratio of intermediate wave (1).
The lower edge of the base channel is slightly overshot but not breached. Intermediate wave (2) may be expected to find support about the lower edge of the base channel if it gets that low.
A breach of the base channel at the daily chart level would substantially reduce the probability of this wave count.
Intermediate wave (2) may not move beyond the start of intermediate wave (1) below 15.525.
TECHNICAL ANALYSIS
WEEKLY CHART
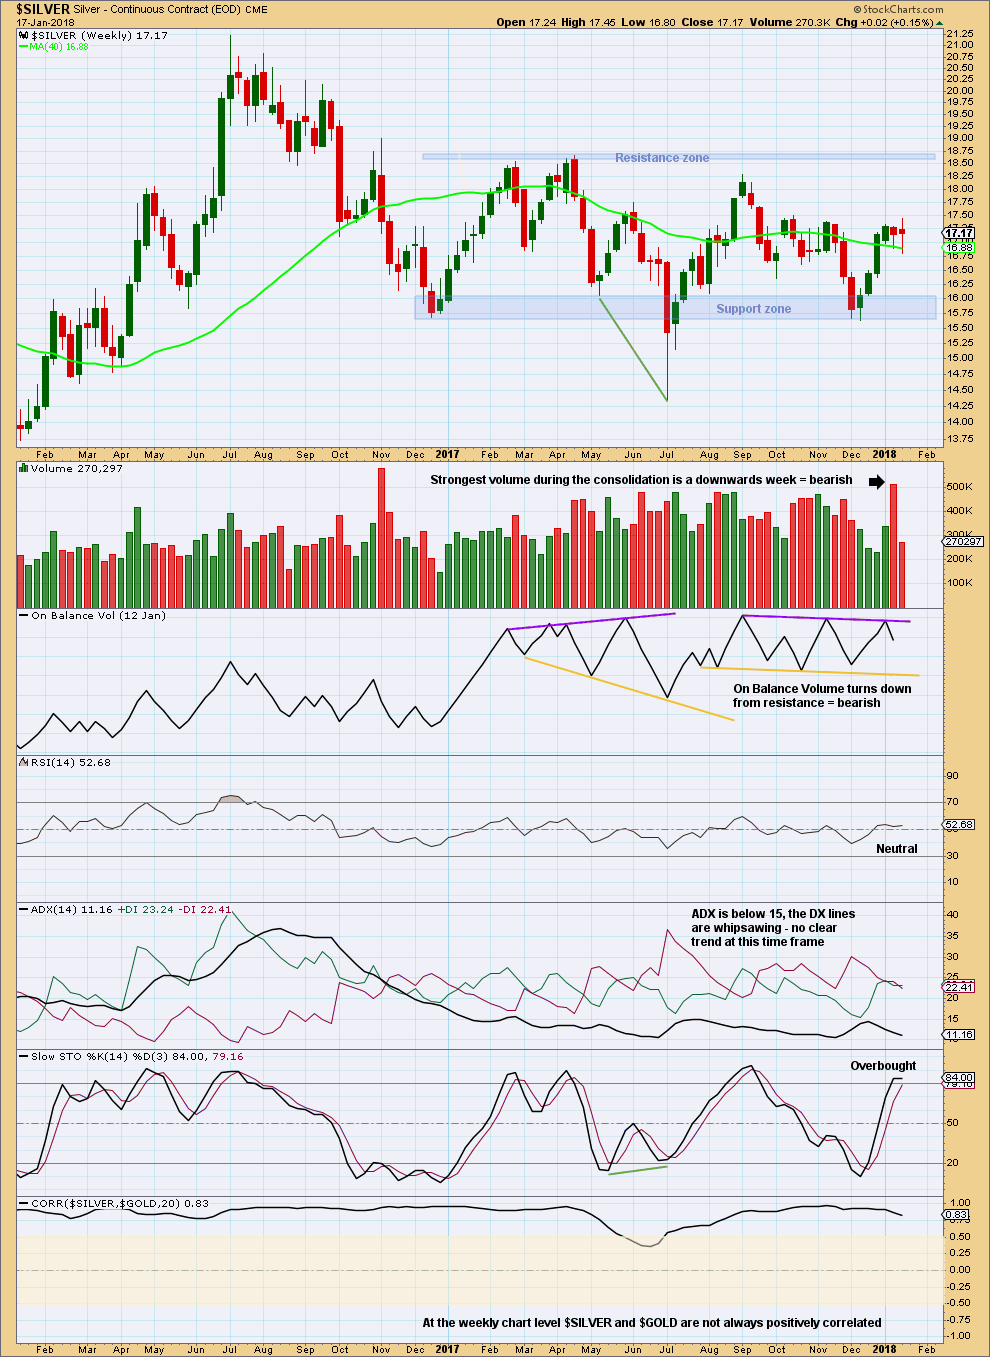
Click chart to enlarge. Chart courtesy of StockCharts.com.
It looks like at this time frame Silver is turning prior to resistance. On Balance Volume gives a bearish signal while Stochastics is overbought.
DAILY CHART
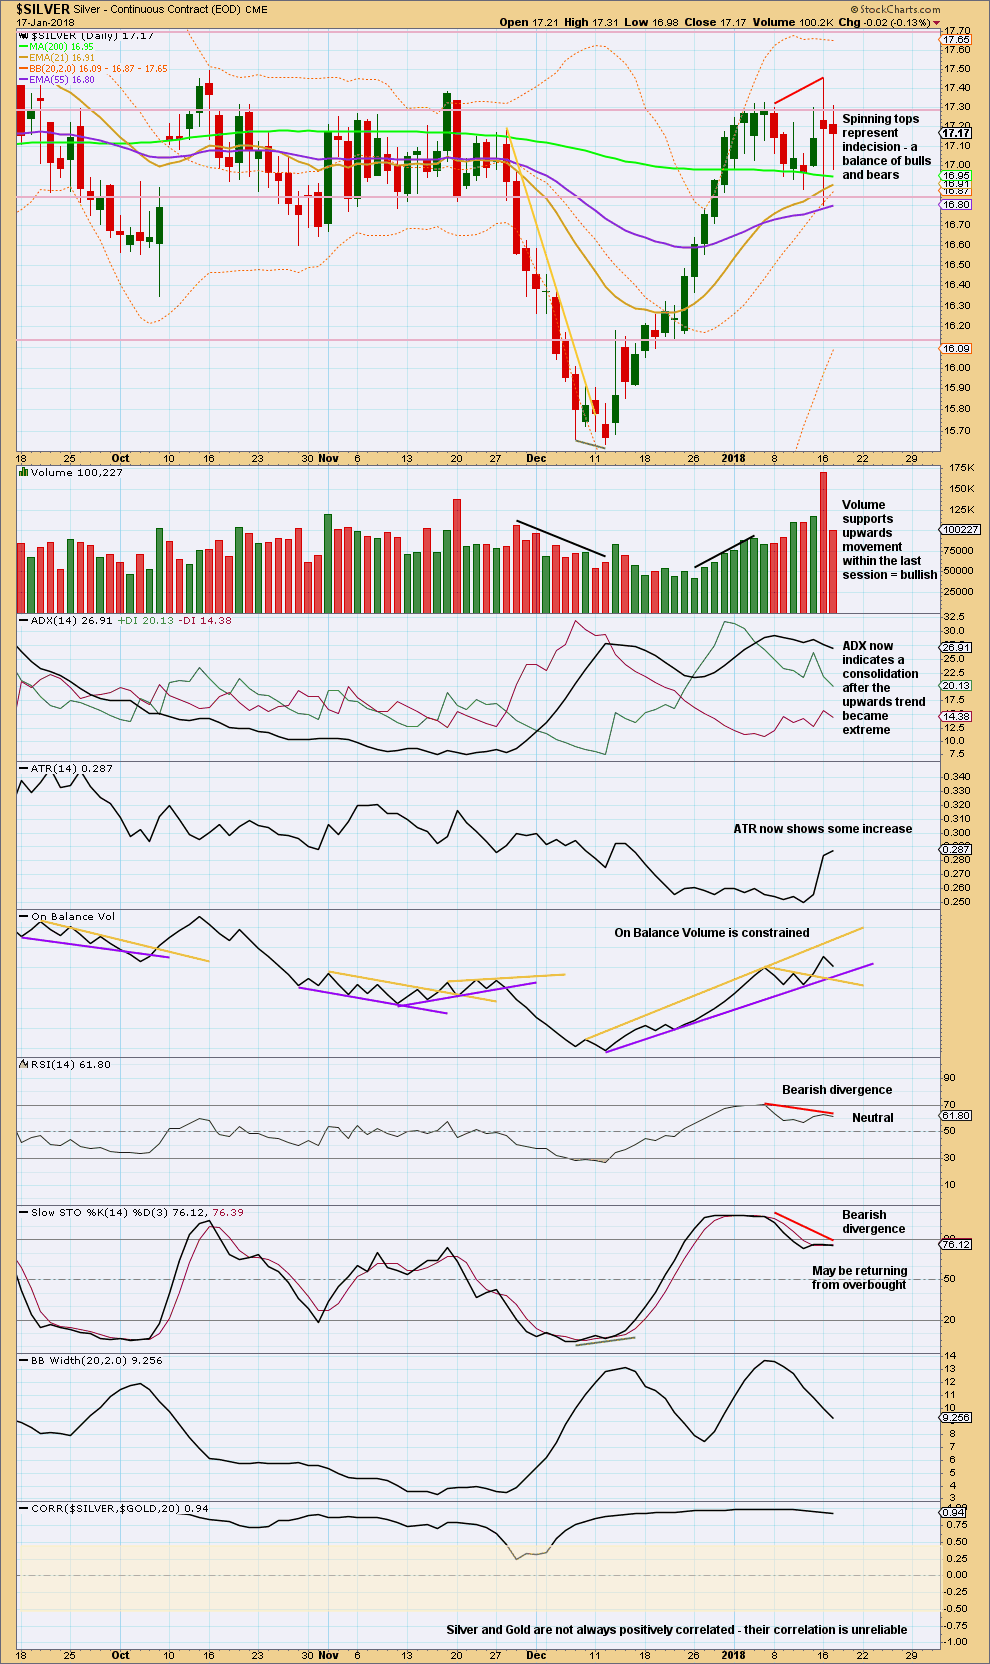
Click chart to enlarge. Chart courtesy of StockCharts.com.
Silver today looks clearer than Gold. It looks like Silver is turning.
RSI and Stochastics both reached overbought, and then both developed strong divergence with price at highs. ADX reached extreme at the same time.
Next support is about 16.85 and below that about 16.15.
Published @ 10:14 p.m. EST.

Lara, I have a hard time trying to reconcile the main counts in Gold and Silver. Since the two metals are highly correlated, and assuming that the main count in silver is correct, where do you expect Gold to bottom when Silver does the same between 16.61 and 16.68? Why do you think that Gold is not going to make one more higher high, as expected in the main count for Silver?
I absolutely do not proclaim to be an EW expert, but I have no problem with counting Silver’s last upleg as a 5-wave impulse structure, which in turn would fit better with the main count in Gold, assuming that wave E is now over for both metals. Why do you think that it is a 3-wave corrective structure? For the sake of clarity, could you please provide your members with a more detailed count, on a micro level, maybe using a 30-min. timeframe? Thank you.
The fact is that Gold and Silver are not always correlated. That is why I have the correlation co-efficient at the bottom of the TA chart. Just because they are correlated most of the time does not mean they will always remain correlated.
I know this is an unpopular view, but it is a mathematically correct view.
Gold and Silver have different turning points. Look at major highs and lows on weekly and monthly charts. They do not always turn on the same date.
Assuming that the main wave counts for Gold and Silver are correct:
Gold will have bounces during a downwards trend. The first second wave correction can often be very deep. This could coincide with the final wave up for Silver, which only has to make a slight new high above 17.330.
I have absolutely no problem with this view.
this is the last five up
clearly it cannot be an impulse because of the overlap between 4 and 1, and there is no other way to count this movement with no overlap
and so an ending diagonal is the only other possible structure for intermediate (C)
the problem is that 3 is too long. for an ending expanding diagonal 5 must be longer than 3
this idea violates an EW rule
this is why I concluded that this last wave up will not fit as a five
you say you have no problem counting this last wave up as an impulse… but I can’t see it
Lara, thank you for the clarification. Part of the confusion is that apparently we are not looking at the same charts. I am attaching a screenshot from my trading platform of the same price action in Silver between Jan 11 and Jan 16 on the 30-min timeframe, indicating how I interpret the latest upleg in Silver. I am wondering how such a huge discrepancy is possible between your chart and mine. I also would like to add that I would count your chart differently, since you apparently are skipping what I see a minor second wave within what I see as a third wave, which of course results in a different count and as a consequence in a different concept.
Because you have mentioned the dilemma of overlapping, I would like to note that according to Prechter a slight overlap is acceptable in case of leveraged markets (such as FX), because margin trading adds to the volatility. Obviously, there must not be any overlap between the real bodies of the assumed 1 and 4 wave candles, but a small overlap between the wicks is acceptable. Since the price action in the metals markets is largely driven by leveraged trading of futures contracts, that is, “paper” gold and silver, as opposed to being purely physical markets traded on a cash only basis, I think that by analogy the same rule could be applied for the markets you follow, that is, Gold and Silver as well. What do you think? Thanks…
Wow… that data you have is REALLY different. I think that the swing high on the RH side of your chart is equivalent to where I have put the “5” label on mine.
On my data from BarChart that high is a slight new high.
On your data it is not. And that is a material difference.
Our data is different. This is often the case for global markets like Silver. My data is from CBOE and I believe it is futures data.
Yes, a slight overlap in futures markets is acceptable. But any wave count that relies upon that rule being broken is still going to have a lower probability.
A wave count that avoids breaking this rule is preferable, always.
And I would agree that any overlap of real bodies of candlesticks should never be accepted, but thinking about the psychology of it I’d say that may only be the case for daily data.