
Upwards movement continued as expected.
Today’s classic analysis sees a new idea for the short term as now more likely.
Summary: Price is again right at resistance at the upper edge of the yellow best fit channel on hourly charts. Volume strongly suggests a downwards reaction here, which supports the alternate hourly chart. The target would be at 1,284.
But if price breaks above the channel here, then look out for a few more days of upwards movement to resistance about 1,365.
New updates to this analysis are in bold.
Grand SuperCycle analysis is here.
Last in-depth historic analysis with monthly and several weekly charts is here, video is here.
There are multiple wave counts at this time at the weekly and monthly chart levels. In order to make this analysis manageable and accessible only two will be published on a daily basis, one bullish and one bearish. This does not mean the other possibilities may not be correct, only that publication of them all each day is too much to digest. At this stage, they do not diverge from the two possibilities below.
BULLISH ELLIOTT WAVE COUNT
FIRST WEEKLY CHART
Click chart to enlarge.
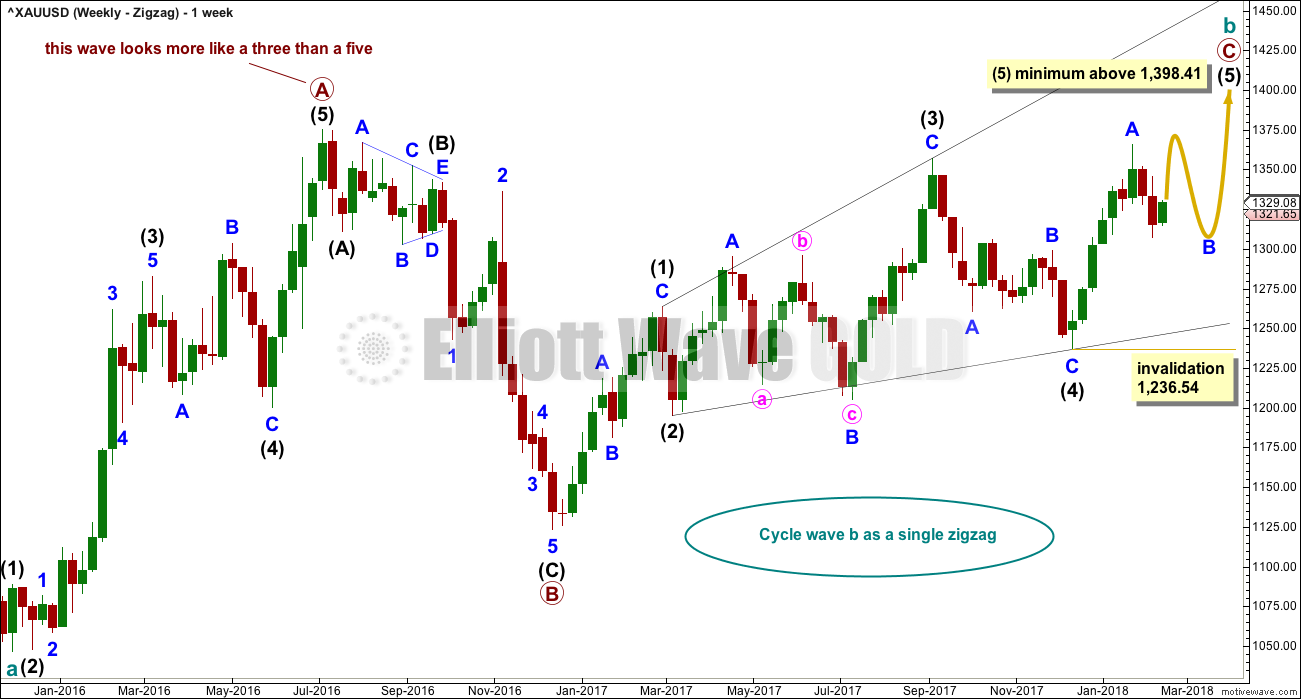
Cycle wave b may be a single zigzag. Zigzags subdivide 5-3-5. Primary wave C must subdivide as a five wave structure and may be either an impulse or an ending diagonal. Overlapping at this stage indicates an ending diagonal.
Within an ending diagonal, all sub-waves must subdivide as zigzags. Intermediate wave (4) must overlap into intermediate wave (1) price territory. This diagonal is expanding: intermediate wave (3) is longer than intermediate wave (1) and intermediate wave (4) is longer than intermediate wave (2). Intermediate wave (5) must be longer than intermediate wave (3), so it must end above 1,398.41 where it would reach equality in length with intermediate wave (3).
Within the final zigzag of intermediate wave (5), minor wave B may not move beyond the start of minor wave A below 1,236.54.
Within intermediate wave (1), the correction labelled minor wave B was over within one week. Within intermediate wave (2), the correction labelled minor wave B was too quick to be seen on the weekly chart. Within intermediate wave (3), the correction labelled minor wave B was over in 12 weeks, one short of a Fibonacci 13. Within intermediate wave (4), the correction labelled minor wave B was over in a Fibonacci 8 weeks. As each actionary wave is extending in time as well as price, the correction of minor wave B within intermediate wave (5) may be longer than that within intermediate wave (3). At this early stage, a Fibonacci 13 or possibly even 21 weeks may be expected. This expectation is a rough guideline; flexibility is essential when B waves unfold.
This first weekly chart sees the upwards wave labelled primary wave A as a five wave structure. It must be acknowledged that this upwards wave looks better as a three than it does as a five. The fifth weekly chart below will consider the possibility that it was a three.
FIRST DAILY CHART
Click chart to enlarge.
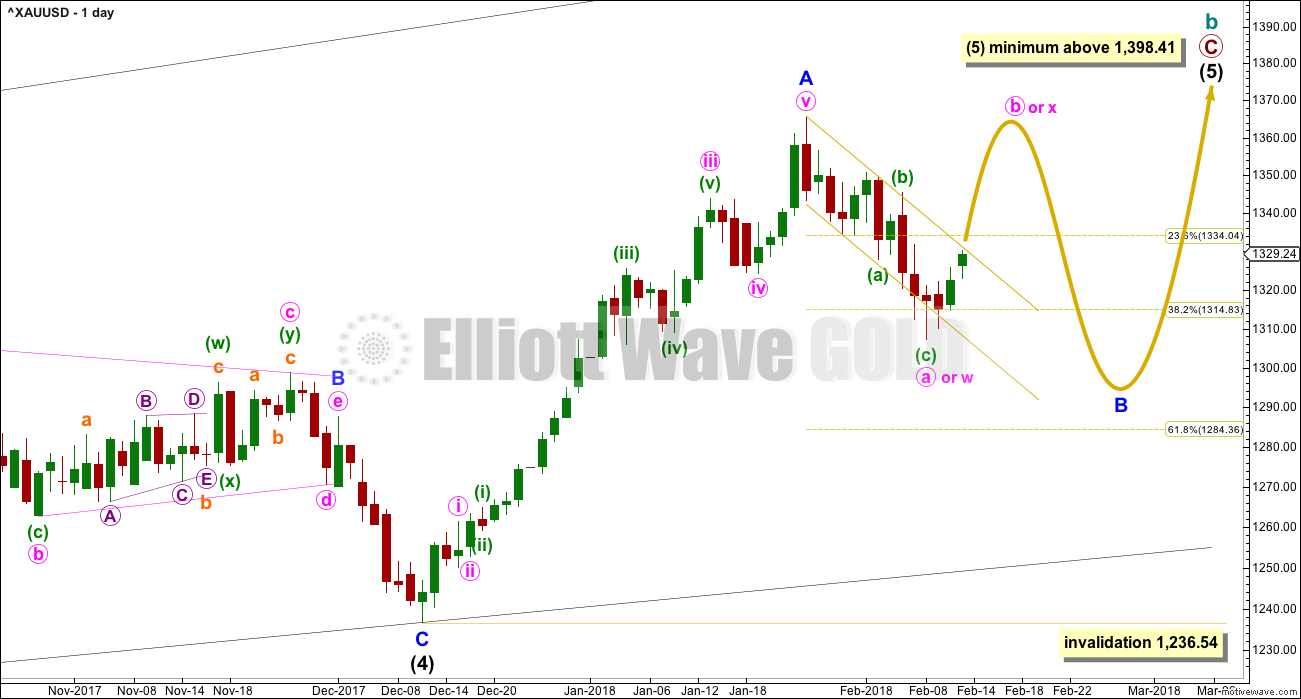
Within the ending diagonal, intermediate wave (5) must sub-divide as a zigzag.
Minor wave B may be a reasonably time consuming consolidation or a quicker sharper pullback within the upwards trend, and it may end about either of the 0.382 or 0.618 Fibonacci ratios (neither may be favoured).
There are more than 23 possible structures that minor wave B may take, and it is impossible until close to or at the end to have confidence which structure has unfolded. When B waves unfold, it is essential that analysis is flexible. B waves are analogous to either range bound consolidations or sharp corrections. As minor wave B unfolds, the labelling on the hourly chart for its sub-waves will change and alternates will be required from time to time.
The yellow arrow outlines the possible pathway for a flat or combination. These corrections are analogous to sideways range bound consolidations. Within both a flat and consolidation, minute wave b or x may make a new high above the start of minute wave a or w at 1,365.68.
Minor wave B may still be a triangle or zigzag. All possibilities must still be considered.
Minor wave B may not move beyond the start of minor wave A below 1,236.54.
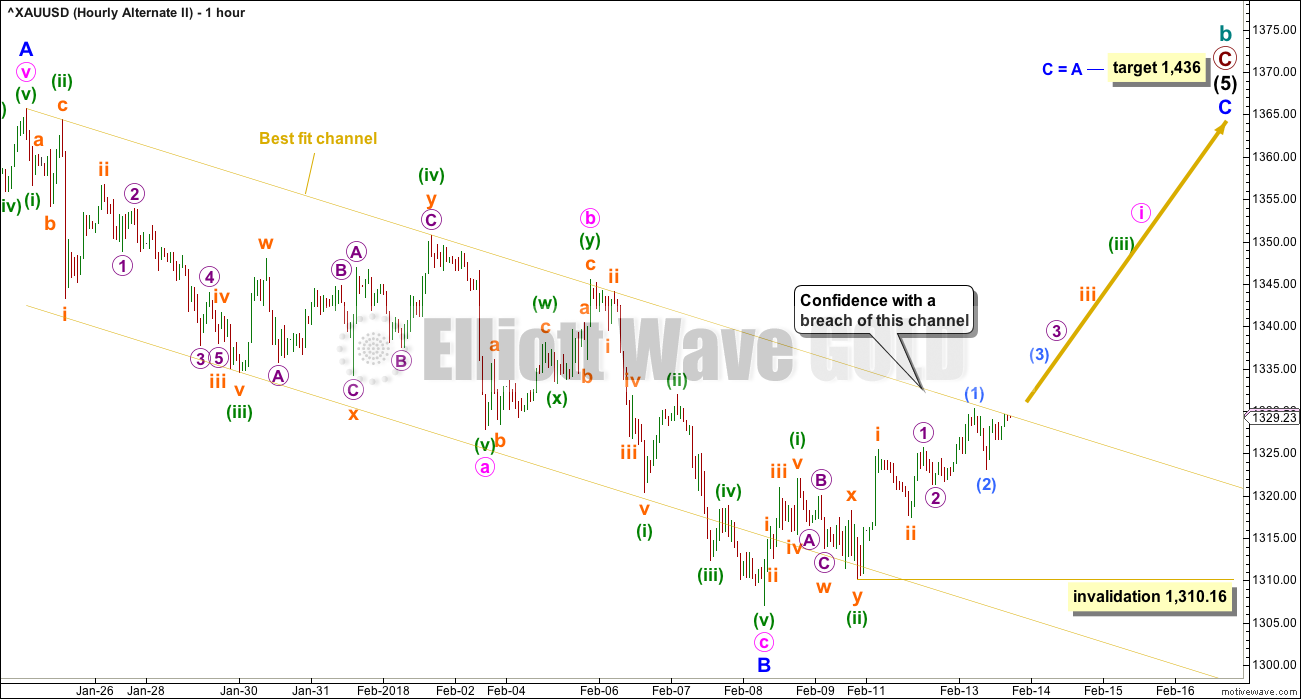
HOURLY CHART
Click chart to enlarge.
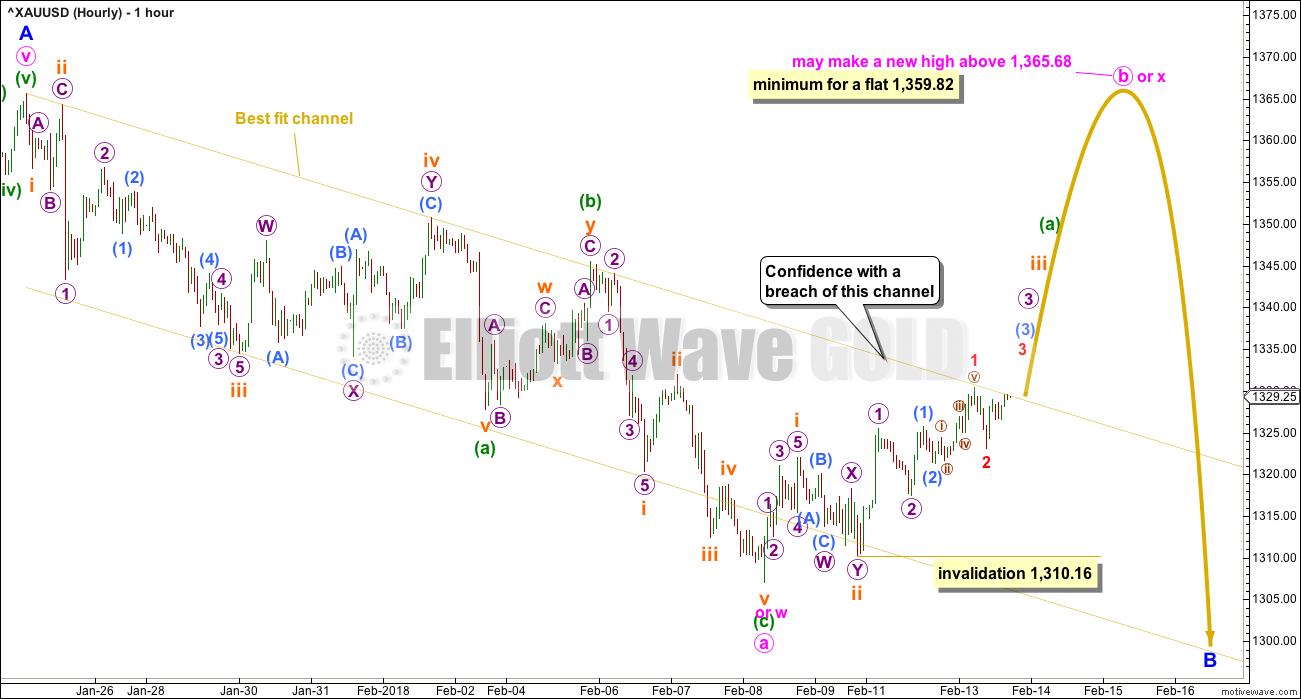
Volume analysis today favours the alternate hourly chart below and not this first hourly chart.
If a zigzag downwards is complete, then the current bounce should be very deep. When A waves subdivide as threes it indicates a flat, triangle, combination or double zigzag. All of flats, triangles and combinations have very deep B or X waves.
A double zigzag may also be continuing lower; the bounce may find resistance here at the upper edge of the yellow channel and may be labelled minute wave x.
The yellow channel must be breached by upwards movement (not sideways) for confidence in a deep bounce to continue higher today.
ALTERNATE HOURLY CHART
Click chart to enlarge.
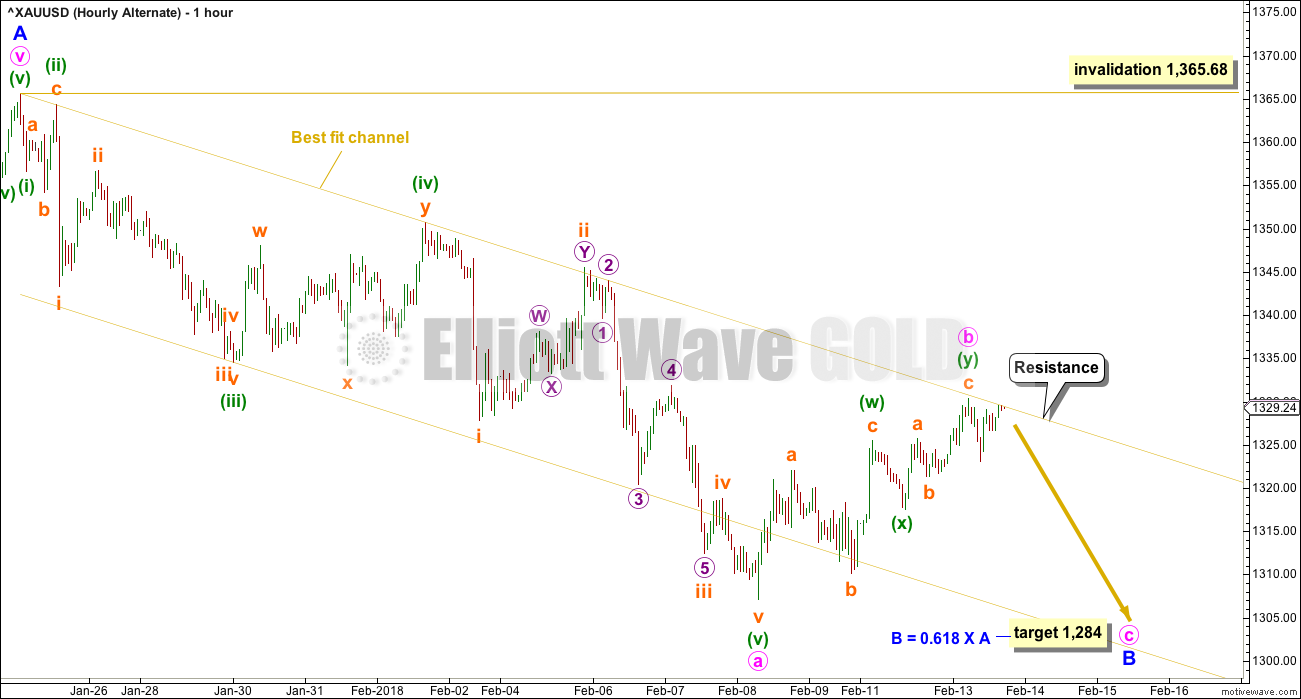
This first alternate hourly chart today is judged to be most likely. Classic analysis strongly favours it today.
A zigzag lower may be completing. This may be all of minor wave B as labelled, or again the degree of labelling may be moved down one and minute wave a only may be completing as a zigzag.
This wave count expects resistance to be very likely about the upper edge of the yellow channel.
If a single zigzag is completing lower, then minor wave B may be a relatively quick zigzag, ending close to the 0.618 Fibonacci ratio of minor wave A.
SECOND ALTERNATE HOURLY CHART
Click chart to enlarge.
This second alternate has the lowest probability of all three hourly charts today.
This wave count is the same as the first hourly wave count, with the exception of the degree of labelling. If the degree of labelling within the possible zigzag downwards is moved up one, then minor wave B may be complete already. It would be relatively shallow and brief though, which is the main reason for low probability.
If minor wave C is beginning, then it shows too much weakness over the last two days for any confidence in this wave count.
BEARISH ELLIOTT WAVE COUNT
FIFTH WEEKLY CHART
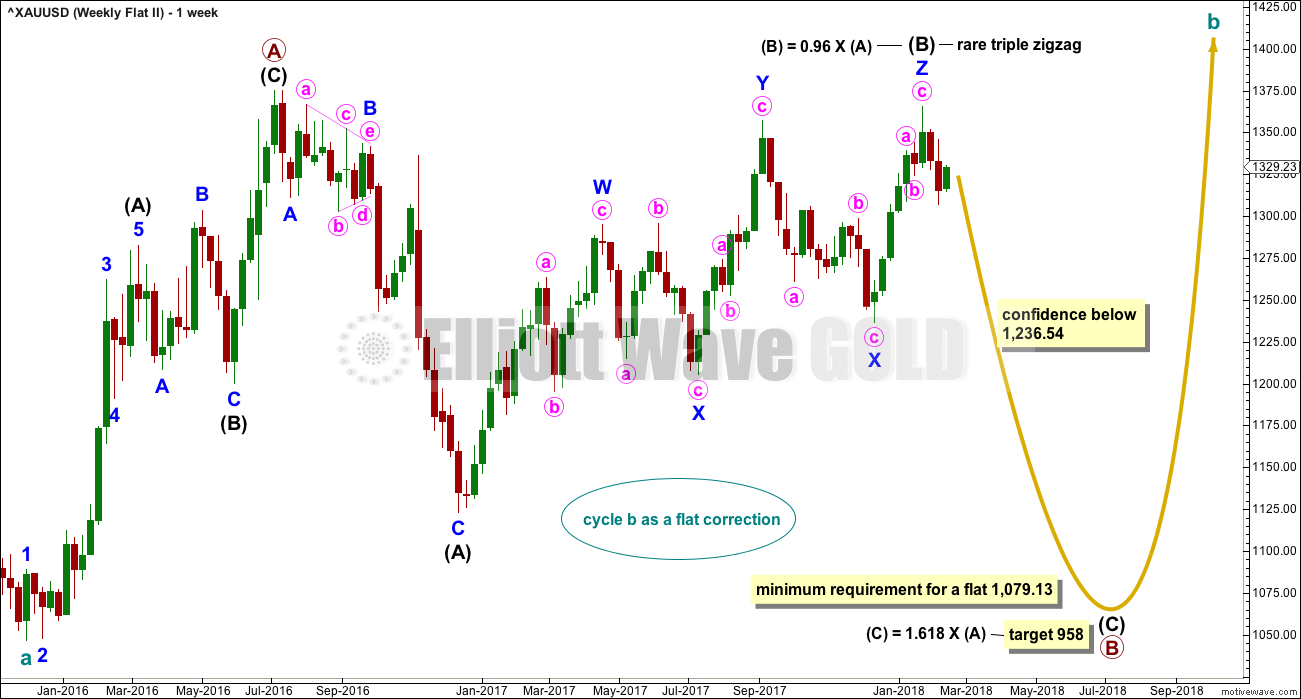
Click chart to enlarge.
There were five weekly charts published in the last historic analysis. This fifth weekly chart is the most immediately bearish wave count, so this is published as a bearish possibility.
This fifth weekly chart sees cycle wave b as a flat correction, and within it intermediate wave (B) may be a complete triple zigzag. This would indicate a regular flat as intermediate wave (B) is less than 1.05 the length of intermediate wave (A).
If cycle wave b is a flat correction, then within it primary wave B must retrace a minimum 0.9 length of primary wave A at 1,079.13 or below. The most common length of B waves within flats is from 1 to 1.38 times the length of the A wave. The target calculated would see primary wave B end within this range.
I have only seen two triple zigzags before during my 10 years of daily Elliott wave analysis. If this wave count turns out to be correct, this would be the third. The rarity of this structure is identified on the chart.
TECHNICAL ANALYSIS
WEEKLY CHART
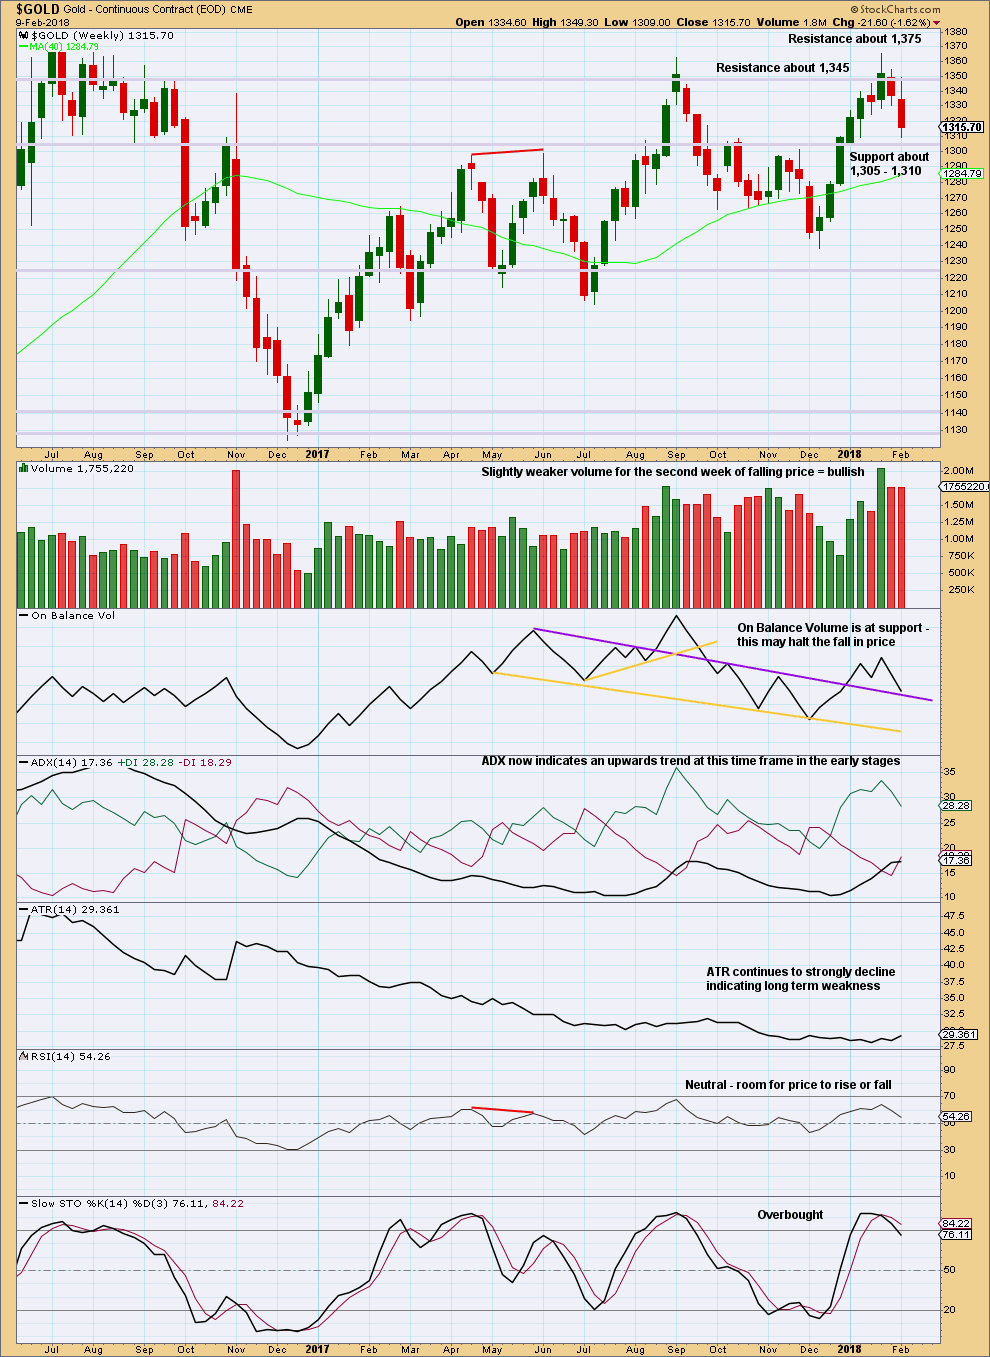
Click chart to enlarge. Chart courtesy of StockCharts.com.
Support for price about 1,310 – 1,305 and support for On Balance Volume may halt the fall in price here.
However, RSI and Stochastics indicate there is plenty of room for price to fall further. If support about 1,310 – 1,305 gives way, then next support is about 1,225.
A breakout above 1,375 on a day with strong volume would have to occur for the bullish case to have strong confidence.
DAILY CHART
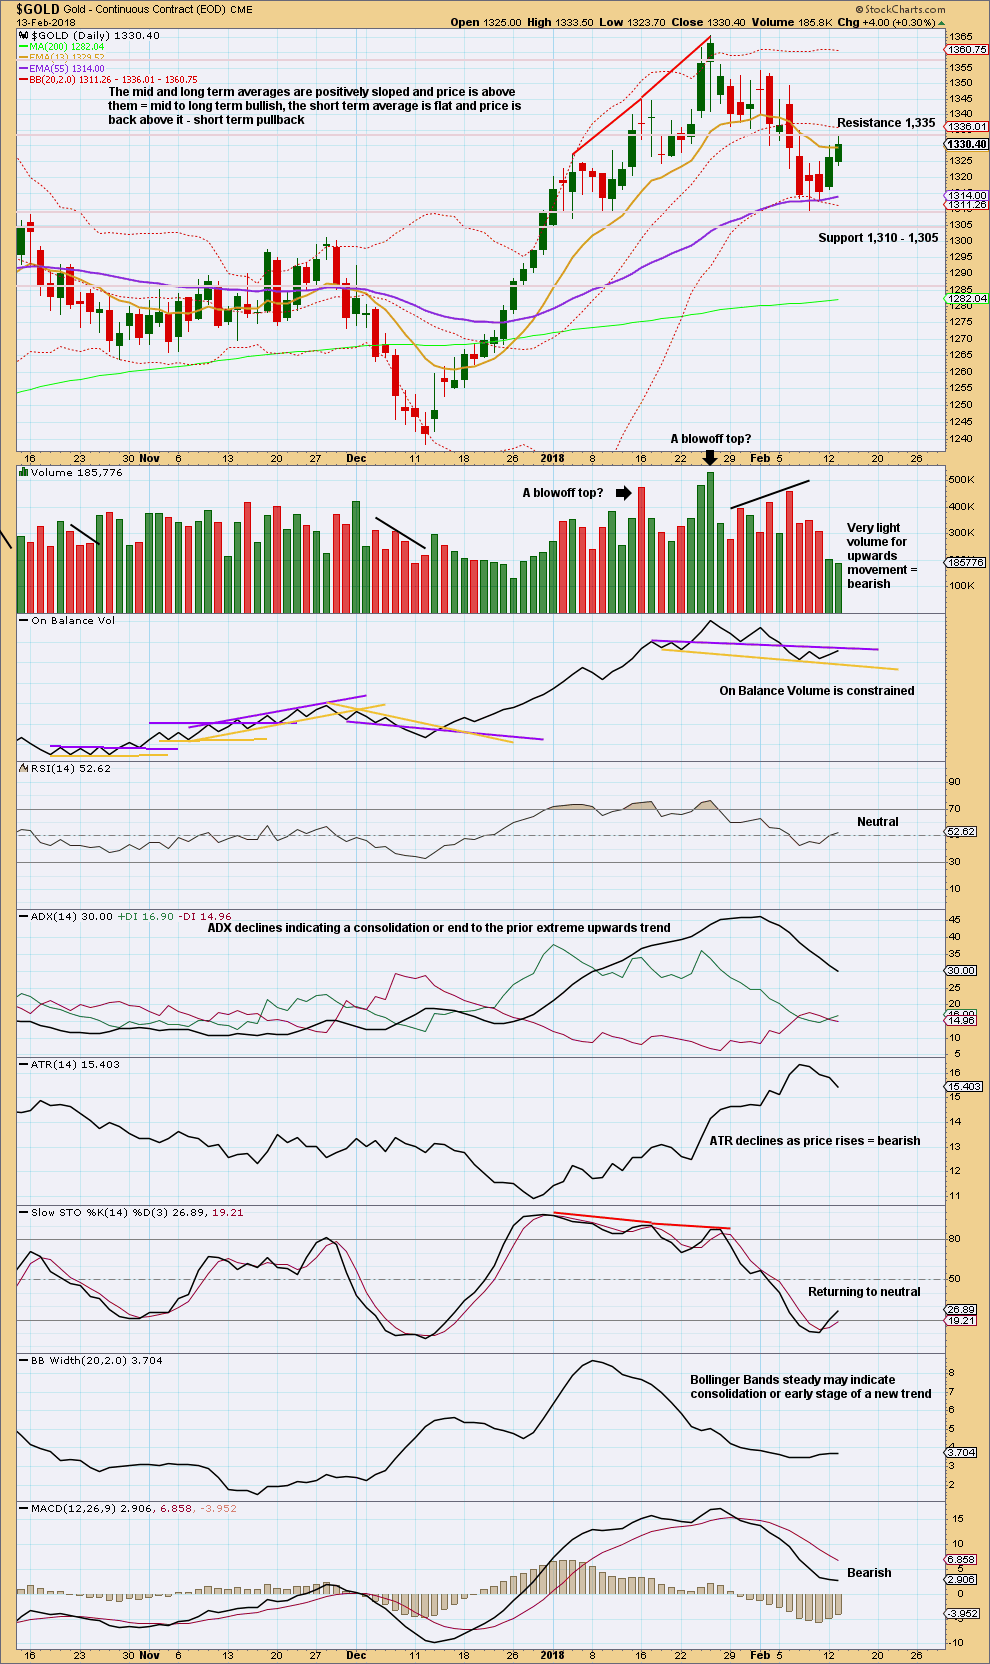
Click chart to enlarge. Chart courtesy of StockCharts.com.
Volume strongly suggests the last two green daily candlesticks are a bounce within an ongoing downwards wave.
Price is at resistance about 1,335 and On Balance Volume is at resistance. This may halt the rise in price here.
ADX is declining after reaching very extreme for the prior upwards trend. The directional lines are whipsawing. This downwards move in price may be either a consolidation within an ongoing upwards trend, or a new downwards trend. ADX is a lagging indicator (it takes time for it to catch up with a new trend).
GDX WEEKLY CHART
Click chart to enlarge. Chart courtesy of StockCharts.com.
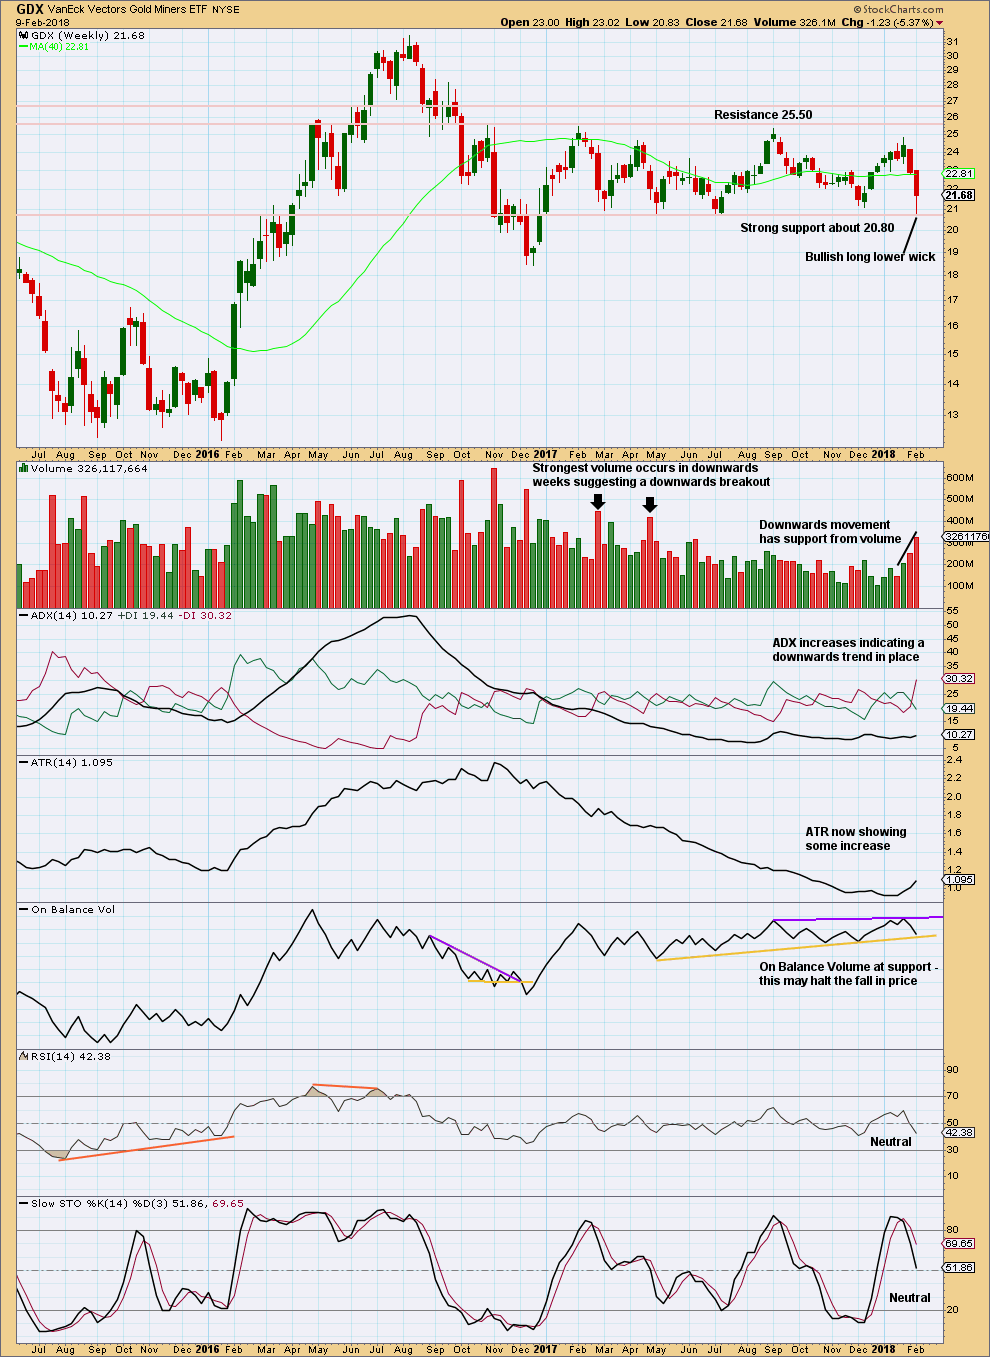
Support about 20.80 has been tested at least five times and so far has held. The more often a support area is tested and holds, the more technical significance it has.
In the first instance, expect this area to continue to provide support. Only a strong downwards day, closing below support and preferably with some increase in volume, would constitute a downwards breakout from the consolidation that GDX has been in for a year now.
Resistance is about 25.50. Only a strong upwards day, closing above resistance and with support from volume, would constitute an upwards breakout.
The long lower wick this week is fairly bullish. Look for an upwards swing now to resistance.
GDX DAILY CHART
Click chart to enlarge. Chart courtesy of StockCharts.com.
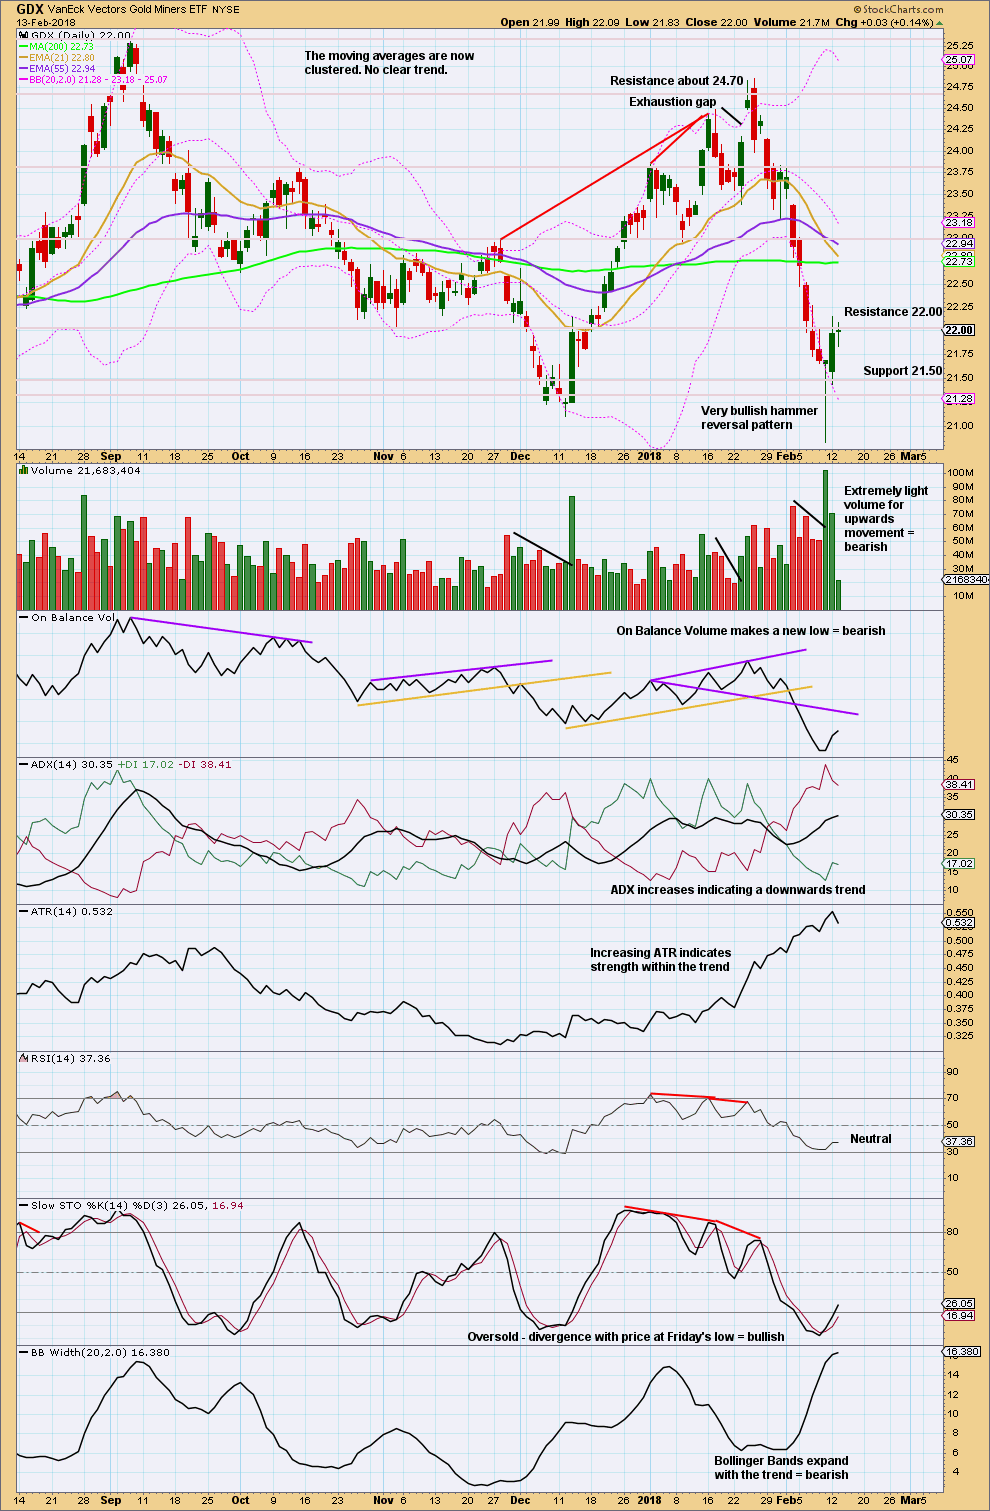
Extremely light volume for upwards movement today looks like the bounce for GDX might be over. If this is the case, then GDX may be ready to see a downwards breakout at the weekly chart level, below support.
ADX still indicates a downward trend for GDX, which is not extreme and has much further to go. Stochastics may return to oversold and remain there for a reasonable period of time, and RSI is not yet oversold.
There is room for price to fall. Can it break below support at 20.80?
Published @ 06:33 p.m. EST.
First hourly chart updated:
As soon as the trend line was breached this became the preferred wave count.
It doesn’t look like the structure is complete yet. Further up to go.
Gold BO above NL at 1324 then BT at 1316 now to the races higher at 1349.
Like my post of yesterday Lara’s main hourly EW count in play here and was confirming with bullish inv HnS pattern.
Looks like we did the drop lol lets see if it rebounds looks possible since 1320 held
Let´s do the hop 🙂
Is the first hourly now the preferred count since the trendline is broken?
Yes indeed.
Miners indeed looking quite frisky. Opened bull put spreads on JNUG yesterday now nicely in the green! 🙂