
A small inside day does not change the Elliott wave count at this time.
Summary: Two targets for a little more downwards movement are 1,310 and 1,300. Thereafter, look for an upwards swing to begin.
New updates to this analysis are in bold.
Grand SuperCycle analysis is here.
Last in-depth historic analysis with monthly and several weekly charts is here, video is here.
There are multiple wave counts at this time at the weekly and monthly chart levels. In order to make this analysis manageable and accessible only two will be published on a daily basis, one bullish and one bearish. This does not mean the other possibilities may not be correct, only that publication of them all each day is too much to digest. At this stage, they do not diverge from the two possibilities below.
BULLISH ELLIOTT WAVE COUNT
FIRST WEEKLY CHART
Click chart to enlarge.
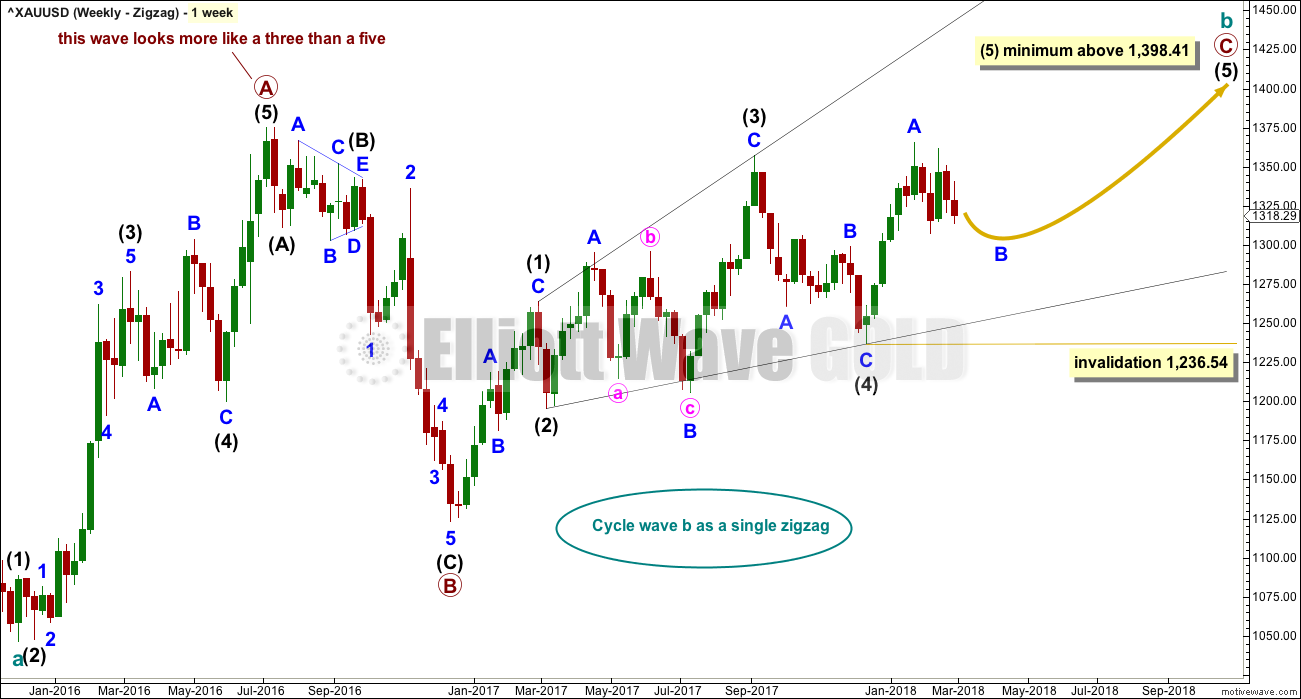
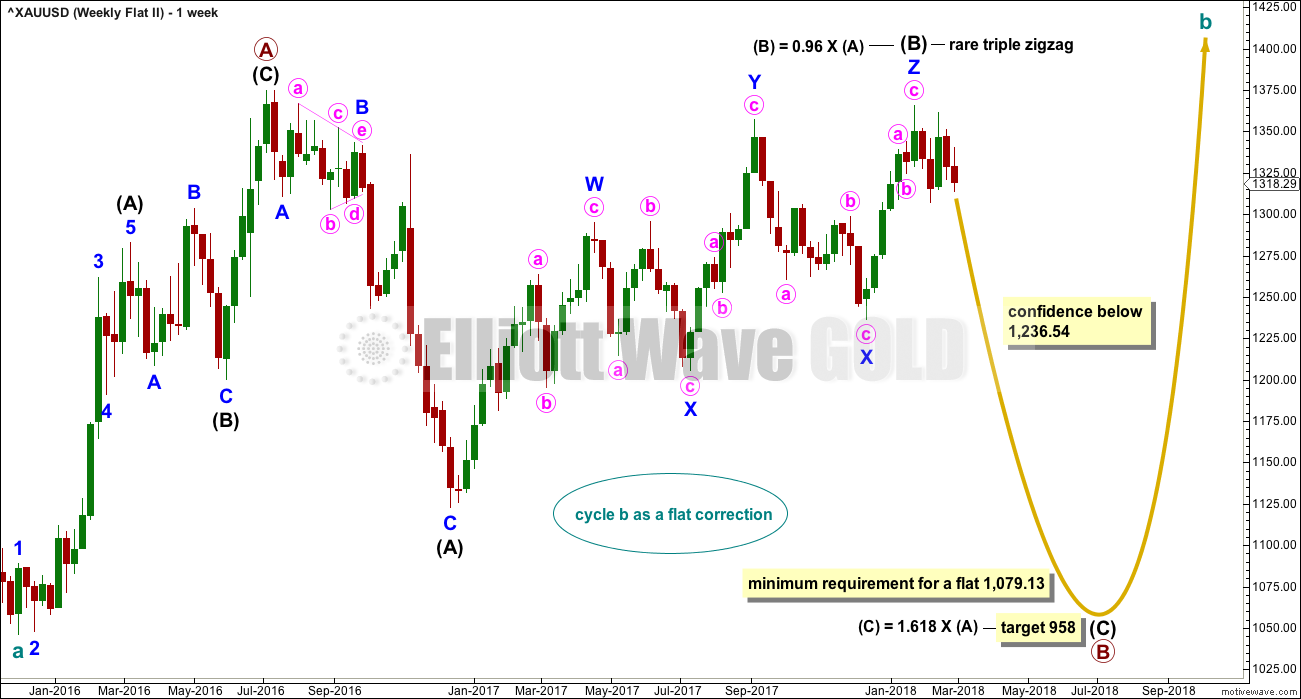
Cycle wave b may be a single zigzag. Zigzags subdivide 5-3-5. Primary wave C must subdivide as a five wave structure and may be either an impulse or an ending diagonal. Overlapping at this stage indicates an ending diagonal.
Within an ending diagonal, all sub-waves must subdivide as zigzags. Intermediate wave (4) must overlap into intermediate wave (1) price territory. This diagonal is expanding: intermediate wave (3) is longer than intermediate wave (1) and intermediate wave (4) is longer than intermediate wave (2). Intermediate wave (5) must be longer than intermediate wave (3), so it must end above 1,398.41 where it would reach equality in length with intermediate wave (3).
Within the final zigzag of intermediate wave (5), minor wave B may not move beyond the start of minor wave A below 1,236.54.
Within intermediate wave (1), the correction labelled minor wave B was over within one week. Within intermediate wave (2), the correction labelled minor wave B was too quick to be seen on the weekly chart. Within intermediate wave (3), the correction labelled minor wave B was over in 12 weeks, one short of a Fibonacci 13. Within intermediate wave (4), the correction labelled minor wave B was over in a Fibonacci 8 weeks. As each actionary wave is extending in time as well as price, the correction of minor wave B within intermediate wave (5) may be longer than that within intermediate wave (3). At this early stage, a Fibonacci 13 or possibly even 21 weeks may be expected. This expectation is a rough guideline; flexibility is essential when B waves unfold.
This first weekly chart sees the upwards wave labelled primary wave A as a five wave structure. It must be acknowledged that this upwards wave looks better as a three than it does as a five. The fifth weekly chart below will consider the possibility that it was a three.
FIRST DAILY CHART
Click chart to enlarge.
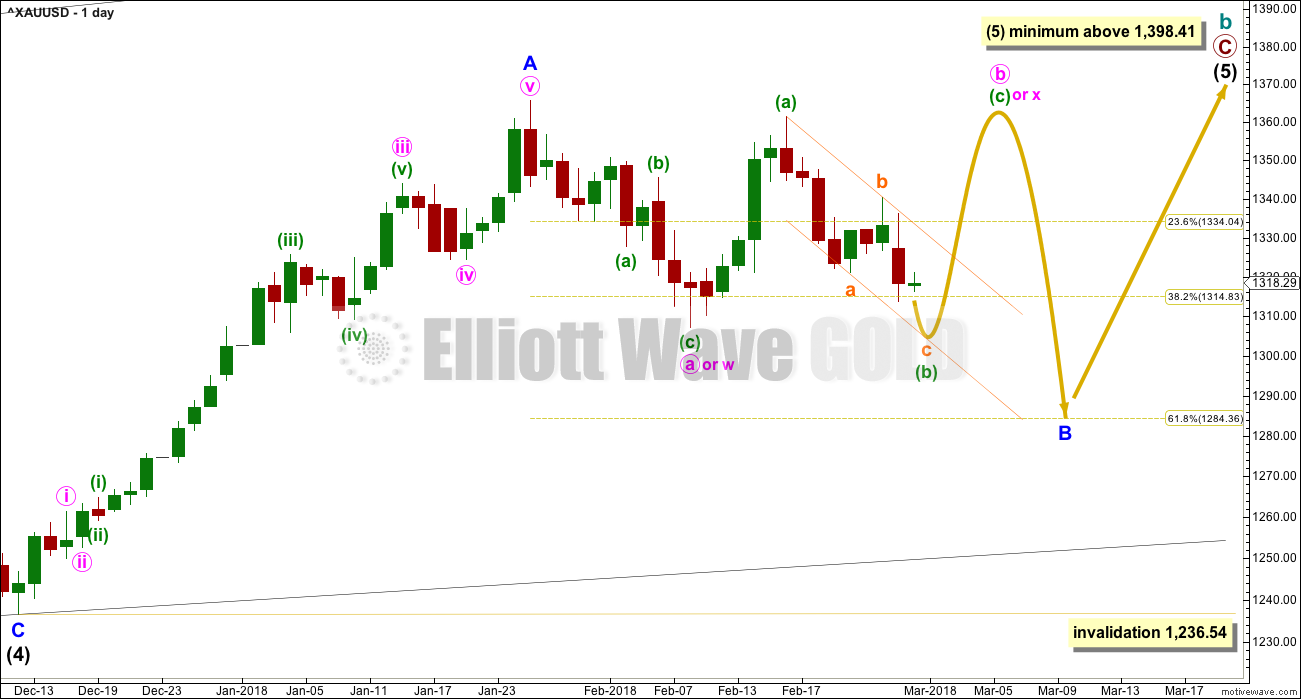
Within the ending diagonal, intermediate wave (5) must sub-divide as a zigzag.
Minor wave B may be a reasonably time consuming consolidation or a quicker sharper pullback within the upwards trend, and it may end about either of the 0.382 or 0.618 Fibonacci ratios (neither may be favoured). At this stage, it looks more likely that minor wave B may be a more time consuming sideways consolidation. Although it is possible that minor wave B could have been over at the low on the 8th of February as a quick shallow pullback, which is considered in the alternate daily chart today.
There are more than 23 possible structures that minor wave B may take, and it is impossible until close to or at the end to have confidence which structure has unfolded. When B waves unfold, it is essential that analysis is flexible. B waves are analogous to either range bound consolidations or sharp corrections. As minor wave B unfolds, the labelling on the hourly chart for its sub-waves will change and alternates will be required.
The yellow arrows outline the possible pathway for an expanded flat for minor wave B. Members are strongly advised that this pathway is only one possible pathway of many. It is chosen to illustrate one of the most common structures for a B wave. This pathway may change as minor wave B continues further. If it does, then the labelling on hourly charts will change.
Minor wave B may still be a triangle or zigzag. All possibilities must still be considered.
Minor wave B may not move beyond the start of minor wave A below 1,236.54.
Within minor wave B, the middle of it labelled minute wave b looks incomplete. So far it looks like it may be subdividing as a flat or a zigzag. Within the correction of minute wave b, minuette wave (b) looks like a zigzag. Because minuette wave (a) may have been a zigzag, minuette wave (b) may make a new low below the start of minuette wave (a) at 1,307.09.
This wave count at this time sees price now within a B wave at three degrees. This point in time during the consolidation is the hardest to analyse and trade. The amount of variety in behaviour and structure at this time is huge.
HOURLY CHART
Click chart to enlarge.
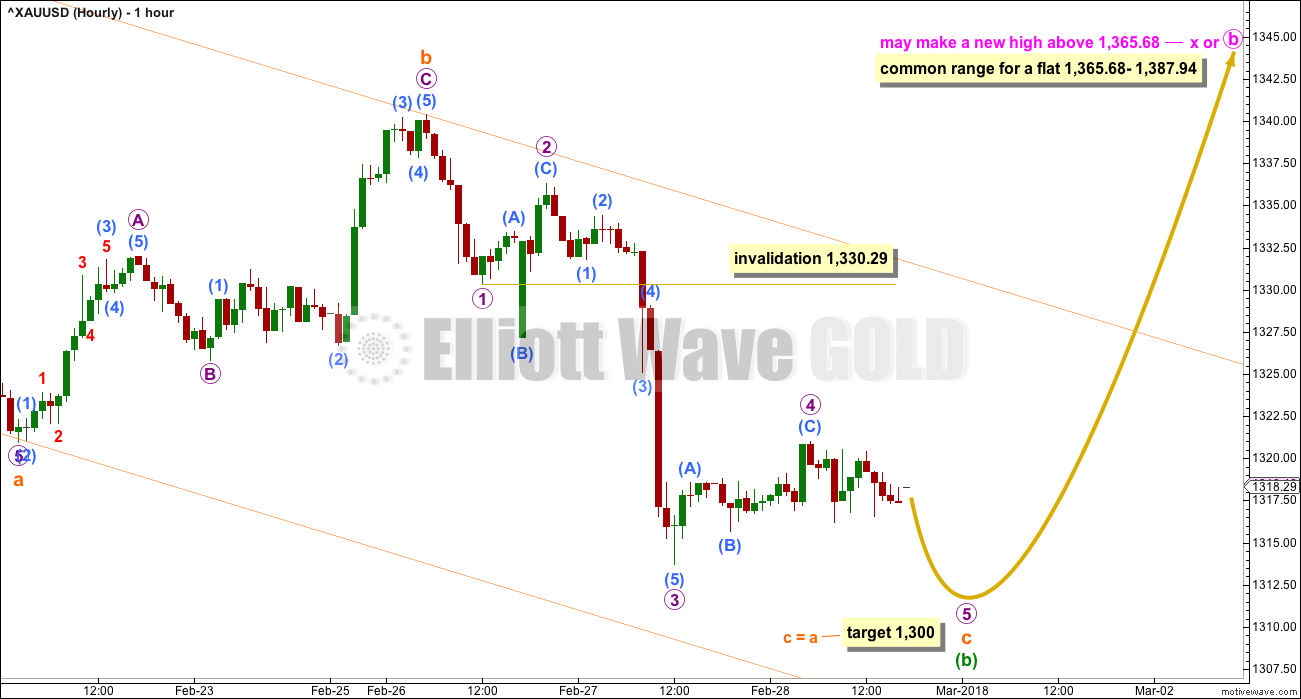
The consolidation for minor wave B continues. It may still be any one of a flat, combination, triangle or double zigzag. This first hourly chart looks at the possibility that minor wave B may be a flat, triangle or combination.
Within minor wave B, minute wave b may be incomplete. It may be unfolding as a zigzag. It may also be a flat correction if minuette wave (a) is seen as a three wave zigzag.
Within minute wave b, minuette wave (b) may be continuing lower as a single zigzag. Two targets are now given for minuette wave (b) to end. If price gets down to the first target and the structure of micro wave 5 is incomplete, or if price keeps falling through the first target, then use the second target.
When minuette wave (b) is complete and finds support, then an upwards swing for minuette wave (c) would be expected to begin, to end above the end of minuette wave (a) at 1,361.46 to avoid a truncation.
Subminuette wave c must subdivide as a five wave structure; at this time, it looks like it is unfolding as an impulse. Within the impulse, micro wave 4 may not move into micro wave 1 price territory above 1,330.29.
The orange channel is copied over from the daily chart. Look for support about the lower edge. When the upper edge of the channel is breached by upwards movement, then expect an end to this downwards swing and the start of a new upwards swing.
ALTERNATE DAILY CHART
Click chart to enlarge.
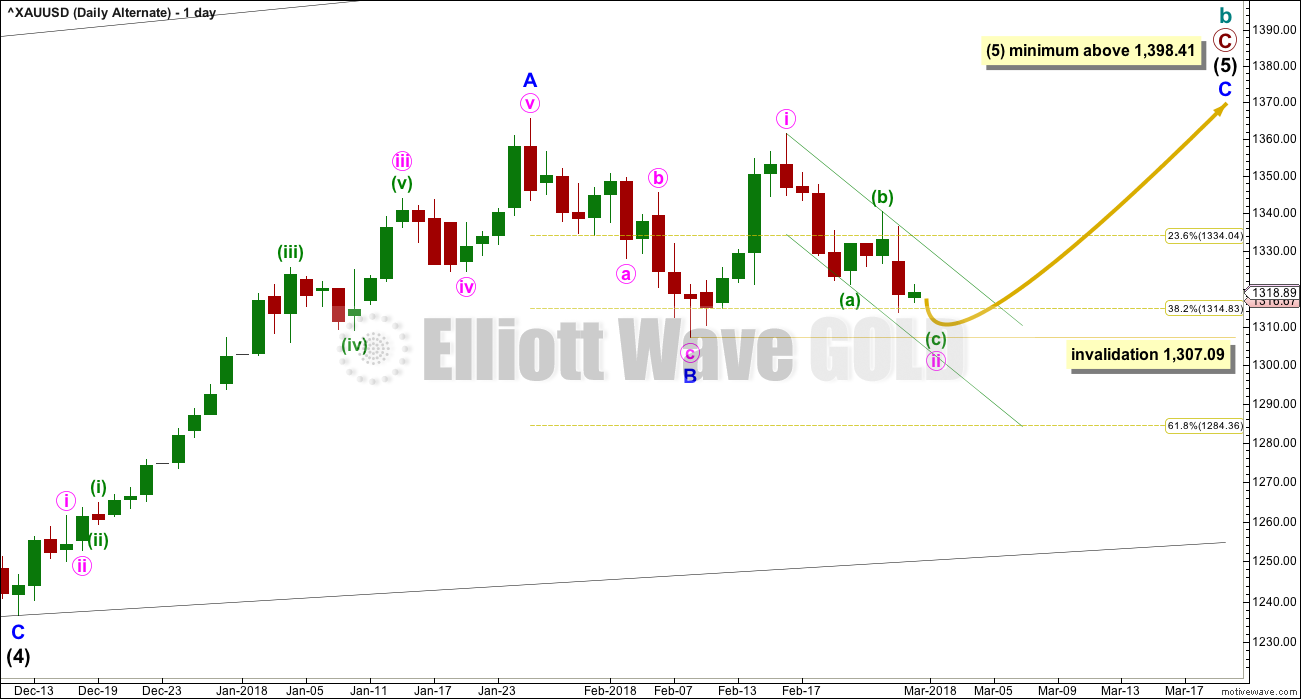
This alternate wave count considers the possibility that minor wave B may be over as a relatively quick sharp zigzag.
Within minor wave C, minute wave i may be complete. Minute wave ii may need a slight new low to complete the structure in the same way as the zigzag downwards for the main wave count needs a new low.
Minute wave ii may not move beyond the start of minute wave i below 1,307.09.
BEARISH ELLIOTT WAVE COUNT
FIFTH WEEKLY CHART
Click chart to enlarge.
There were five weekly charts published in the last historic analysis. This fifth weekly chart is the most immediately bearish wave count, so this is published as a bearish possibility.
This fifth weekly chart sees cycle wave b as a flat correction, and within it intermediate wave (B) may be a complete triple zigzag. This would indicate a regular flat as intermediate wave (B) is less than 1.05 the length of intermediate wave (A).
If cycle wave b is a flat correction, then within it primary wave B must retrace a minimum 0.9 length of primary wave A at 1,079.13 or below. The most common length of B waves within flats is from 1 to 1.38 times the length of the A wave. The target calculated would see primary wave B end within this range.
I have only seen two triple zigzags before during my 10 years of daily Elliott wave analysis. If this wave count turns out to be correct, this would be the third. The rarity of this structure is identified on the chart.
TECHNICAL ANALYSIS
WEEKLY CHART
Click chart to enlarge. Chart courtesy of StockCharts.com.
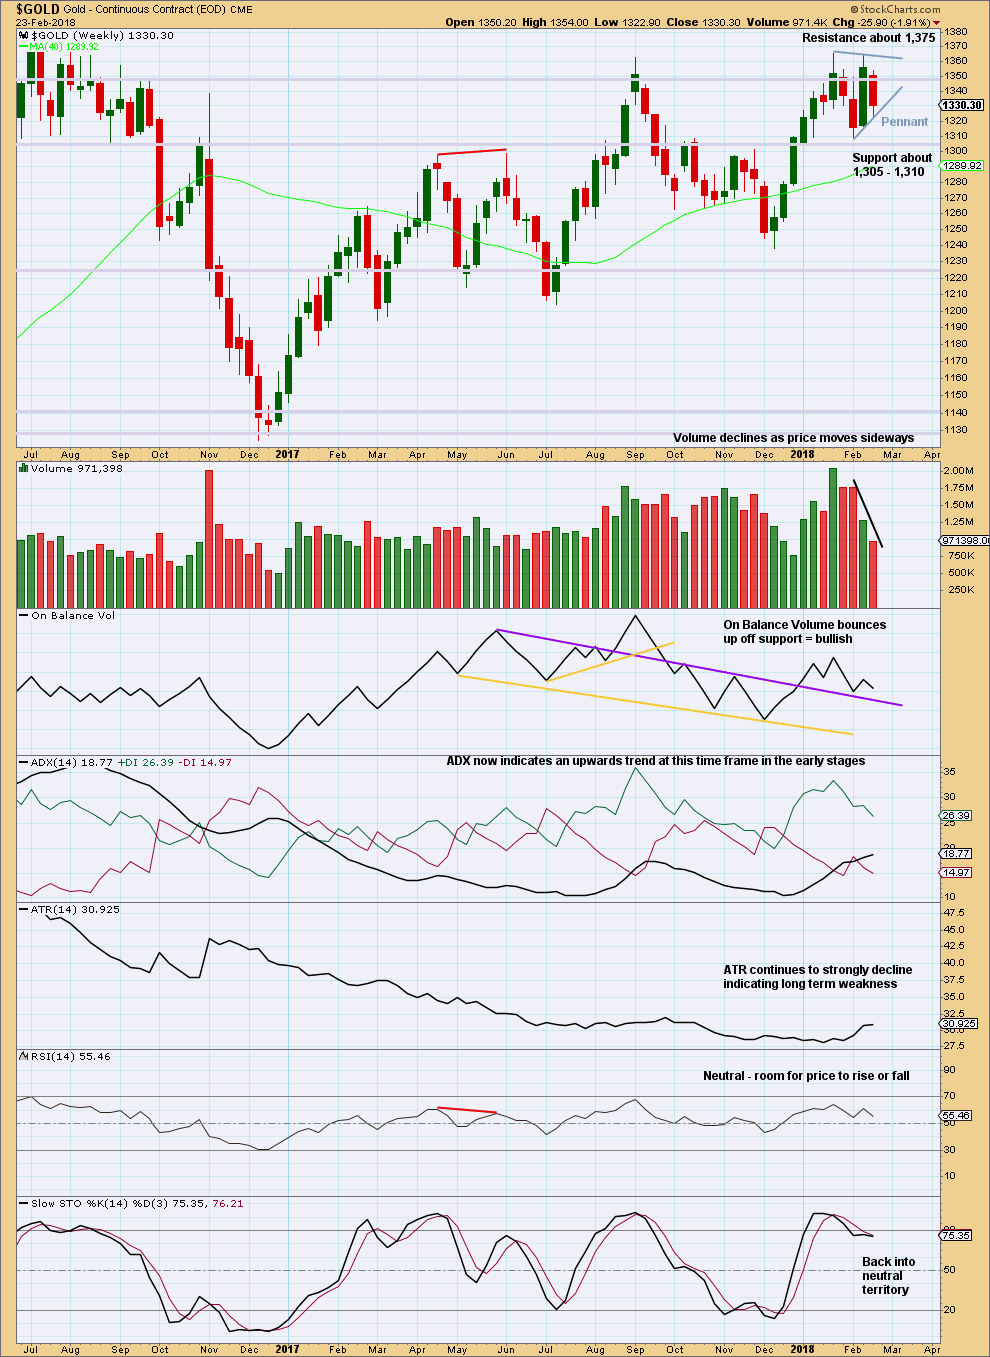
At the weekly time frame, ADX now indicates an upwards trend but price is still range bound with resistance about 1,375 and support finally about 1,225.
Strongest weekly volume of recent weeks is an upwards week, which is bullish. The last signal from On Balance Volume is bullish. This supports the main daily Elliott wave count.
A pennant pattern may be forming. If this is a pennant, already 4 weeks in duration, then it should conclude very soon. If it continues, then it would be a triangle which may be either a reversal or continuation pattern.
DAILY CHART
Click chart to enlarge. Chart courtesy of StockCharts.com.
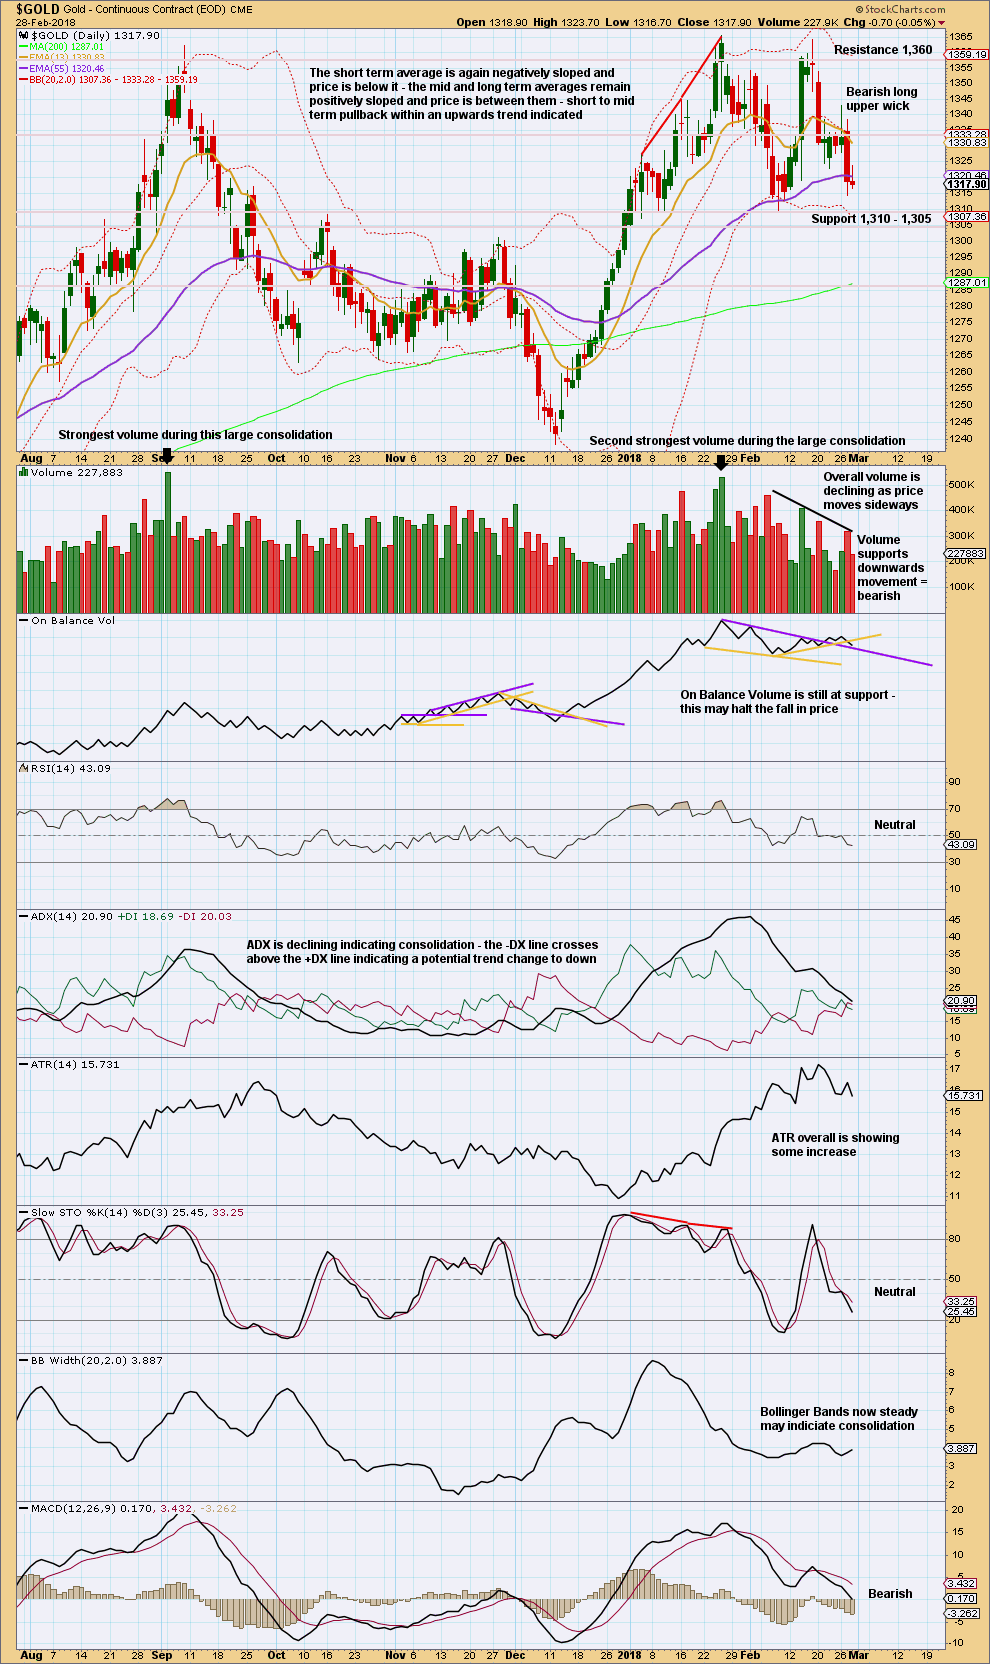
Looking at the bigger picture, Gold has been within a large consolidation since about January 2017 (this chart does not show all of this large consolidation), and during this consolidation it is two upwards days that have strongest volume and an upwards week that has strongest volume. Volume suggests an upwards breakout may be more likely than downwards.
Currently, Gold is within a smaller consolidation that began in early January 2018. This consolidation is delineated by support about 1,310 to 1,305 and resistance (final) about 1,375. It is an upwards day during this smaller consolidation that has strongest volume, suggesting an upwards breakout may be more likely here than downwards.
Price is currently swinging from resistance to support and back again. Price does not move in a straight line when it is within a consolidation and swings. Consolidations are characterised by very choppy, overlapping movement. Resistance or support may be overshot, only to then see price turn and move back within the zone. An approach to consolidations using classic analysis is normally to wait for a breakout before looking to enter a position. An upwards breakout should have support from volume for confidence. A downwards breakout does not necessarily need support from volume, but it is nice to have it.
ADX usually declines and the +DX and -DX lines may whipsaw during a consolidation.
With On Balance Volume still at support today, this may halt the fall in price about here. However, Stochastics is not yet oversold, so there is a little room for price to fall further towards support before a downwards swing may be complete.
A small inside day today on light volume does not change the short term outlook.
GDX WEEKLY CHART
Click chart to enlarge. Chart courtesy of StockCharts.com.
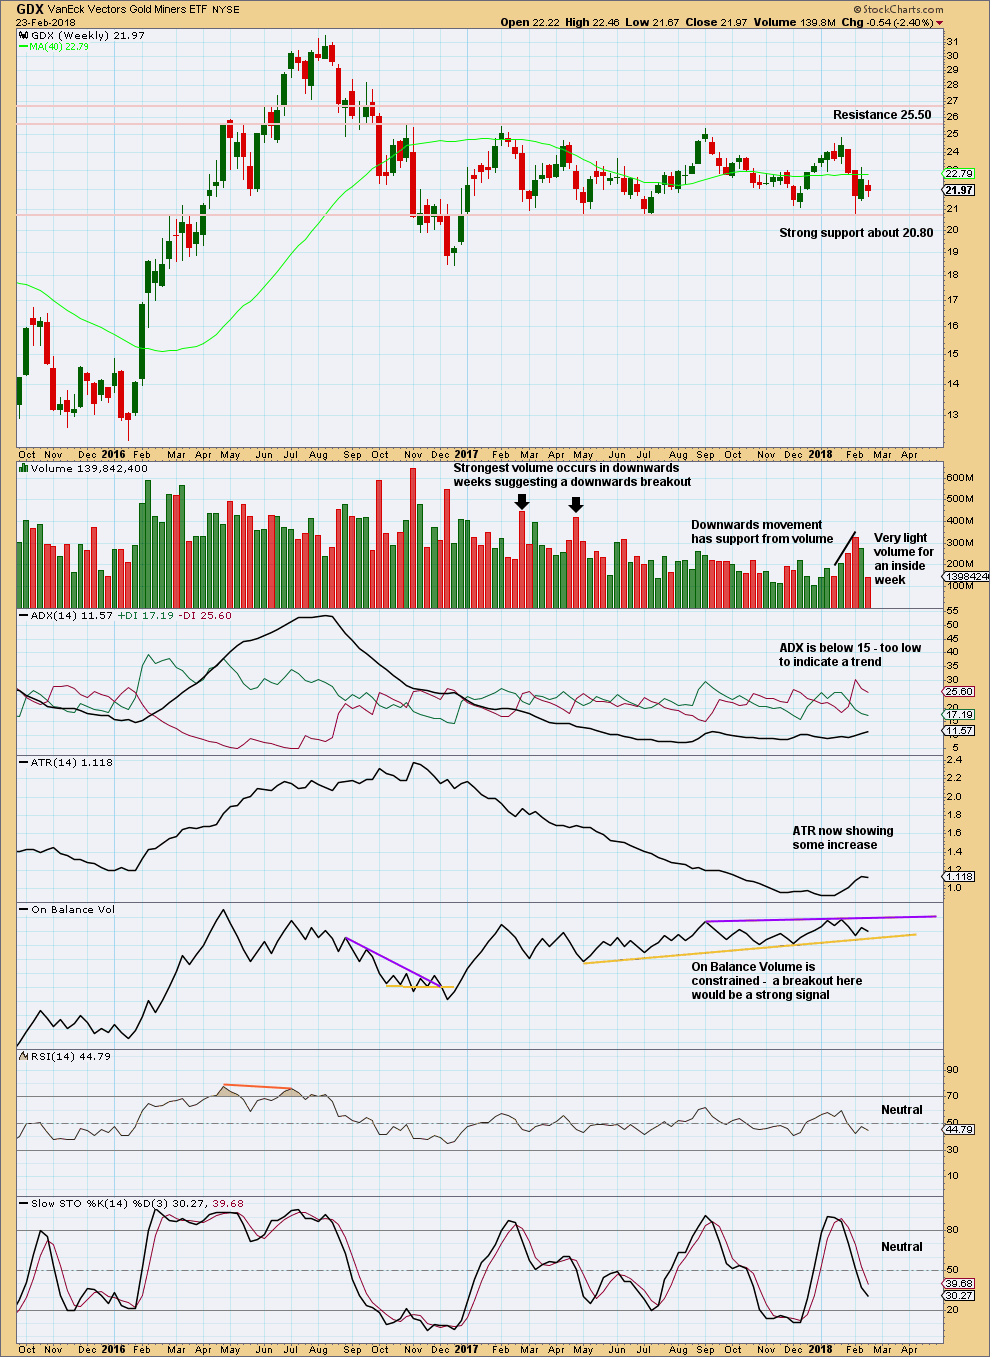
Support about 20.80 has been tested about seven times and so far has held. The more often a support area is tested and holds, the more technical significance it has.
In the first instance, expect this area to continue to provide support. Only a strong downwards day, closing below support and preferably with some increase in volume, would constitute a downwards breakout from the consolidation that GDX has been in for a year now.
Resistance is about 25.50. Only a strong upwards day, closing above resistance and with support from volume, would constitute an upwards breakout.
On Balance Volume should be watched closely. A breakout there may signal the breakout direction for price.
GDX DAILY CHART
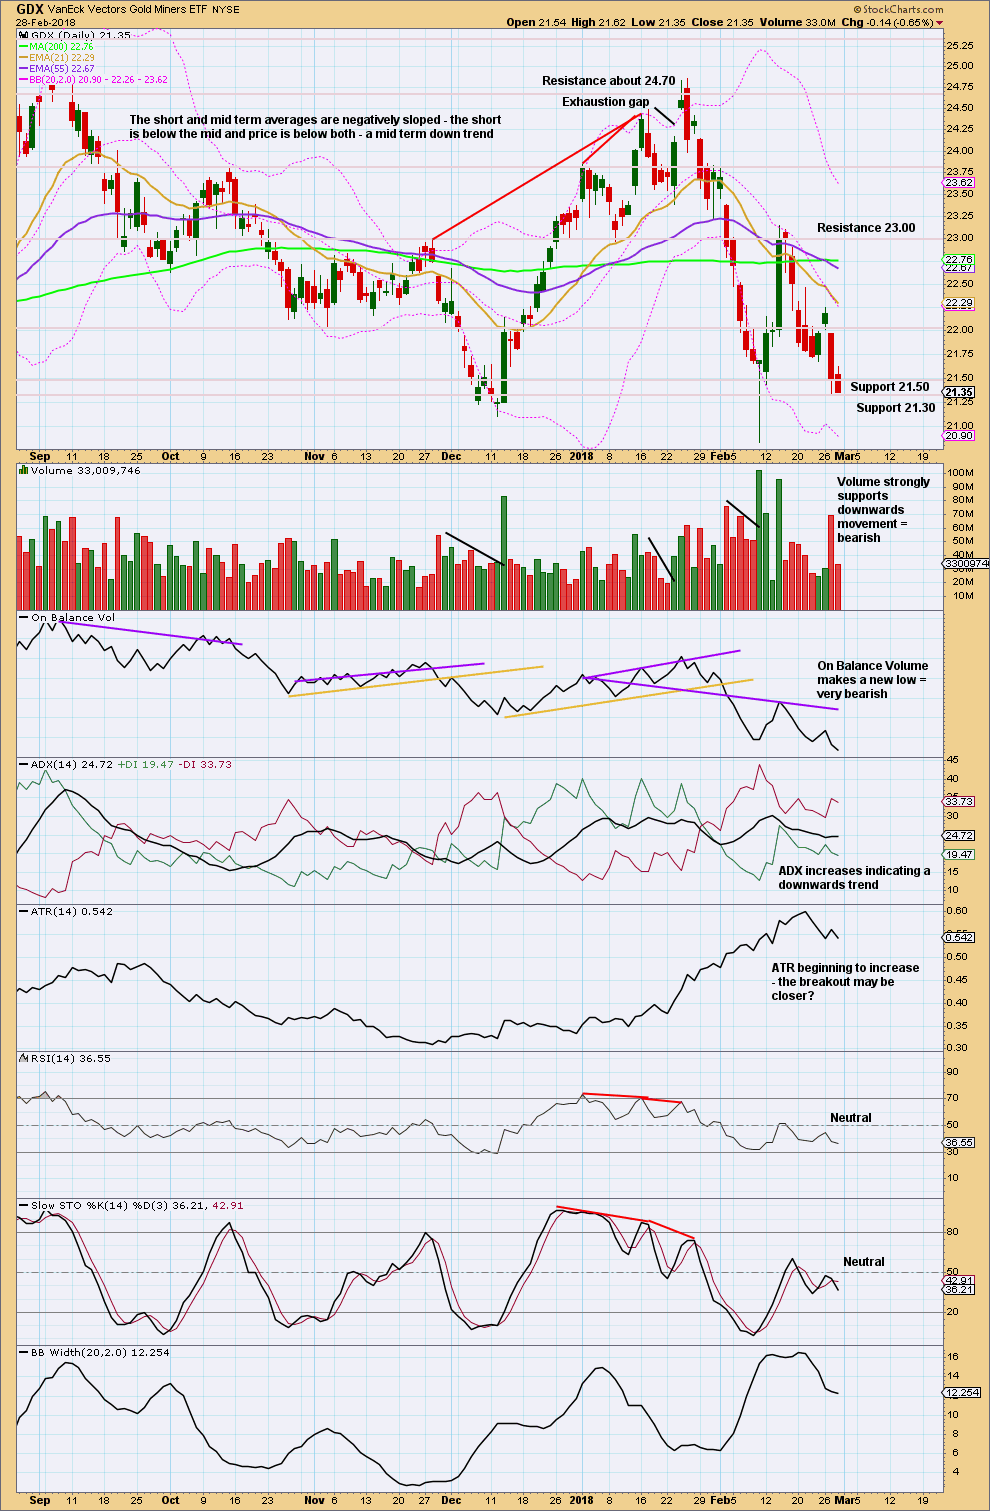
Click chart to enlarge. Chart courtesy of StockCharts.com.
Next support is about 20.85.
The shaven bottom of today’s candlestick is bearish.
Published @ 06:42 p.m. EST.
A very long lower wick is developing on the daily candlestick. If that holds it will be very bullish, particularly as the low is in a very strong support zone.
The target at 1,391 may be too high, but it is still reasonable. An expanded flat looks to be unfolding for minute wave b. Expanded flats have B waves that are 1.05 the length of the A wave, or longer. Here minuette (b) meets that requirement at 1.07 X minute wave (a).
The most common Fibonacci ratio for minuette (c) within an expanded flat is 1.618 X minuette wave (a). Hence the target.
This should take a few days.
Nice Lara! Gold is following cue from main wave count. AT 1306 now it should turn now.
Just $3.08 short of the lower target.
Now looks like its turned and should be on the way up for a few days.
Thanks, Lara! 🙂
Perfect! Closed out short leg of GDX bear call spread yesterday. Holding 24 strike calls for ride up. Will add as turn confirmed. 🙂