
US OIL ANALYSIS
Last analysis expected Oil had made a high. A breach of the channel on the daily chart added confidence to this view. Thereafter, Oil has continued to fall as expected.
Summary: The target is at 13.39. In the short term, look out for a bounce that should not make a new high above 66.65 if the main wave count is correct.
An upcoming bounce may be an opportunity to join a long term downwards trend at a good price.
Always practice good risk management as the most important aspect of trading. Always trade with stops and invest only 1-5% of equity on any one trade. Failure to manage risk is the most common mistake new traders make.
MAIN WAVE COUNT
MONTHLY CHART
Click chart to enlarge.
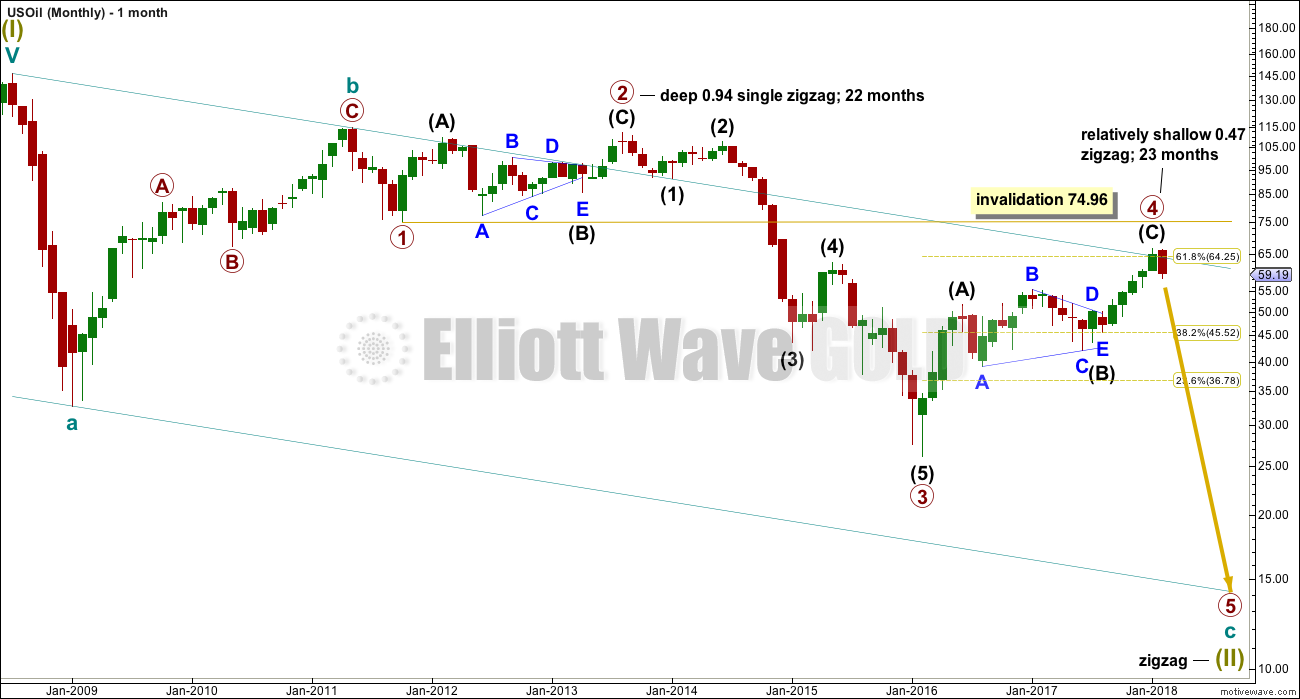
Within the bear market, cycle wave b is seen as ending in May 2011. Thereafter, a five wave structure downwards for cycle wave c begins.
Primary wave 1 is a short impulse lasting five months. Primary wave 2 is a very deep 0.94 zigzag lasting 22 months. Primary wave 3 is a complete impulse with no Fibonacci ratio to primary wave 1. It lasted 30 months.
There is alternation in depth with primary wave 2 very deep and primary wave 4 relatively shallow. There is inadequate alternation in structure, both are zigzags. So far primary wave 4 has lasted 23 months. At this stage, there is almost perfect proportion between primary waves 2 and 4.
Primary wave 4 may not move into primary wave 1 price territory above 74.96.
The wider Elliott channel (teal) about this whole movement may offer support to primary wave 5.
Price closed above the teal resistance line, the upper edge of this very wide channel. This wave count expected it would be fairly likely that primary wave 4 should have found resistance there. Because this line is now breached on the daily chart a new alternate is considered below.
WEEKLY CHART
Click chart to enlarge.
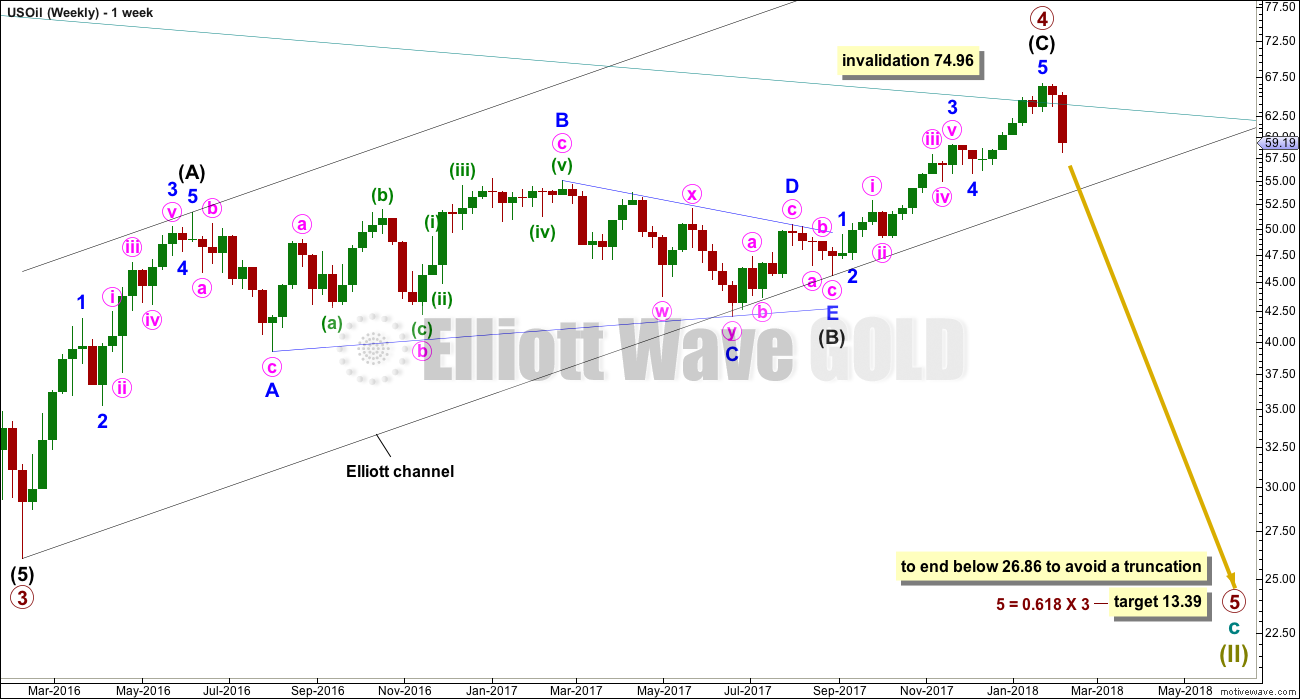
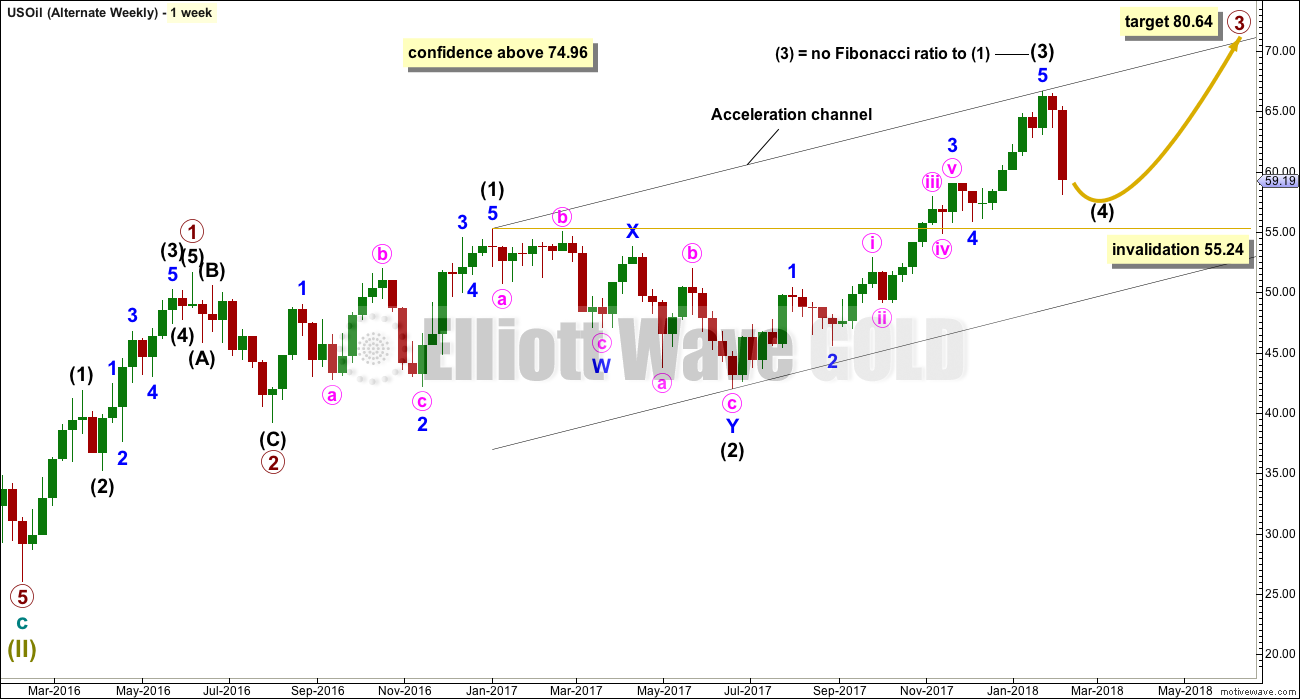
Primary wave 4 subdivides as a zigzag, and within it intermediate wave (C) may now be complete. If primary wave 5 were to only reach equality in length with primary wave 3, it would end with a small truncation. A target for primary wave 5 may best be calculated at intermediate degree. That can only be done when intermediate waves (1) through to (4) within primary wave 5 are complete.
For now a target will be calculated at primary degree using a ratio between primary waves 3 and 5. This target only has a small probability. This target will be recalculated as primary wave 5 nears its end, so it may change.
An Elliott channel is added to this possible zigzag for primary wave 4. A breach of the lower edge of this channel would provide a very strong indication that primary wave 4 should be over and primary wave 5 should be underway. Look out for some support on the way down, perhaps a short term bounce about the lower edge of the channel.
DAILY CHART
Click chart to enlarge.
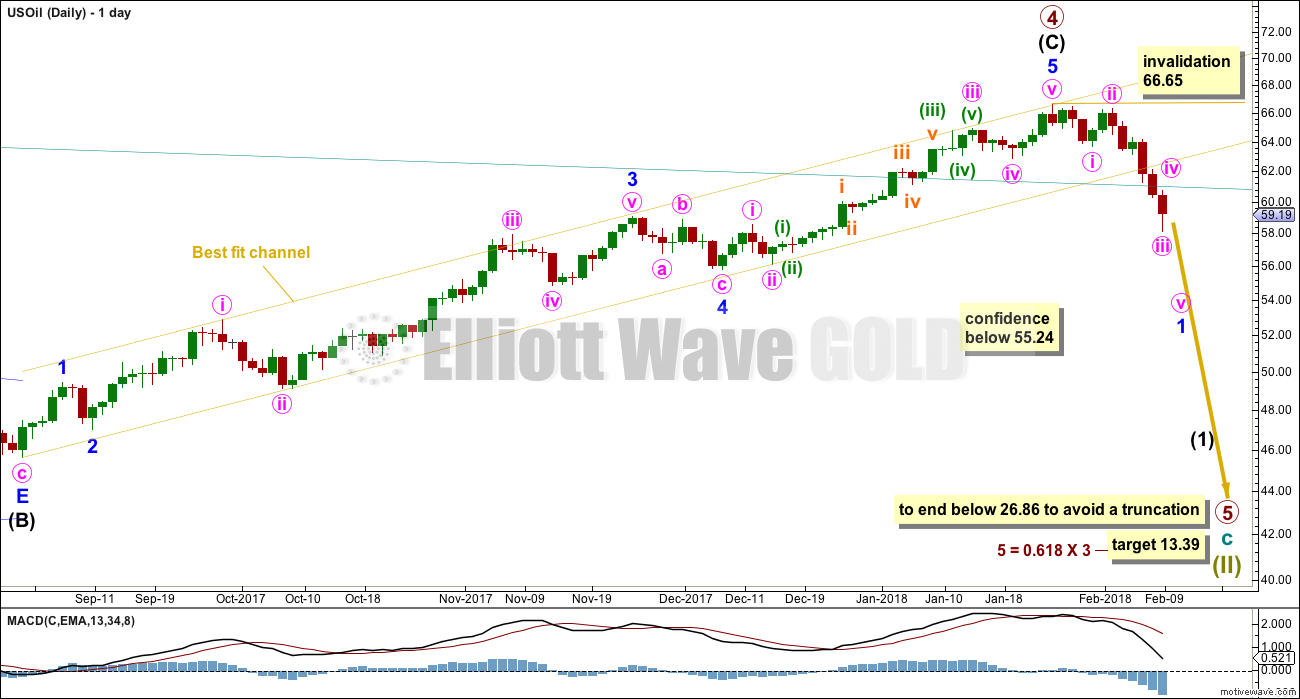
Intermediate wave (C) may now be complete at all degrees. A breach of the yellow best fit channel on Thursday adds confidence to this view.
A five down labelled minor wave 1 may be incomplete within the new downwards trend. When minor wave 1 is complete, then minor wave 2 may not move beyond the start of minor wave 1 above 66.65.
So far, within minor wave 1, minute waves i through to iii may be complete. If this labelling of short term movement is correct, then an upcoming bounce for minute wave iv may not move into minute wave i price territory above 63.67.
Look for any bounce to find resistance about the lower edge now that the yellow channel has been breached.
ALTERNATE WAVE COUNT
MONTHLY CHART
Click chart to enlarge.
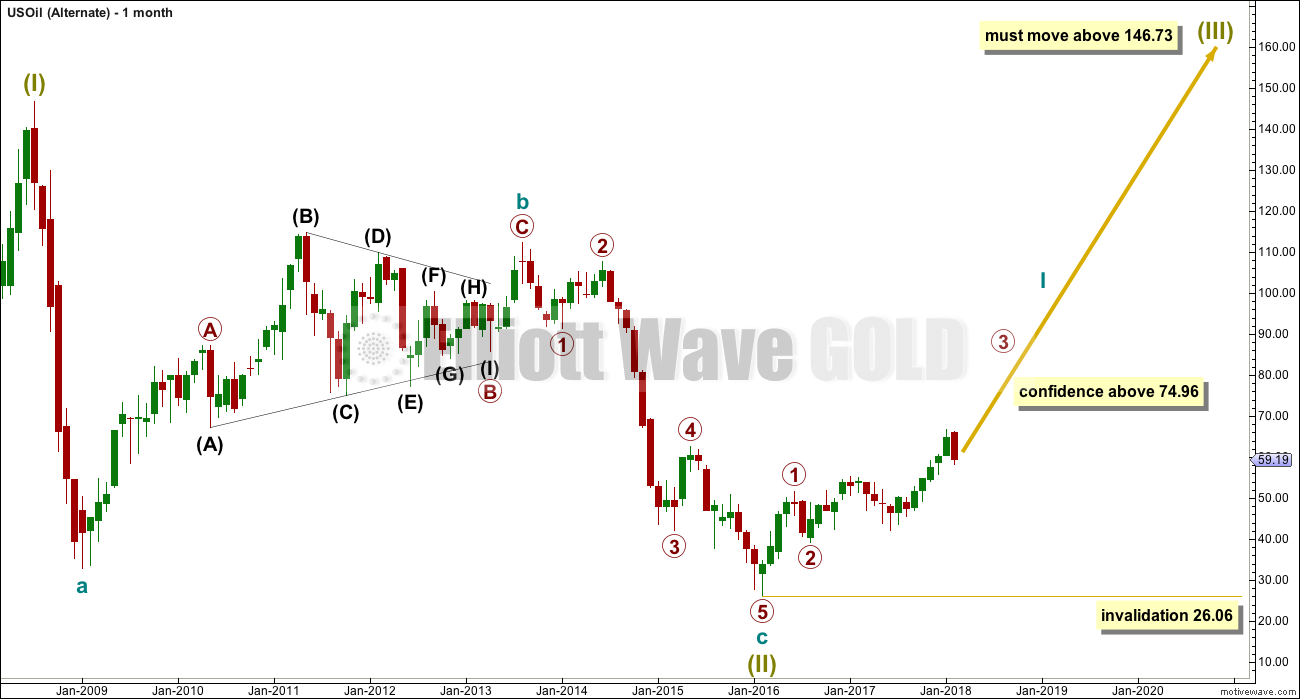
It is possible that the bear market for Oil is over and a new bull market is in the very early stages.
A huge zigzag down to the last low may be complete and is labelled here Super Cycle wave (II).
Cycle wave b must be seen as complete in August 2013 for this wave count to work. It cannot be seen as complete at the prior major swing high in May 2011.
Cycle wave b is seen as a zigzag, and within it primary wave B is seen as a running contracting triangle. These are fairly common structures, although nine wave triangles are uncommon. All subdivisions fit.
Primary wave C moves beyond the end of primary wave A, so it avoids a truncation. But it does not have to move above the price territory of primary wave B to avoid a truncation, which is an important distinction.
If cycle wave b begins there, then cycle wave c may be seen as a complete five wave impulse.
Super Cycle wave (III) must move beyond the end of Super Cycle wave (I). It must move far enough above that point to allow room for a subsequent Super Cycle wave (IV) to unfold and remain above Super Cycle wave (I) price territory.
WEEKLY CHART
Click chart to enlarge.
If a new bull market is in the very early stages for Oil, then it may have begun with two overlapping first and second waves at primary then at intermediate degree.
Primary wave 3 may only subdivide as an impulse, and within it intermediate wave (3) may be complete.
Intermediate wave (4) may not move into intermediate wave (1) price territory below 55.24.
TECHNICAL ANALYSIS
MONTHLY CHART
Click chart to enlarge. Chart courtesy of StockCharts.com.
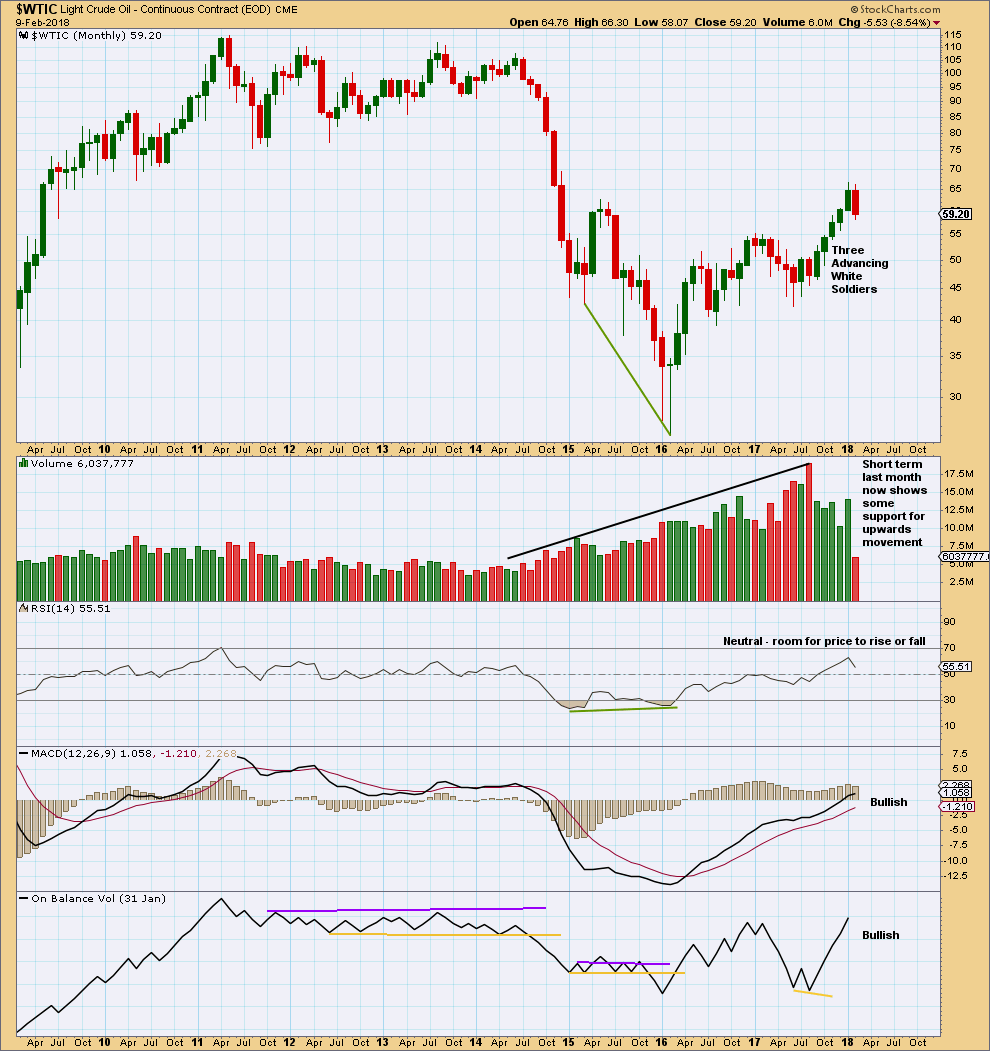
The strongest recent monthly volume is for the downwards month of August 2017. This is bearish.
For the now completed month of January the rise in price had support from volume. This is bullish. MACD and On Balance Volume are also both bullish. Overall, this chart is more bullish than bearish.
RSI indicates there is room for upwards movement to continue.
The month of February is incomplete and so no conclusions may yet be drawn about it.
DAILY CHART
Click chart to enlarge. Chart courtesy of StockCharts.com.
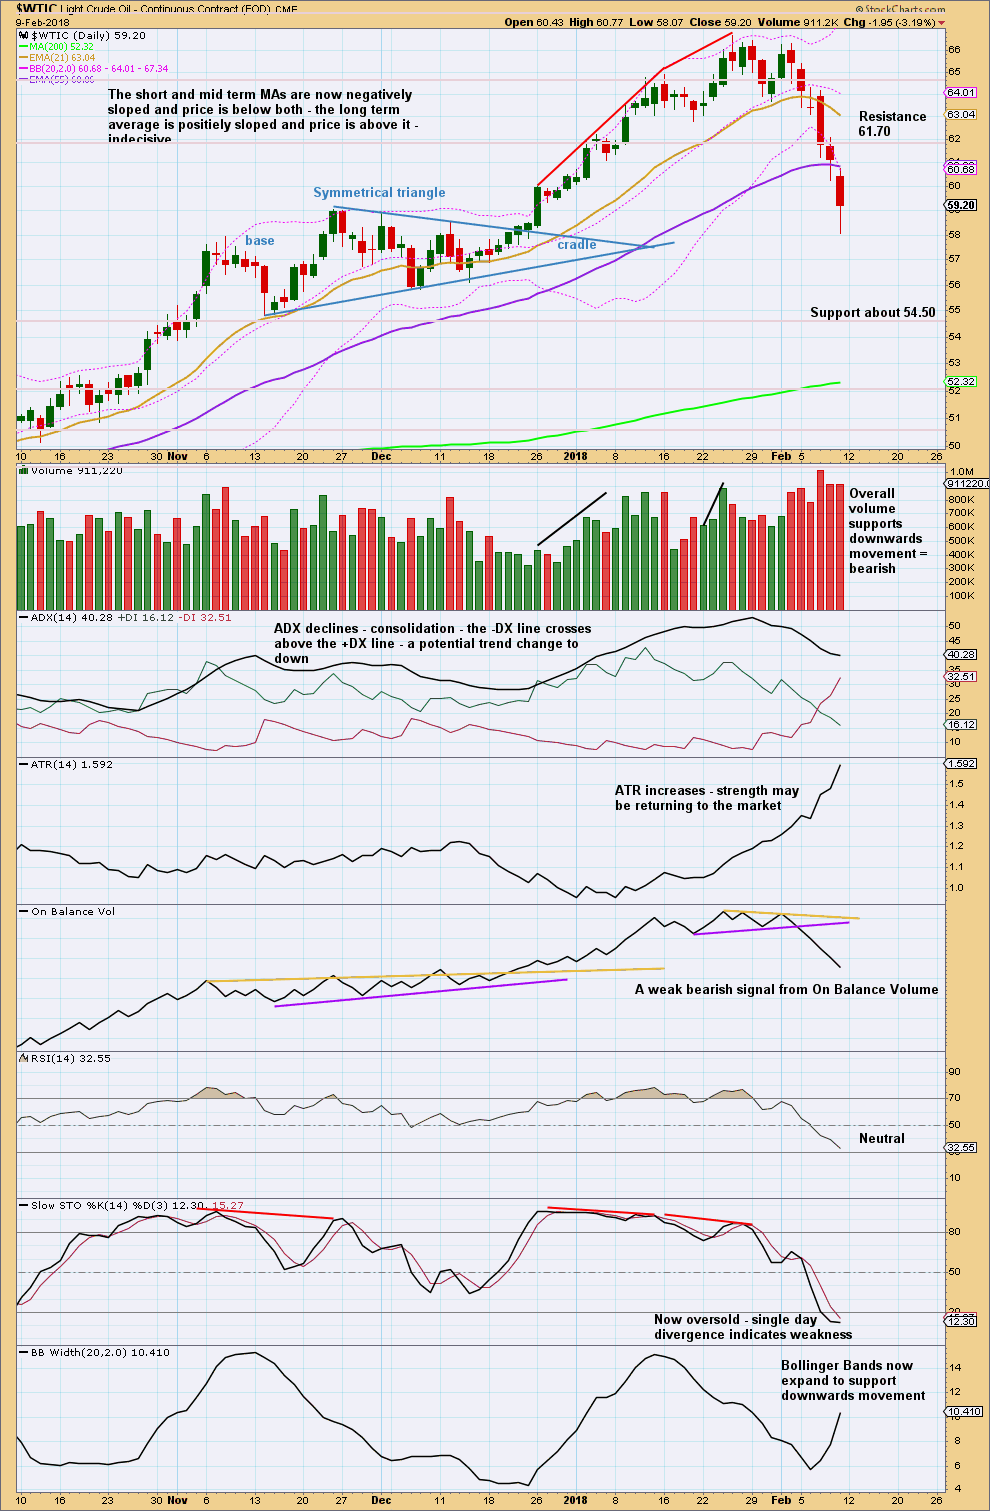
Give the bearish signal from On Balance Volume reasonable weight. It supports the main Elliott wave count.
In the short term, long lower wicks on the last two daily candlesticks signal a possible bounce here or very soon. This view is reinforced with Stochastics oversold and exhibiting single bullish divergence.
VOLATILITY INDEX
Click chart to enlarge. Chart courtesy of StockCharts.com.
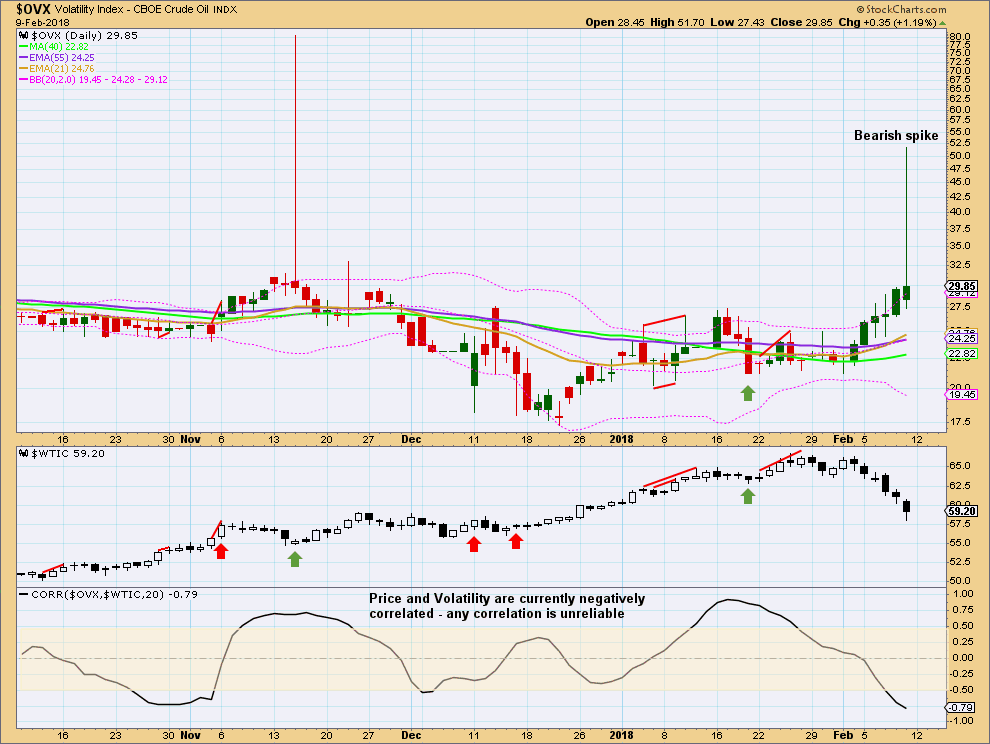
A sharp increase in volatility and quick reversal creates a very long upper wick. This is bearish for volatility, which may be bullish for Oil price at least for the short term. This supports the view that Oil price may see a bounce early next week.
GOLD ANALYSIS
Last analysis expected support to hold, and it has.
Summary: Price is at support. For the short term, a new high above 1,327.81 and then above the yellow best fit channel would indicate an end to the downwards swing and the start of a new upwards swing.
The target is at 1,286 if the downwards swing continues.
The mid term picture still expects that Gold is within a B wave correction which may continue for several weeks.
Only a new low below 1,236.54 would signal a strong bear market for Gold.
Grand SuperCycle analysis is here.
Last in-depth historic analysis with monthly and several weekly charts is here, video is here.
There are multiple wave counts at this time at the weekly and monthly chart levels. In order to make this analysis manageable and accessible only two will be published on a daily basis, one bullish and one bearish. This does not mean the other possibilities may not be correct, only that publication of them all each day is too much to digest. At this stage, they do not diverge from the two possibilities below.
BULLISH ELLIOTT WAVE COUNT
FIRST WEEKLY CHART
Click chart to enlarge.
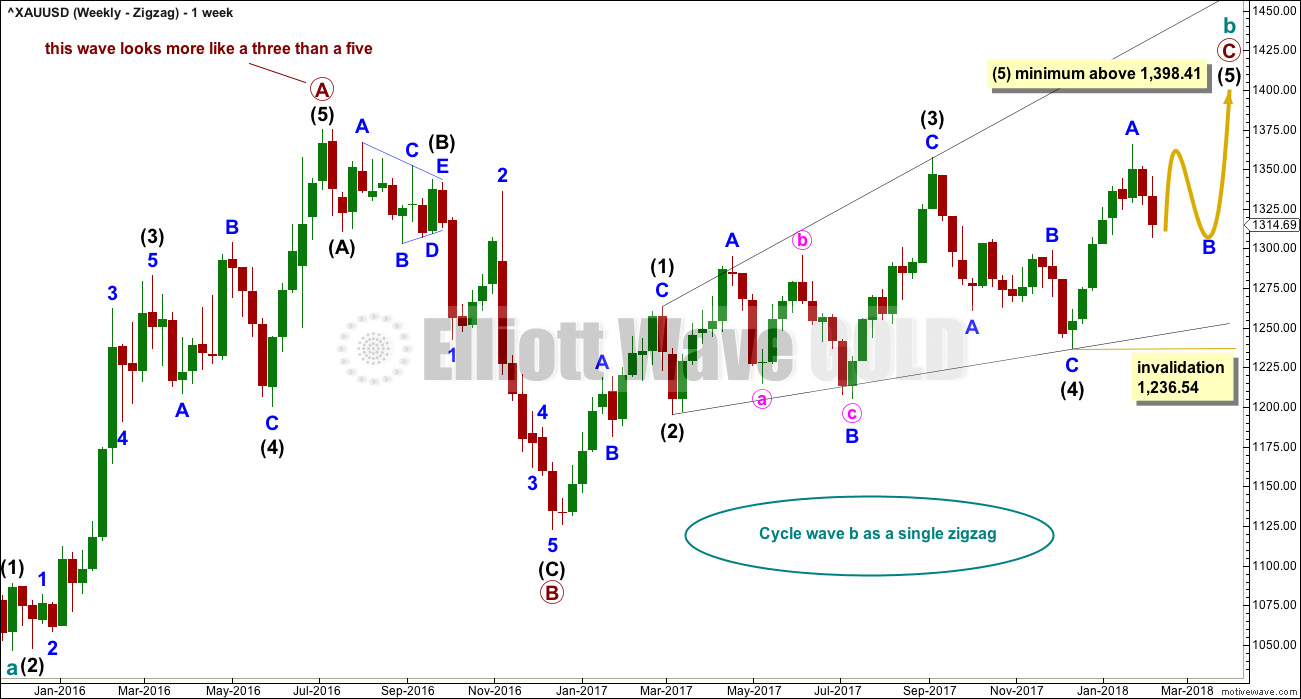
Cycle wave b may be a single zigzag. Zigzags subdivide 5-3-5. Primary wave C must subdivide as a five wave structure and may be either an impulse or an ending diagonal. Overlapping at this stage indicates an ending diagonal.
Within an ending diagonal, all sub-waves must subdivide as zigzags. Intermediate wave (4) must overlap into intermediate wave (1) price territory. This diagonal is expanding: intermediate wave (3) is longer than intermediate wave (1) and intermediate wave (4) is longer than intermediate wave (2). Intermediate wave (5) must be longer than intermediate wave (3), so it must end above 1,398.41 where it would reach equality in length with intermediate wave (3).
Within the final zigzag of intermediate wave (5), minor wave B may not move beyond the start of minor wave A below 1,236.54.
Within intermediate wave (1), the correction labelled minor wave B was over within one week. Within intermediate wave (2), the correction labelled minor wave B was too quick to be seen on the weekly chart. Within intermediate wave (3), the correction labelled minor wave B was over in 12 weeks, one short of a Fibonacci 13. Within intermediate wave (4), the correction labelled minor wave B was over in a Fibonacci 8 weeks. As each actionary wave is extending in time as well as price, the correction of minor wave B within intermediate wave (5) may be longer than that within intermediate wave (3). At this early stage, a Fibonacci 13 or possibly even 21 weeks may be expected. This expectation is a rough guideline; flexibility is essential when B waves unfold.
This first weekly chart sees the upwards wave labelled primary wave A as a five wave structure. It must be acknowledged that this upwards wave looks better as a three than it does as a five. The fifth weekly chart below will consider the possibility that it was a three.
FIRST DAILY CHART
Click chart to enlarge.
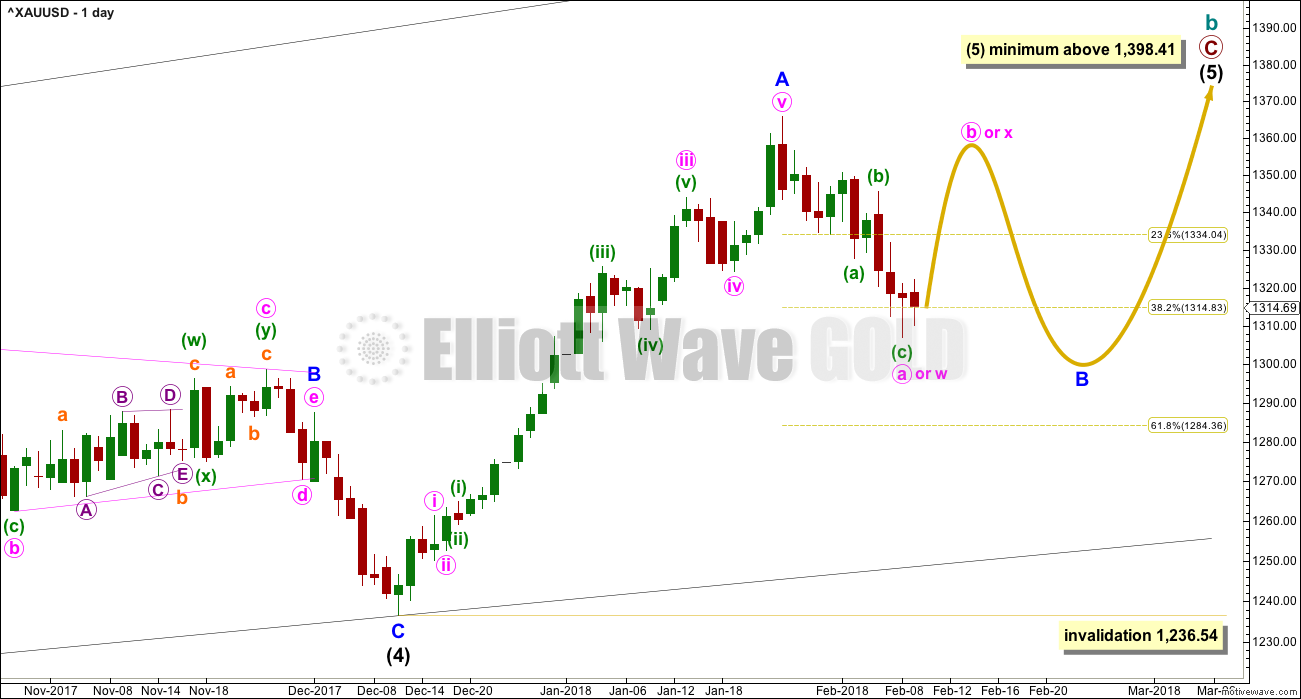
Within the ending diagonal, intermediate wave (5) must sub-divide as a zigzag.
Minor wave B may be a reasonably time consuming consolidation or a quicker sharper pullback within the upwards trend, and it may end about either of the 0.382 or 0.618 Fibonacci ratios (neither may be favoured).
There are more than 23 possible structures that minor wave B may take, and it is impossible until close to or at the end to have confidence which structure has unfolded. When B waves unfold, it is essential that analysis is flexible. B waves are analogous to either range bound consolidations or sharp corrections. As minor wave B unfolds, the labelling on the hourly chart for its sub-waves will change and alternates will be required from time to time.
The yellow arrow outlines the possible pathway for a flat or combination. These corrections are analogous to sideways range bound consolidations. Within both a flat and consolidation, minute wave b or x may make a new high above the start of minute wave a or w at 1,365.68.
Minor wave B may still be a triangle or zigzag. All possibilities must still be considered.
Minor wave B may not move beyond the start of minor wave A below 1,236.54.
BEARISH ELLIOTT WAVE COUNT
FIFTH WEEKLY CHART
Click chart to enlarge.
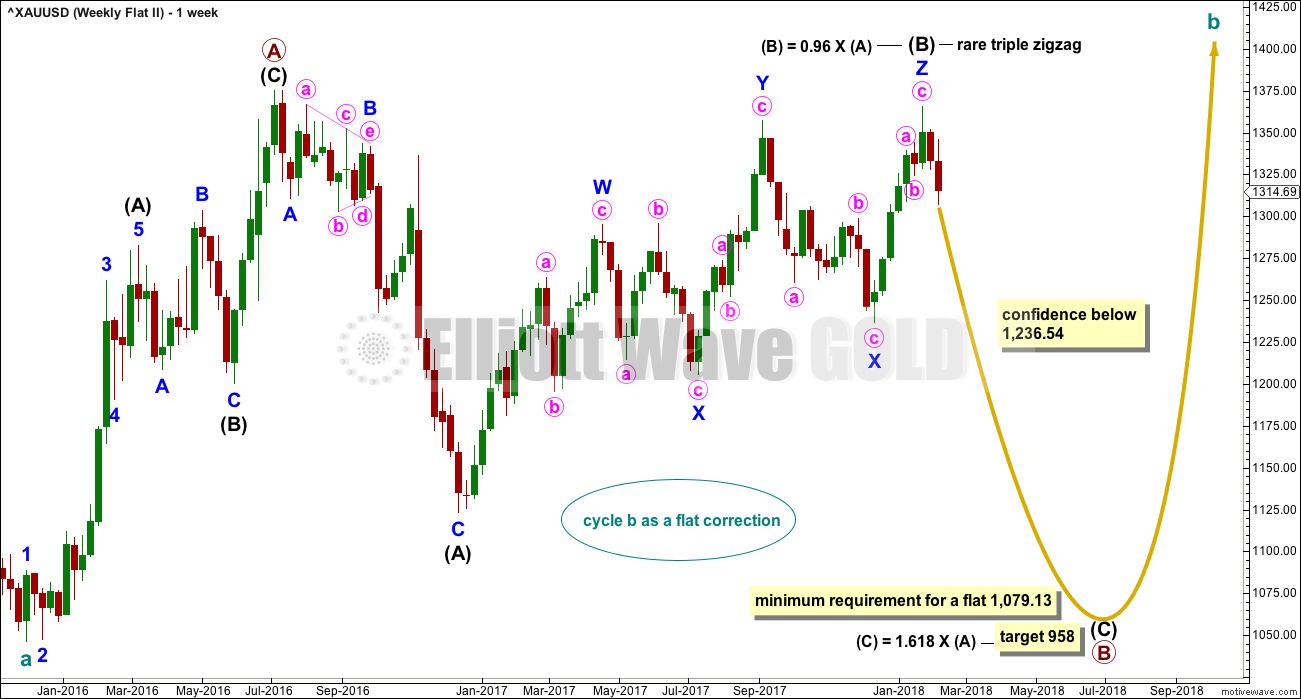
There were five weekly charts published in the last historic analysis. This fifth weekly chart is the most immediately bearish wave count, so this is published as a bearish possibility.
This fifth weekly chart sees cycle wave b as a flat correction, and within it intermediate wave (B) may be a complete triple zigzag. This would indicate a regular flat as intermediate wave (B) is less than 1.05 the length of intermediate wave (A).
If cycle wave b is a flat correction, then within it primary wave B must retrace a minimum 0.9 length of primary wave A at 1,079.13 or below. The most common length of B waves within flats is from 1 to 1.38 times the length of the A wave. The target calculated would see primary wave B end within this range.
I have only seen two triple zigzags before during my 10 years of daily Elliott wave analysis. If this wave count turns out to be correct, this would be the third. The rarity of this structure is identified on the chart.
TECHNICAL ANALYSIS
WEEKLY CHART
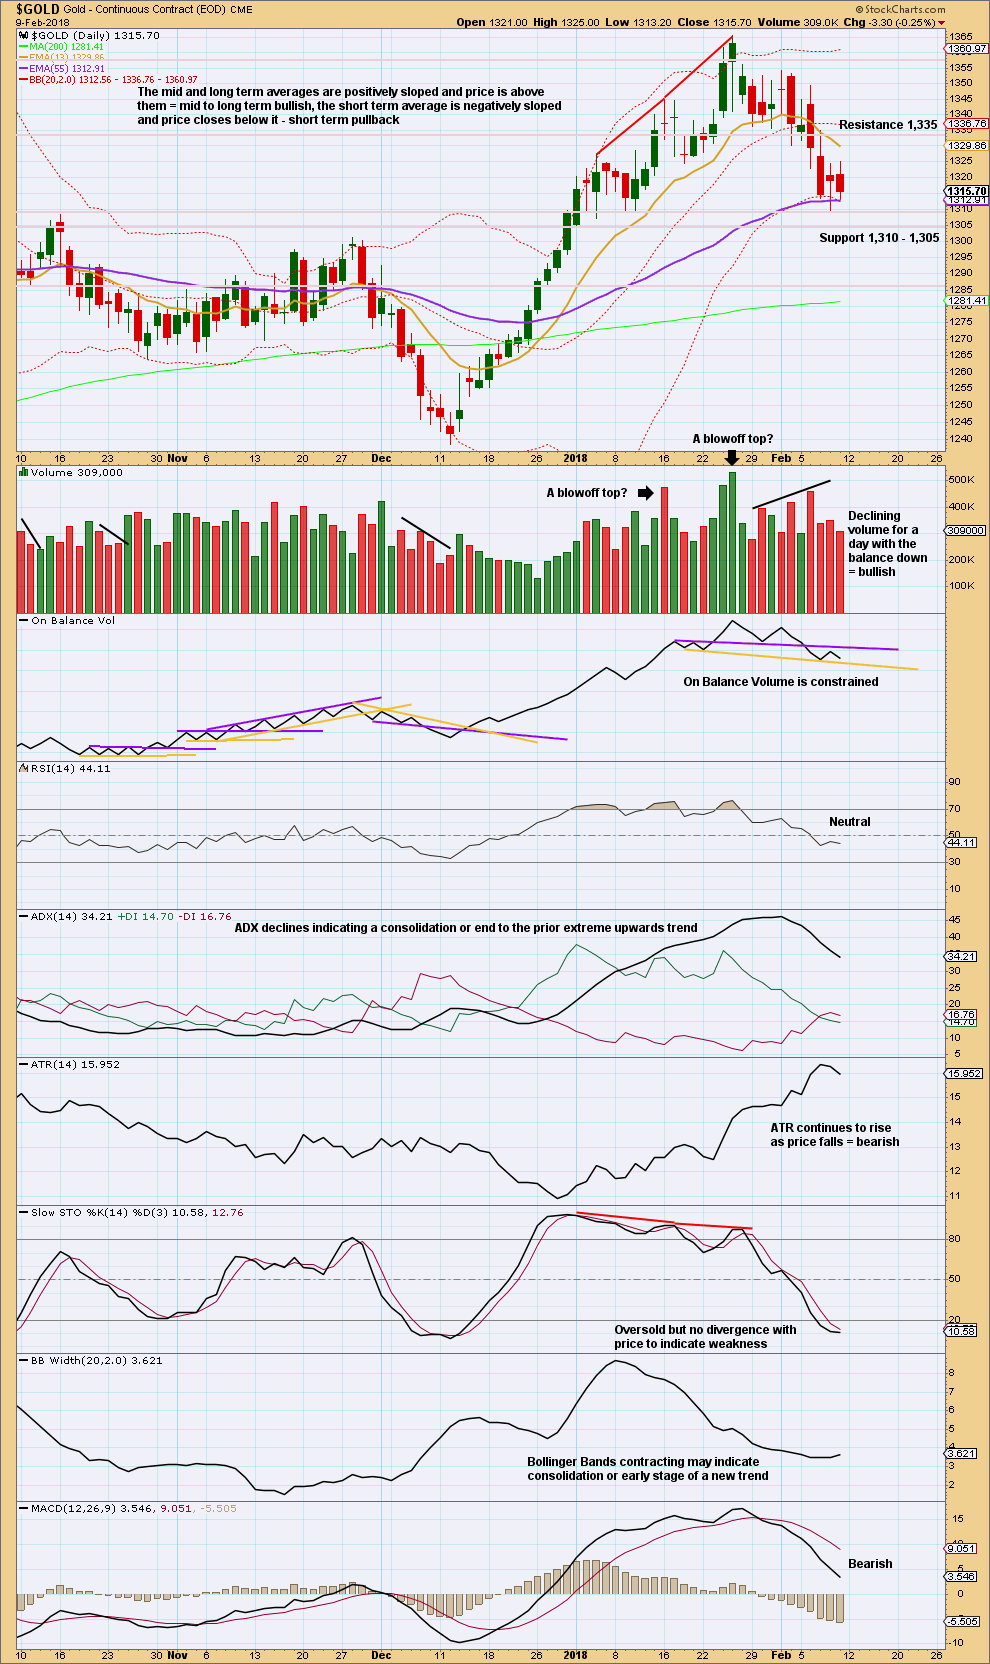
Click chart to enlarge. Chart courtesy of StockCharts.com.
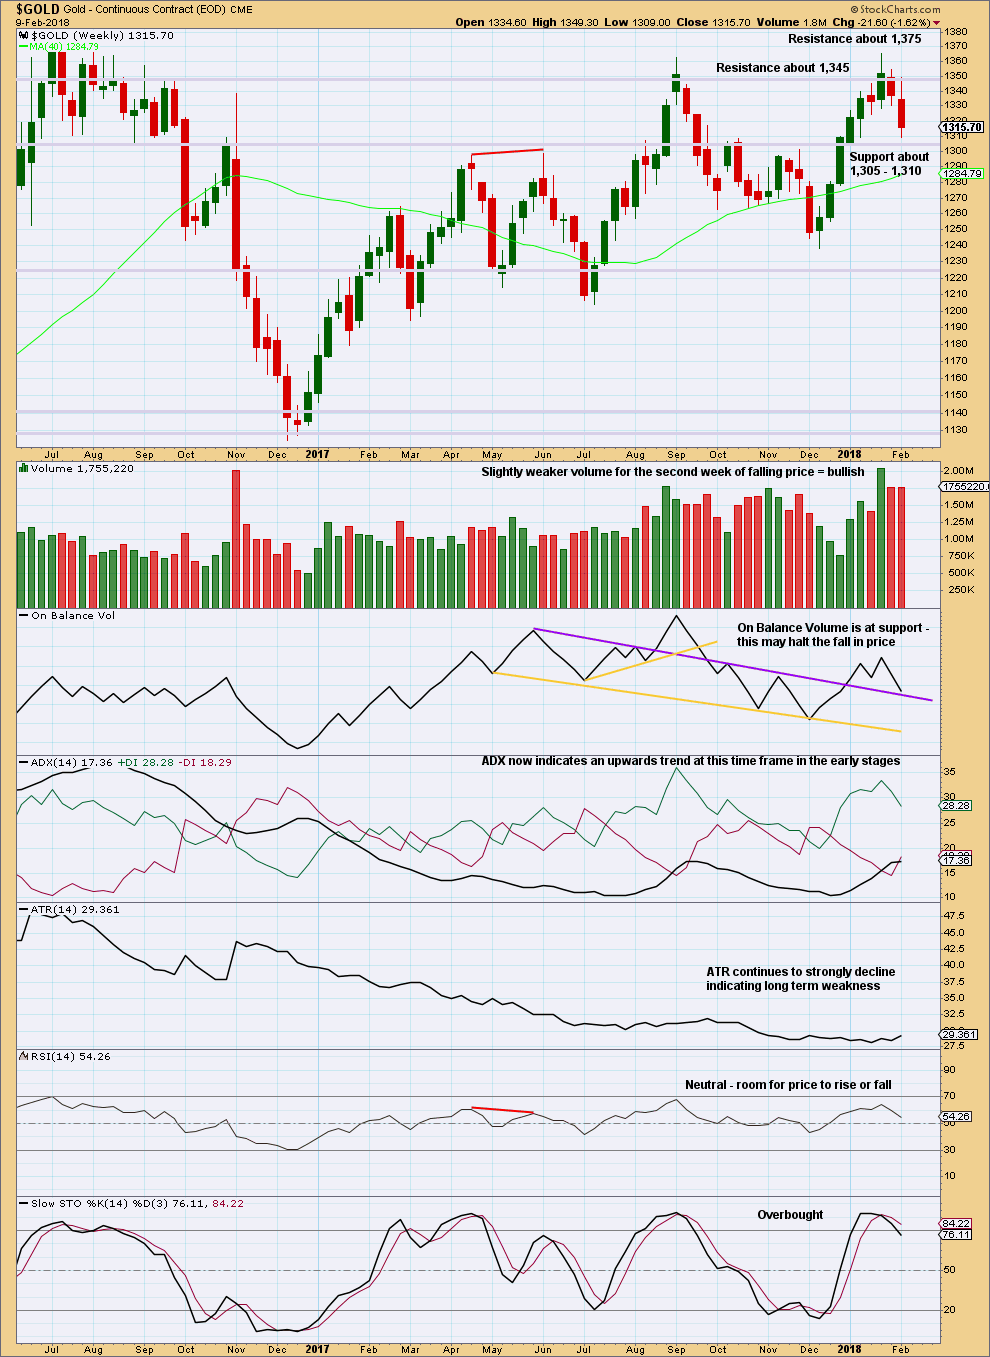
Support for price about 1,310 – 1,305 and support for On Balance Volume may halt the fall in price here.
However, RSI and Stochastics indicate there is plenty of room for price to fall further. If support about 1,310 – 1,305 gives way, then next support is about 1,225.
A breakout above 1,375 on a day with strong volume would have to occur for the bullish case to have strong confidence.
DAILY CHART
Click chart to enlarge. Chart courtesy of StockCharts.com.
Price is at support and On Balance Volume is close to support. With Stochastics oversold and price at support, it is reasonable still to expect an end to the downwards swing about here.
S&P500 ANALYSIS
More downwards movement for Friday was expected.
Summary: A low may now be in place. Some confidence may be had in this view if price breaks above the yellow channel on the hourly chart. A target would then be at 3,020.
Always practice good risk management. Always trade with stops and invest only 1-5% of equity on any one trade.
The biggest picture, Grand Super Cycle analysis, is here.
Last historic analysis with monthly charts is here. Video is here.
An historic example of a cycle degree fifth wave is given at the end of the analysis here.
MAIN ELLIOTT WAVE COUNT
MONTHLY CHART
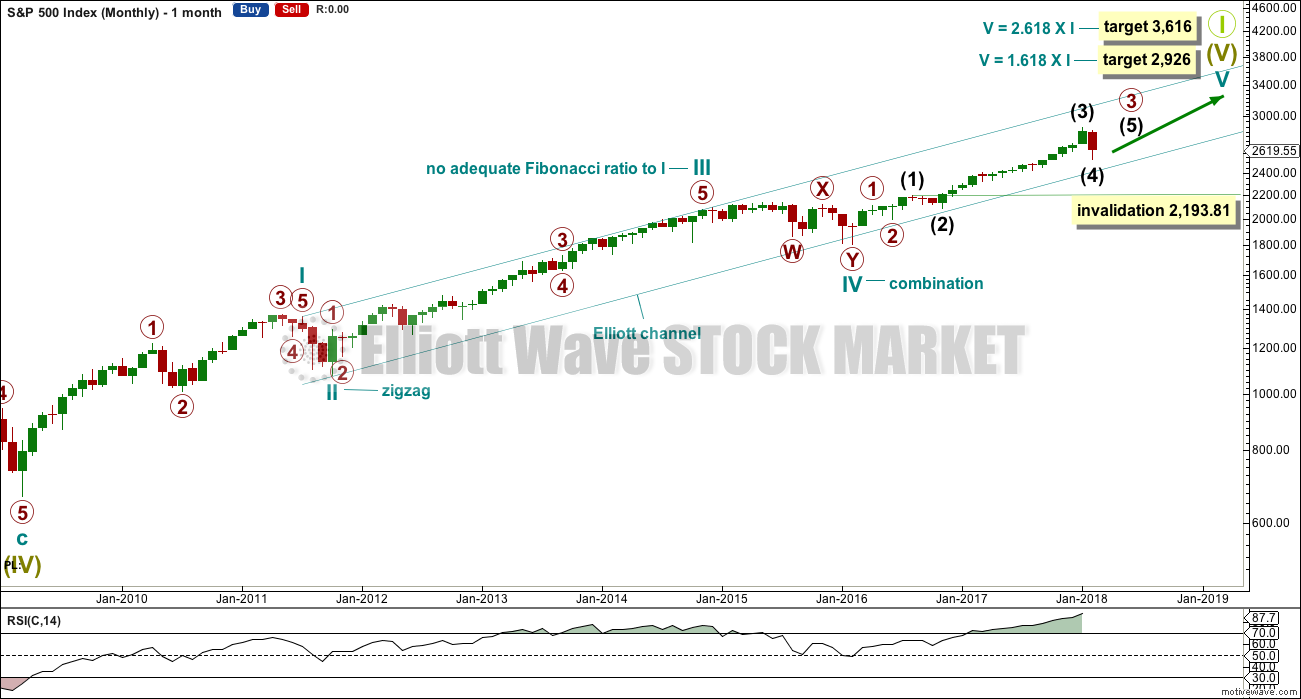
Click chart to enlarge.
The large expanded flat labelled Super Cycle wave (IV) completed a 8.5 year correction. Thereafter, the bull market continues for Super Cycle wave (V). The structure of Super Cycle wave (V) is incomplete. At this stage, it is subdividing as an impulse.
There is no Fibonacci ratio between cycle waves I and III within Super Cycle wave (V). This makes it more likely that cycle wave V will exhibit a Fibonacci ratio to either of cycle waves I or III. Cycle wave V has passed equality in length with cycle wave I. The next two Fibonacci ratios in the sequence are used for two possible targets for it to end.
The teal channel is drawn using Elliott’s first technique about an impulse. Draw the first trend line from the ends of cycle waves I to III (from the months of July 2011 to December 2014), then place a parallel copy on the low of cycle wave II. Cycle wave IV has found support very close to the lower edge of this channel, so the channel looks about right. The lower edge should continue to provide support, and the upper edge may provide resistance if price gets up that high.
Copy this large channel over to weekly and daily charts, all on a semi log scale. The lower edge will be important.
Cycle wave II was a shallow 0.41 zigzag lasting three months. Cycle wave IV is now seen as a more shallow 0.28 double combination lasting 14 months. With cycle wave IV nearly five times the duration of cycle wave II, it should be over there.
Cycle wave I lasted 28 months (not a Fibonacci number), cycle wave II lasted a Fibonacci 3 months, cycle wave III lasted 38 months (not a Fibonacci number), and cycle wave IV lasted 14 months (one more than a Fibonacci 13).
Cycle wave V has begun its 24th month. The structure needs several more months to complete. It may last another 10 months to total a Fibonacci 34, which now looks reasonable.
It is also possible that cycle wave V may not exhibit a Fibonacci duration.
Within cycle wave V, the correction for intermediate wave (4) may not move back down into intermediate wave (1) price territory below 2,193.81.
WEEKLY CHART
Click chart to enlarge.
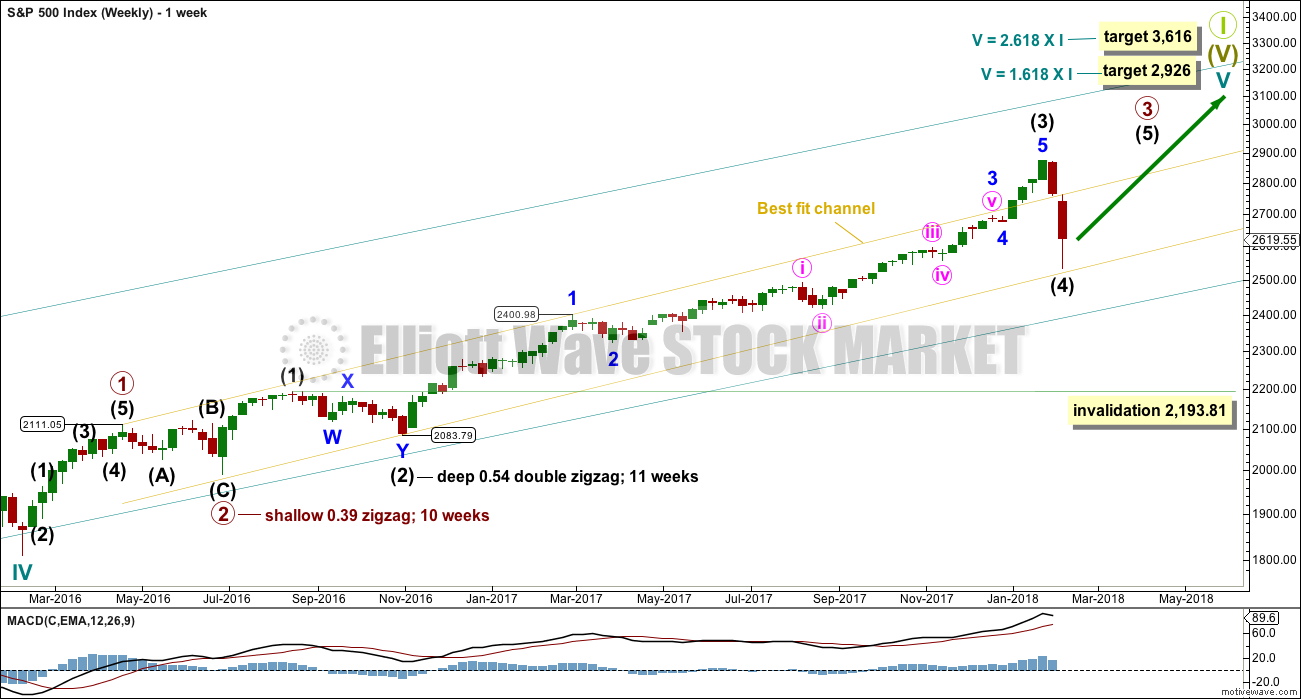
Cycle wave V must complete as a five structure, which should look clear at the weekly chart level. It may only be an impulse or ending diagonal. At this stage, it is clear it is an impulse.
Within cycle wave V, the third waves at all degrees may only subdivide as impulses.
Due to its size intermediate wave (4) looks proportional to intermediate wave (2), even though their durations so far are quite different.
Intermediate wave (4) has breached the Elliott channel drawn using Elliott’s first technique. The channel may be redrawn when it is confirmed as complete using Elliott’s second technique. A best fit channel is used while it may still be incomplete to show where it may find support. Price points are given for this channel, so that members may replicate it on a semi-log scale.
Intermediate wave (4) may not move into intermediate wave (1) price territory below 2,193.81.
DAILY CHART
Click chart to enlarge.
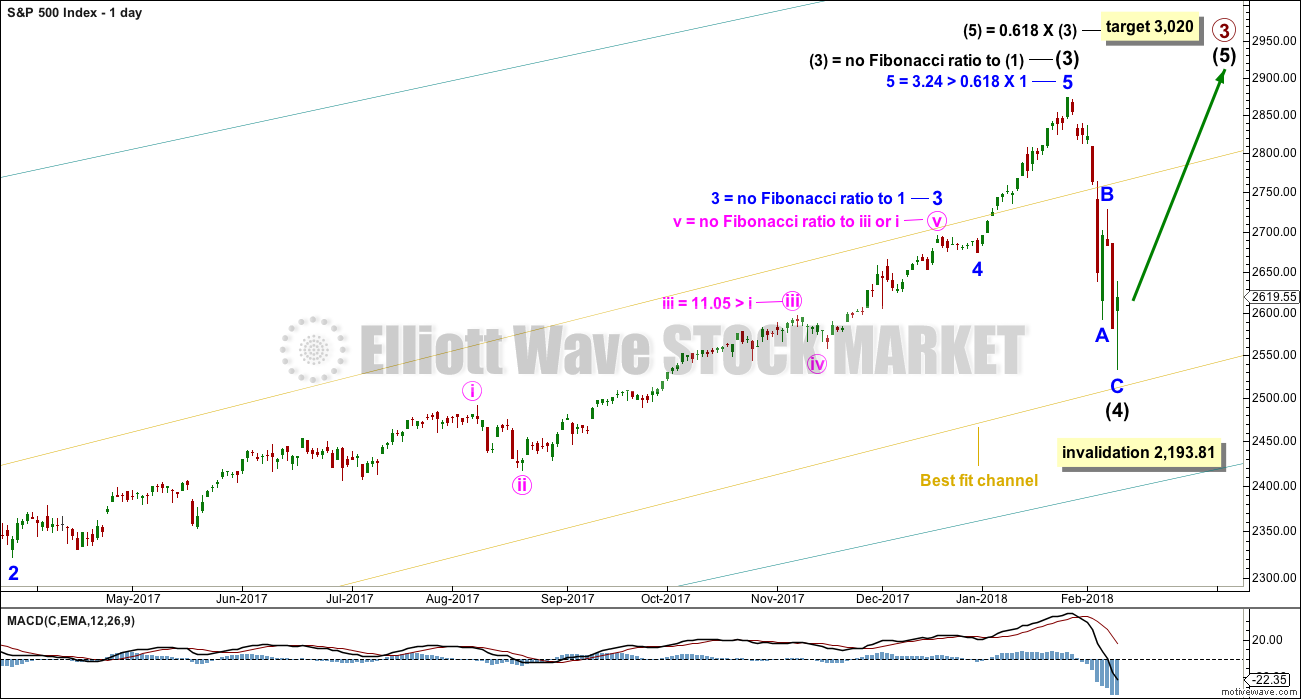
The S&P has behaved like a commodity to end intermediate wave (3): a relatively strong fifth wave with a steep slope. The high looks a little like a blow off top. This is being followed by a sharp decline, which is typical behaviour for a commodity and not common for the S&P.
There are adequate Fibonacci ratios within this wave count. It is common for the S&P to exhibit a Fibonacci ratio between two of the three actionary waves within an impulse, and uncommon for it to exhibit Fibonacci ratios between all three actionary waves. This means that the lack of Fibonacci ratios for intermediate wave (3), minor wave 3, and minute wave v is not a concern. This is normal.
Friday’s low is only a little above the lower edge of the best fit channel. The very long lower wick on Friday’s candlestick is bullish. It looks like intermediate wave (4) may now have found its low.
ALTERNATE WAVE COUNT
WEEKLY CHART
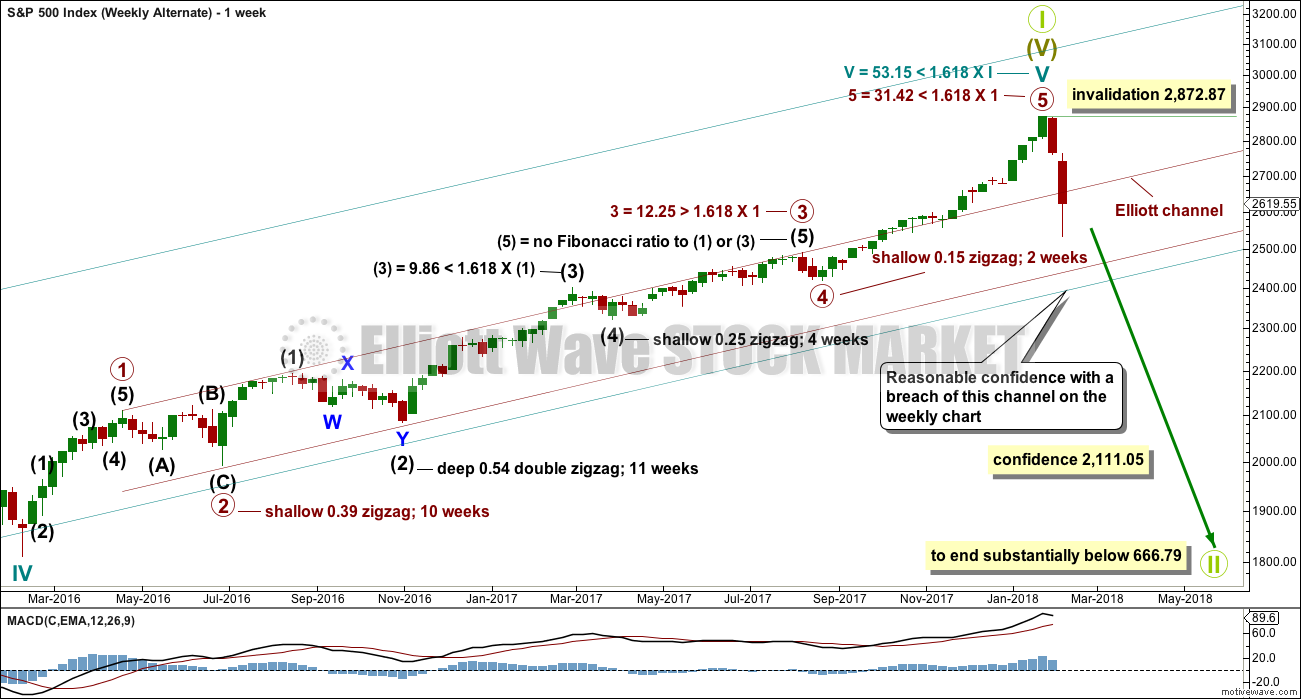
Click chart to enlarge.
This alternate wave count is published with the caveat that at this stage it must be judged to have an extremely low probability for the following reasons:
1. There is no divergence between price and the AD line at the all time high. All bear markets within the last (almost) 100 years began after a minimum of 4 months divergence with the AD line. If this wave count is correct, then this is the first time in almost 100 years when divergence did not occur.
2. There is no divergence between price and RSI on the monthly chart at the last all time high. This is again highly unusual prior to a bear market.
3. The bear market may have begun suddenly without a normal prior increase in market volatility. Normally, corrections unfold prior to the end of a bull market that increase by degree prior to the bull market ending.
However, low probability (even as low as I judge this to be) does not mean no probability. I would rather members are aware of this risk and manage this risk accordingly.
This wave count absolutely requires a clear breach of the teal channel on the weekly chart before any confidence at all may be had in it. A breach would be a full weekly candlestick (not just daily) below and not touching the lower teal trend line. This channel is copied over from the monthly chart.
Thereafter, a new low by any amount at any time frame below 2,111.05 would add substantial confidence to this wave count. At that stage, downwards movement could not be a fourth wave correction within an ongoing impulse as it would be back in first wave price territory of primary wave 1.
If this wave count is correct, then a once in multi-generations trend change may have occurred. Grand Super Cycle wave II would be expected to last at least 20 years, and possibly a generation. It would be very likely to end substantially below the end of Super Cycle wave (IV) at 666.79.
I judge the probability of this alternate wave count to have such a low probability that I was hesitant in publishing it. But I am also aware that just because this kind of end to a bull market has not been seen in almost 100 years does not mean it cannot happen.
TECHNICAL ANALYSIS
WEEKLY CHART
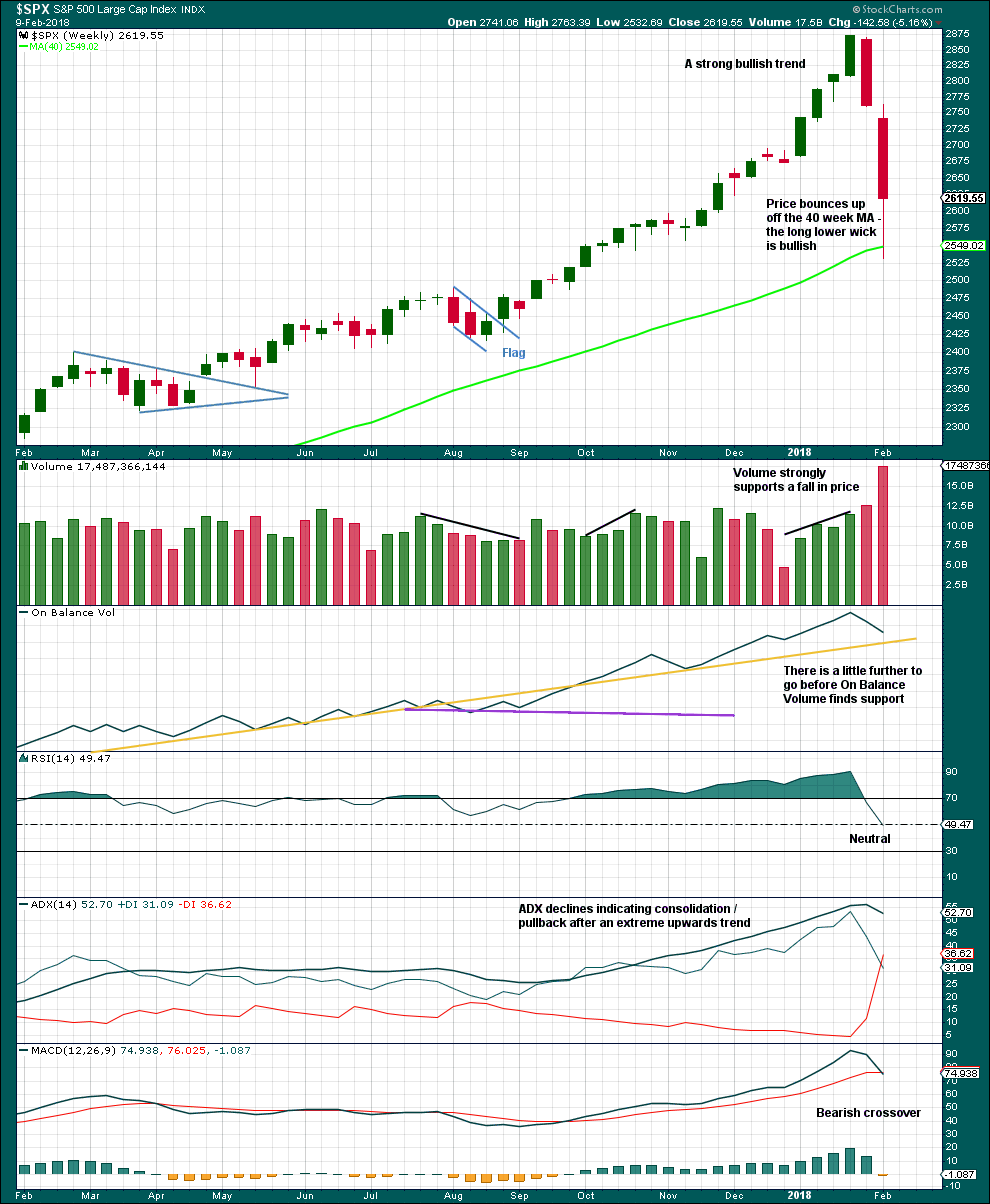
Click chart to enlarge. Chart courtesy of StockCharts.com.
This pullback has now brought RSI well back down into neutral territory. ADX is declining from very extreme. A possible trend change to down is indicated, but as yet no new downwards trend at this time frame.
In the first instance, support should be expected for On Balance Volume at the yellow trend line. A breach below this line by On Balance Volume would be a very strong bearish signal. A bounce up off the line would be a strong bullish signal.
DAILY CHART
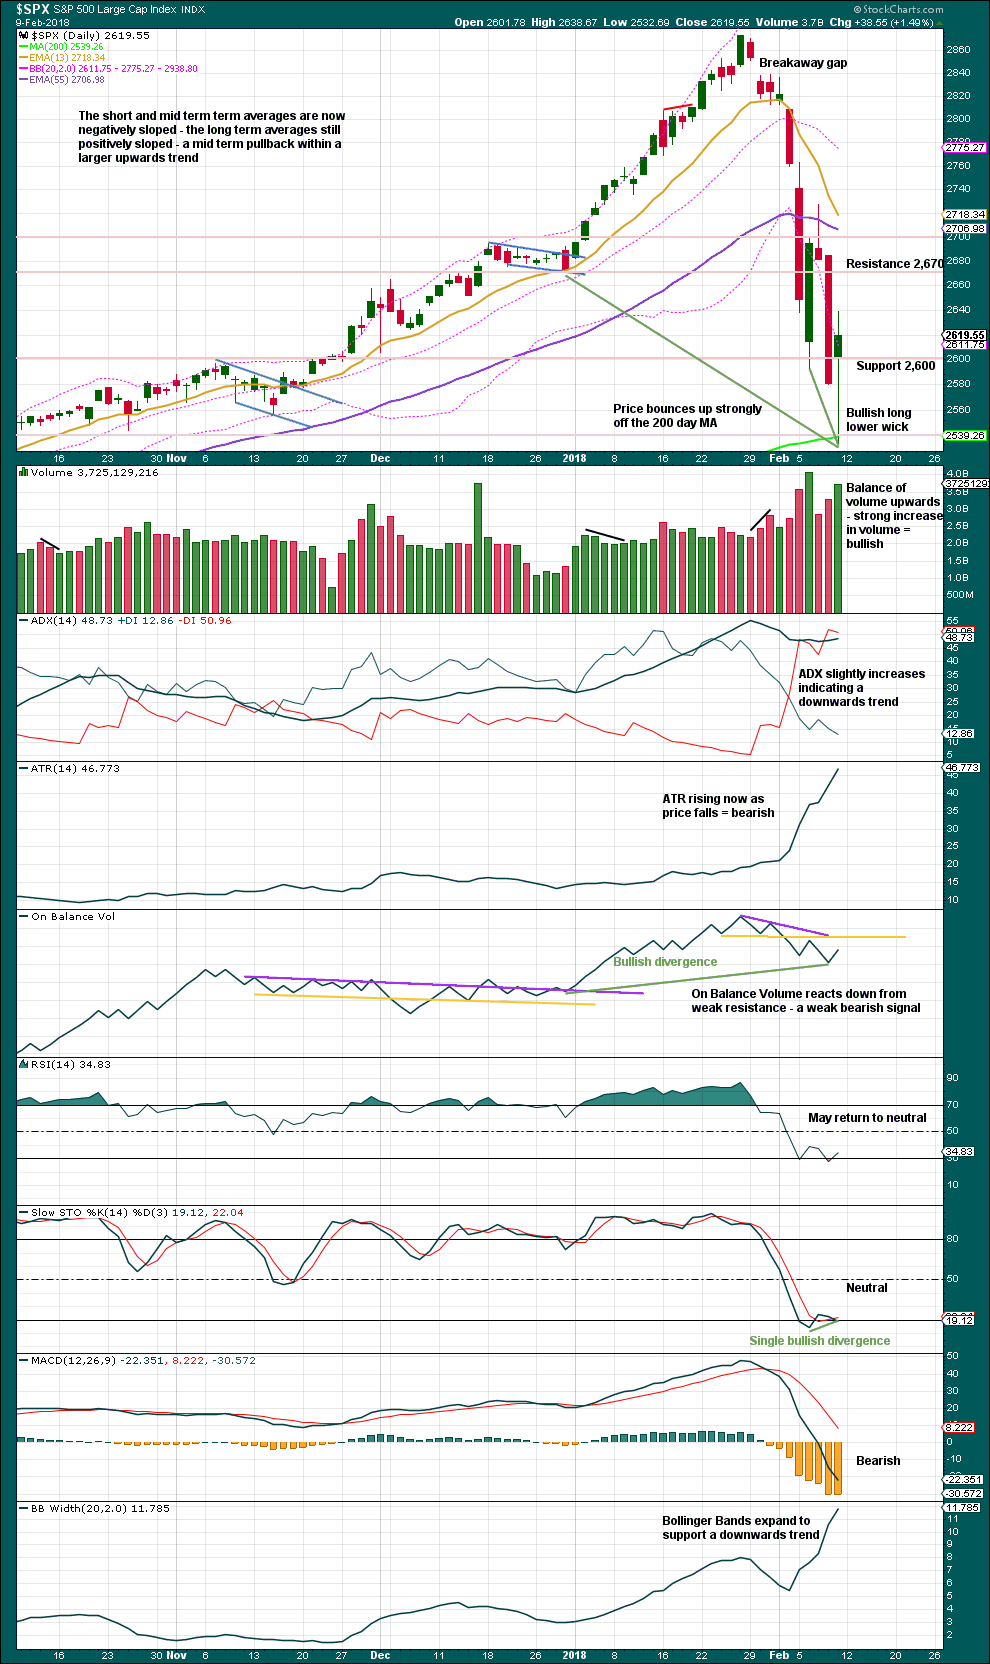
Click chart to enlarge. Chart courtesy of StockCharts.com.
Friday’s daily candlestick is not properly a hammer reversal pattern because it has too long an upper wick. However, the lower wick is very long and this is very bullish. Particularly as the low was very close to the 200 day SMA.
This pullback has brought RSI down from very overbought to just oversold. RSI can move back into oversold and remain there for a few days, or it can move back now further into neutral territory.
Overall, it looks like a low may now be in pace.
VOLATILITY – INVERTED VIX CHART
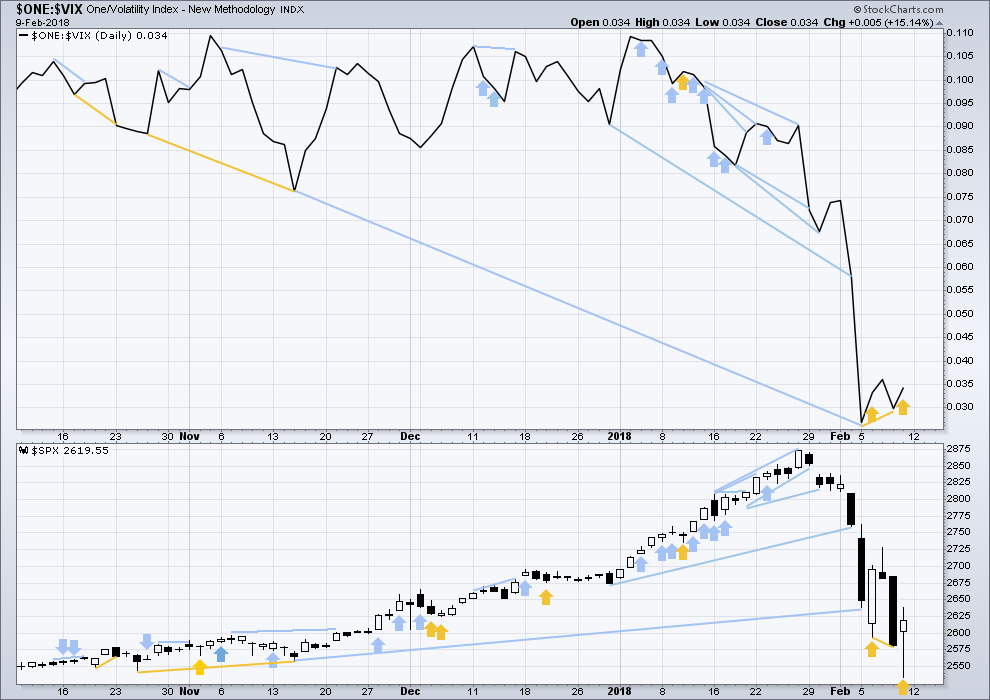
Click chart to enlarge. Chart courtesy of StockCharts.com.
So that colour blind members are included, bearish signals will be noted with blue and bullish signals with yellow.
Normally, volatility should decline as price moves higher and increase as price moves lower. This means that normally inverted VIX should move in the same direction as price.
Price moved lower with a lower low and lower high for Friday, but inverted VIX moved higher. This single day divergence is bullish.
BREADTH – AD LINE
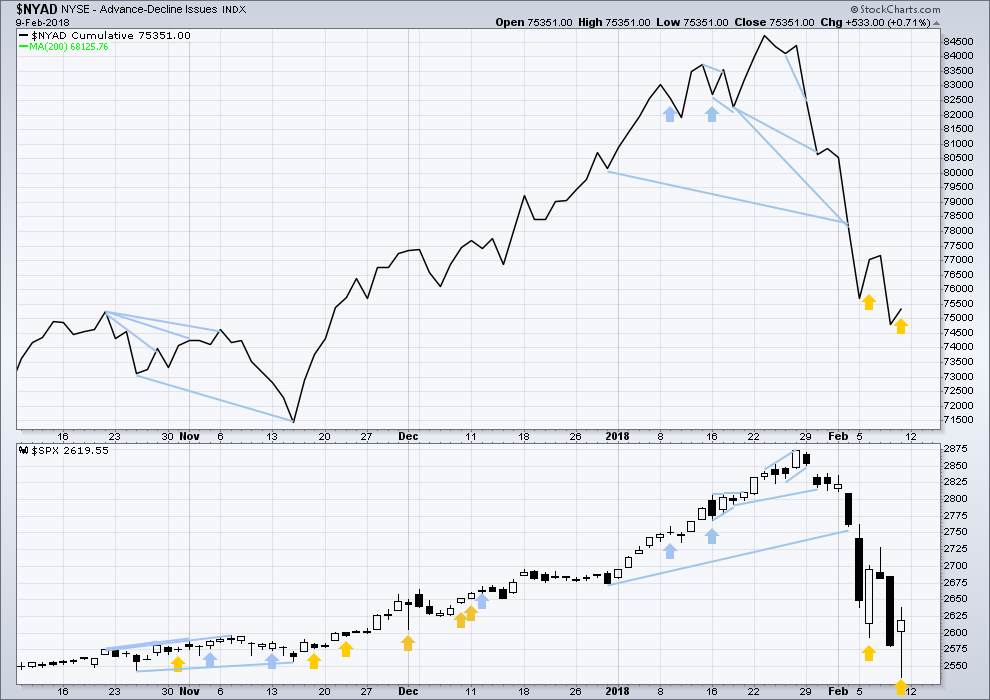
Click chart to enlarge. Chart courtesy of StockCharts.com.
There is normally 4-6 months divergence between price and market breadth prior to a full fledged bear market. This has been so for all major bear markets within the last 90 odd years. With no longer term divergence yet at this point, any decline in price should be expected to be a pullback within an ongoing bull market and not necessarily the start of a bear market.
All of small, mid and large caps this week moved lower. The decline has support from wide breadth.
Breadth should be read as a leading indicator.
Price moved lower with a lower low and lower high for Friday, but the AD line moved higher. This single day divergence is bullish.
DOW THEORY
All indices have made new all time highs as recently as three weeks ago, confirming the ongoing bull market.
The following lows need to be exceeded for Dow Theory to confirm the end of the bull market and a change to a bear market:
DJIA: 17,883.56.
DJT: 7,029.41.
S&P500: 2,083.79.
Nasdaq: 5,034.41.
Charts showing each prior major swing low used for Dow Theory are here.
Published @ 11:22 p.m. EST on 10th February, 2018.
Thanks for market analyses.
Ron Rosen has been posting his EW counts for many years for SPX, Glod and silver.
Today first time I saw your S&P count with same target as Ron.
Below is the link to his January 2017 count. I did not find his latest count but he is sticking to his count for several years.
Your alt count on S&P target is same as Ron.
Enjoy reading.
http://www.321gold.com/editorials/rosen/rosen012517.pdf
On that supposed running flat correction in Gold, I’ve seen this analysis from this person before.
And IMO it’s absolutely ridiculous.
A running flat there sees wave C of the running flat not only failing to move beyond the end of wave A, but failing to end even within the price territory of wave A.
I know that it’s not written as a rule in “Elliott Wave Principle” by Frost and Prechter that wave C needs to move back into wave A price territory, but IMO it should be.
In short, I vehemently disagree with that running flat.
With that wave count in that analysis being so ridiculous, I have no confidence in anything else in that report.