
Price has moved higher for Monday, which is exactly what was expected from last analysis.
Summary: The next target is at 3,020.
In the short term, look for a pullback tomorrow for a second wave correction. The pullback may find support now about the upper edge of the best fit channel on the hourly chart.
Always practice good risk management. Always trade with stops and invest only 1-5% of equity on any one trade.
The biggest picture, Grand Super Cycle analysis, is here.
Last historic analysis with monthly charts is here. Video is here.
An historic example of a cycle degree fifth wave is given at the end of the analysis here.
MAIN ELLIOTT WAVE COUNT
WEEKLY CHART
Click chart to enlarge.
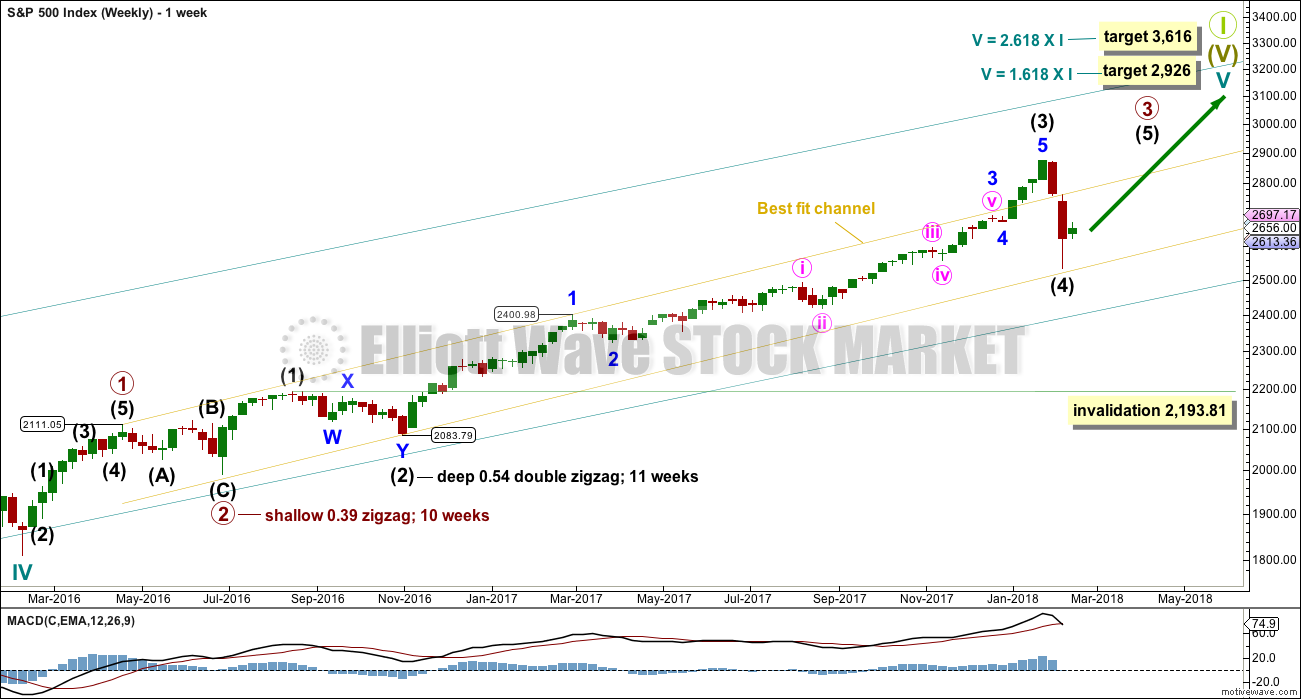
Cycle wave V must complete as a five structure, which should look clear at the weekly chart level. It may only be an impulse or ending diagonal. At this stage, it is clear it is an impulse.
Within cycle wave V, the third waves at all degrees may only subdivide as impulses.
Due to its size intermediate wave (4) looks proportional to intermediate wave (2), even though their durations so far are quite different.
Intermediate wave (4) has breached the Elliott channel drawn using Elliott’s first technique. The channel may be redrawn when it is confirmed as complete using Elliott’s second technique. A best fit channel is used while it may still be incomplete to show where it may find support. Price points are given for this channel, so that members may replicate it on a semi-log scale.
Intermediate wave (4) may not move into intermediate wave (1) price territory below 2,193.81.
DAILY CHART
Click chart to enlarge.
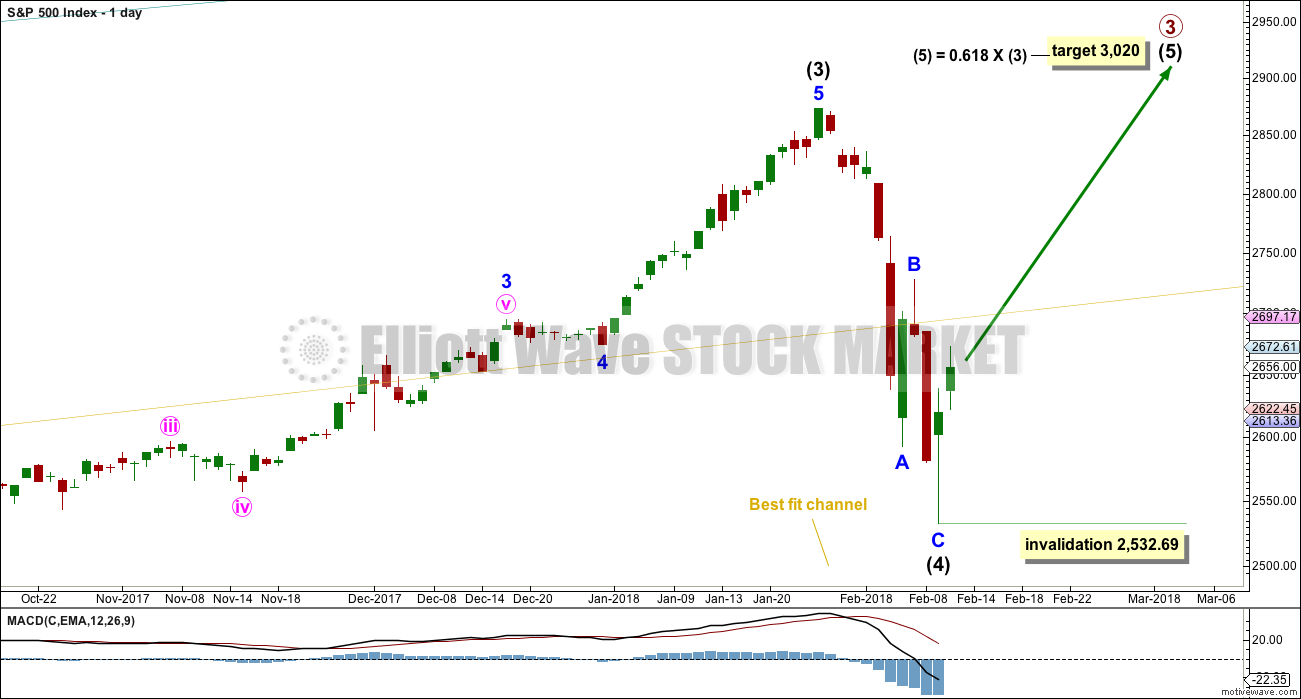
The S&P has behaved like a commodity to end intermediate wave (3): a relatively strong fifth wave with a steep slope. The high looks a little like a blow off top. This is followed by a sharp decline, which is typical behaviour for a commodity and not common for the S&P.
Friday’s low is only a little above the lower edge of the best fit channel. The very long lower wick on Friday’s candlestick is bullish. It looks like intermediate wave (4) may now have found its low.
Despite the duration of intermediate wave (4) being much quicker than intermediate wave (2), the size is proportional. On weekly and monthly time frames intermediate wave (4) now has the right look. However, it is of course still possible that intermediate wave (4) may be only just beginning as a flat, combination or triangle to move sideways. All these ideas would now expect an upwards swing which should exhibit weakness. If the next wave up is particularly weak, then a B wave within an ongoing correction will then be considered.
ALTERNATE MONTHLY WAVE COUNT
MONTHLY CHART
Click chart to enlarge.
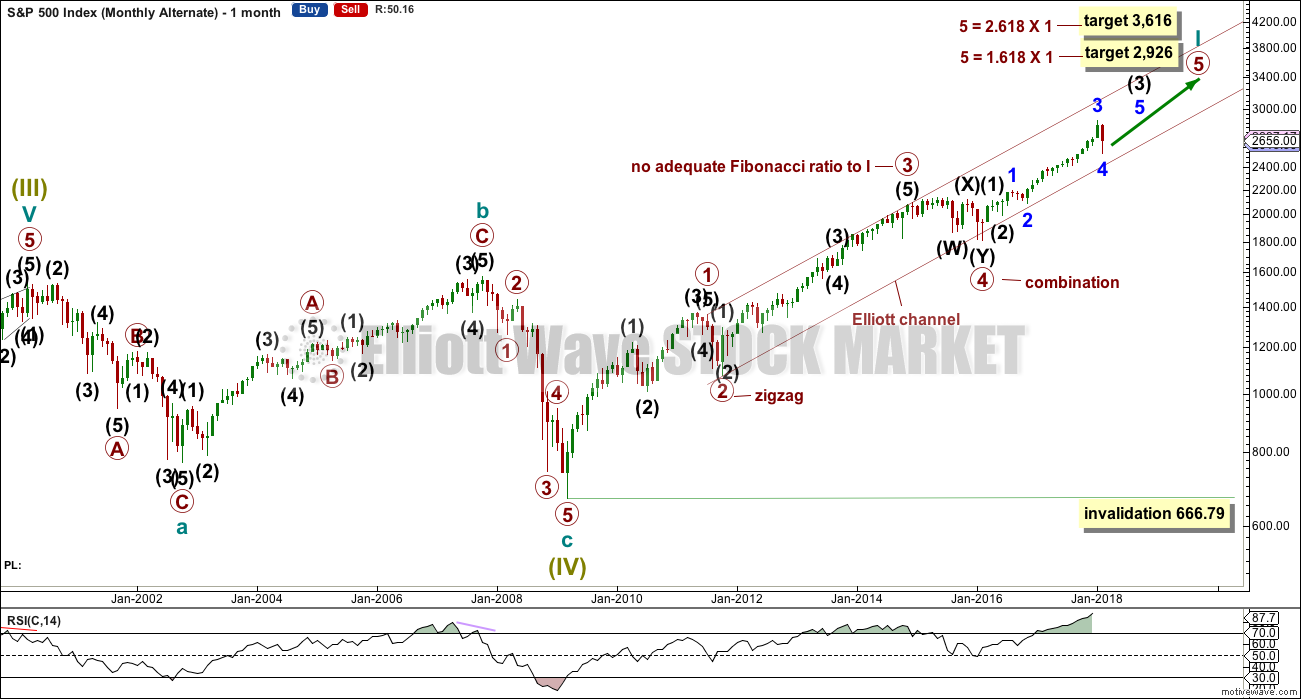
This monthly chart should be considered alongside last published historic analysis, which is linked to every day at the start of each article.
In the Grand Super Cycle analysis, Super Cycle wave (I) lasted over 60 years (my data does not go all the way to the start of Grand Super Cycle wave I); Super Cycle wave (II) lasted just 8 years (the market crash which began in 1929); Super Cycle wave III lasted 66 years, up to the high of 2000; and, Super Cycle wave (IV) ending in March 2009 lasted just 8.5 years.
Both of Super Cycle waves (I) and (III) are long extensions. This means Super Cycle wave (V) may not be a long extension because only two of the three actionary waves within Grand Super Cycle wave I may be extended.
If the degree of labelling within Super Cycle wave (V) is moved down one, it may be that only cycle wave I is nearing its end. The following correction for cycle wave II may not move beyond the start of cycle wave I below 666.79.
If only cycle wave I is nearing an end, then so far it has lasted 9 years. This does not look right for the Grand Super Cycle analysis because it would have to see a longer third wave for cycle wave III, and then Super Cycle wave (V) would look extended and the Elliott wave rule would be violated.
However, it is possible that cycle wave III could be relatively short, as could cycle wave V to end Super Cycle wave (V). And so this alternate may be considered, although it looks like it may have a low probability if the Grand Super Cycle wave count is correct.
TECHNICAL ANALYSIS
WEEKLY CHART
Click chart to enlarge. Chart courtesy of StockCharts.com.
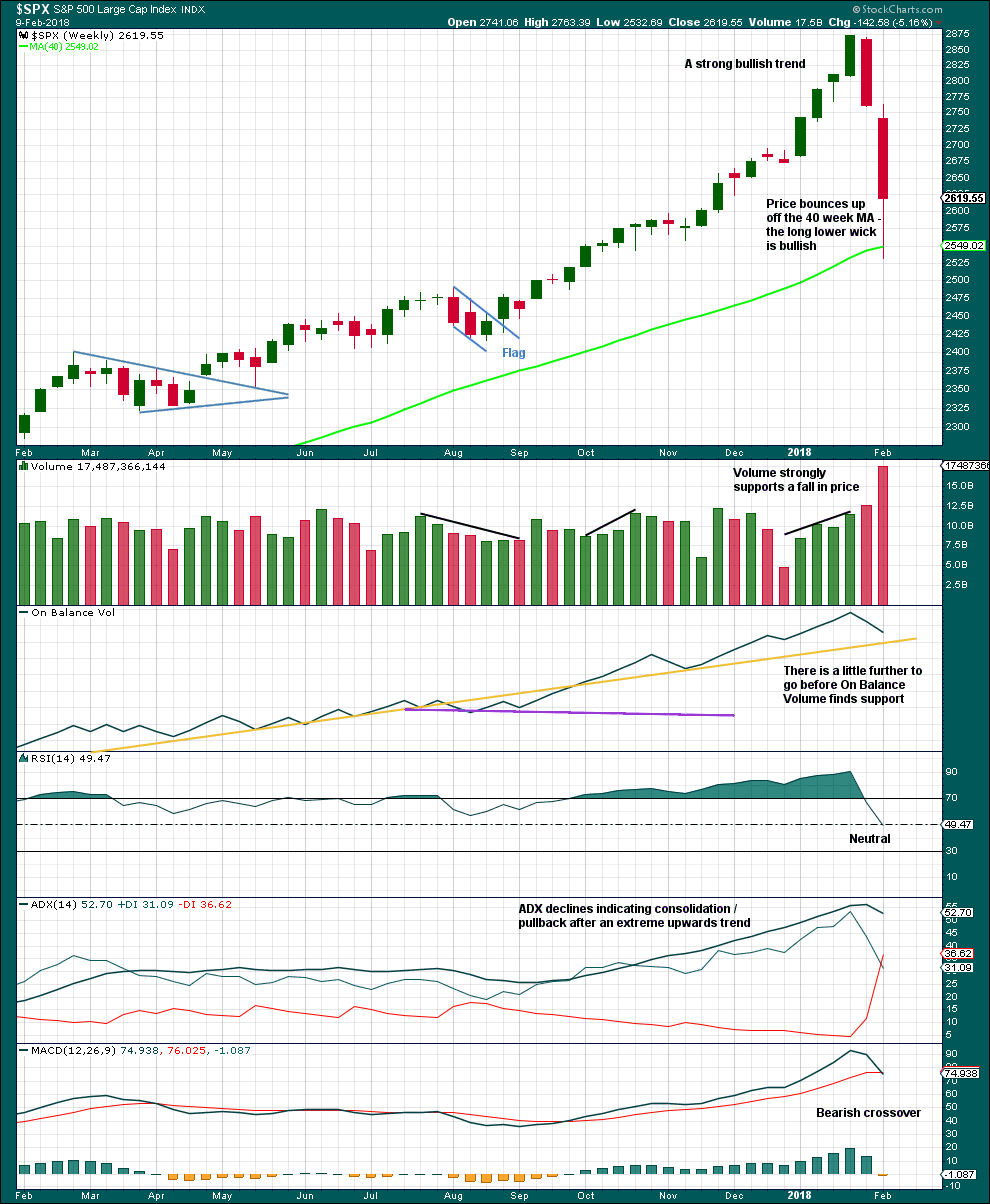
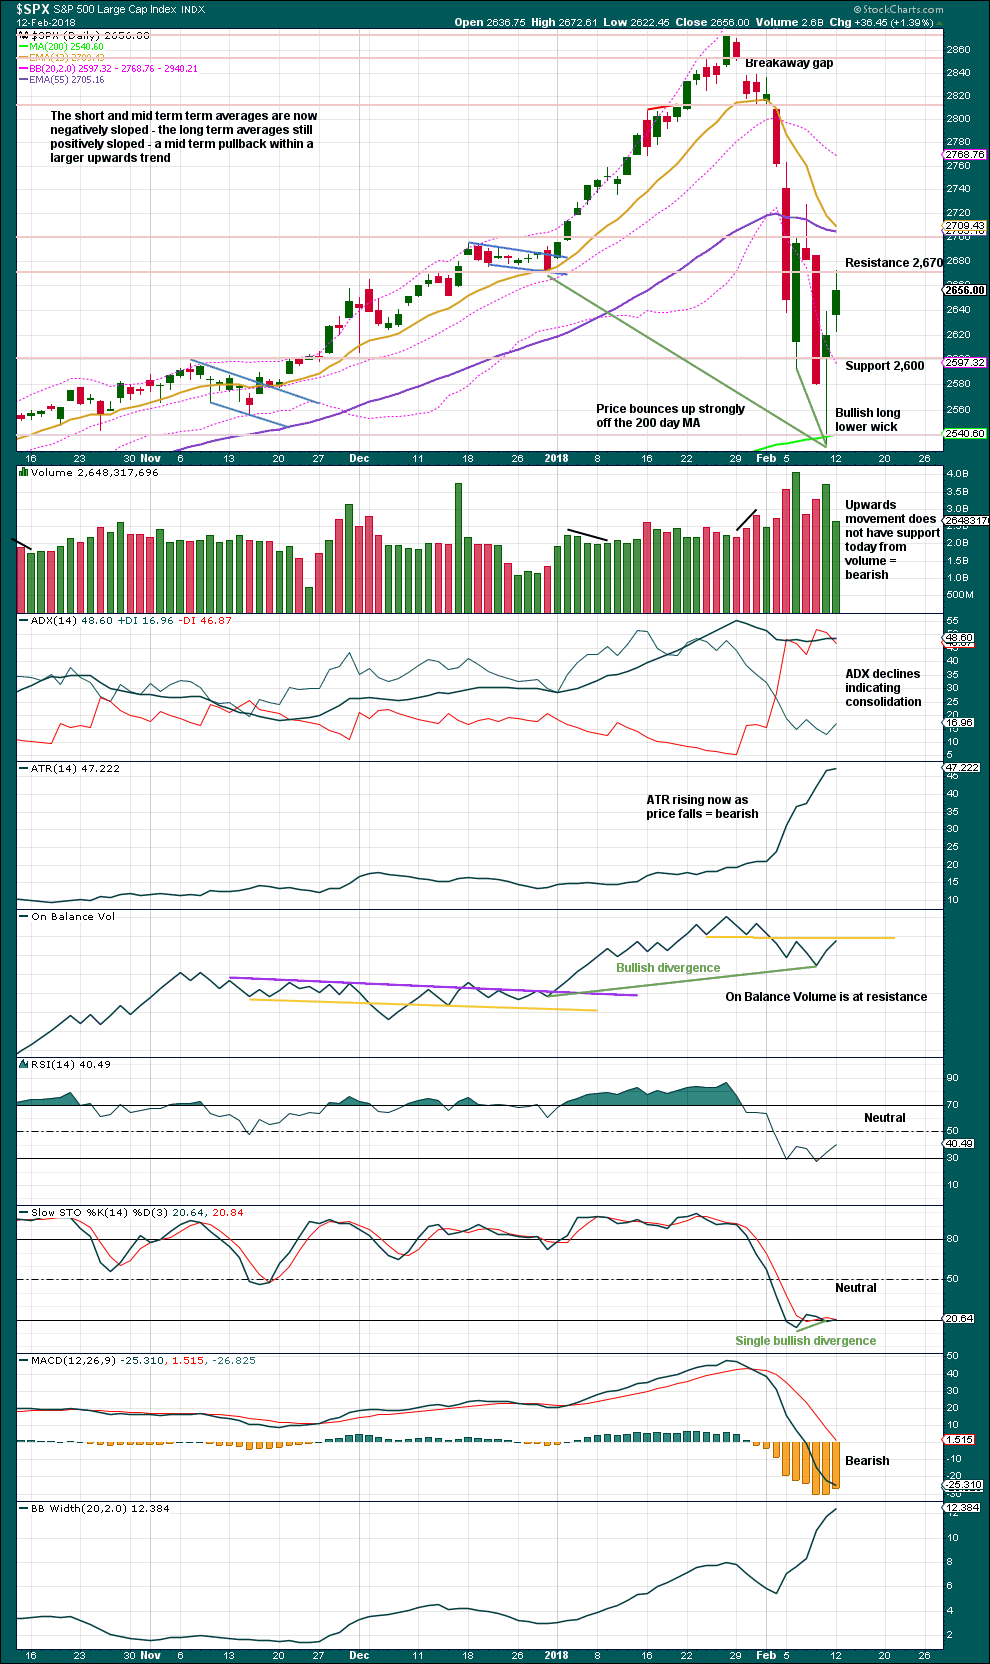
This pullback has now brought RSI well back down into neutral territory. ADX is declining from very extreme. A possible trend change to down is indicated, but as yet no new downwards trend at this time frame.
In the first instance, support should be expected for On Balance Volume at the yellow trend line. A breach below this line by On Balance Volume would be a very strong bearish signal. A bounce up off the line would be a strong bullish signal.
DAILY CHART
Click chart to enlarge. Chart courtesy of StockCharts.com.
Resistance on On Balance Volume may force a downwards reaction tomorrow. This supports the hourly Elliott wave count, which expects a second wave correction.
The lack of volume for this upwards day is not too concerning for the bullish case. Light and declining volume has been a feature of this market for several years, yet price has continued to rise with it.
Overall, it still looks like a low may be in place and the next wave up may have begun.
VOLATILITY – INVERTED VIX CHART
Click chart to enlarge. Chart courtesy of StockCharts.com.
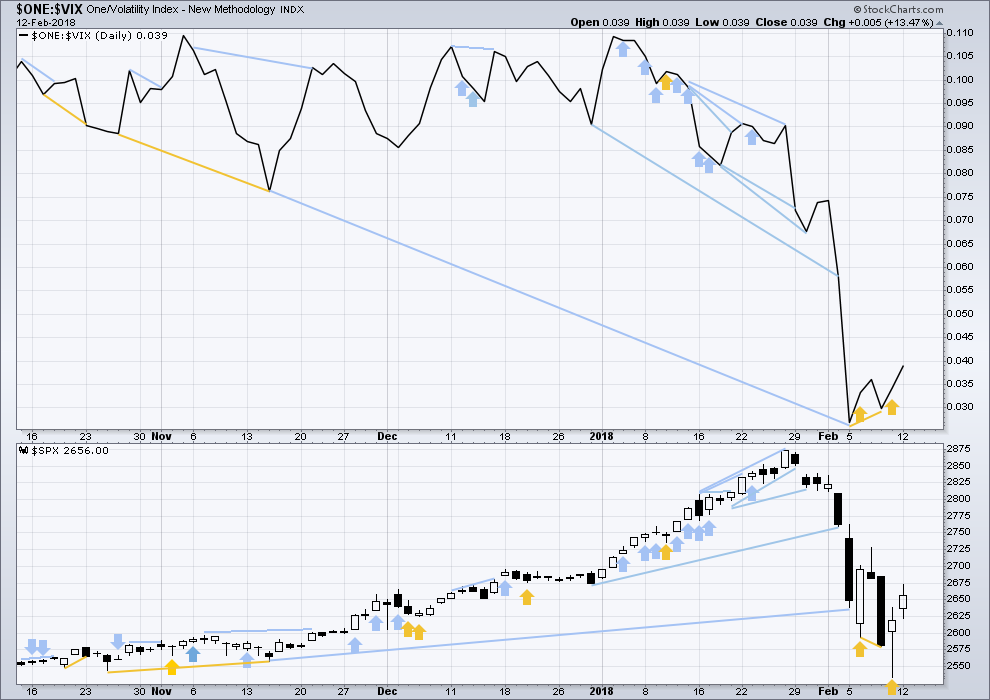
So that colour blind members are included, bearish signals will be noted with blue and bullish signals with yellow.
Normally, volatility should decline as price moves higher and increase as price moves lower. This means that normally inverted VIX should move in the same direction as price.
Both price and inverted VIX have moved higher today. The rise in price comes with a normal corresponding decline in market volatility.
BREADTH – AD LINE
Click chart to enlarge. Chart courtesy of StockCharts.com.
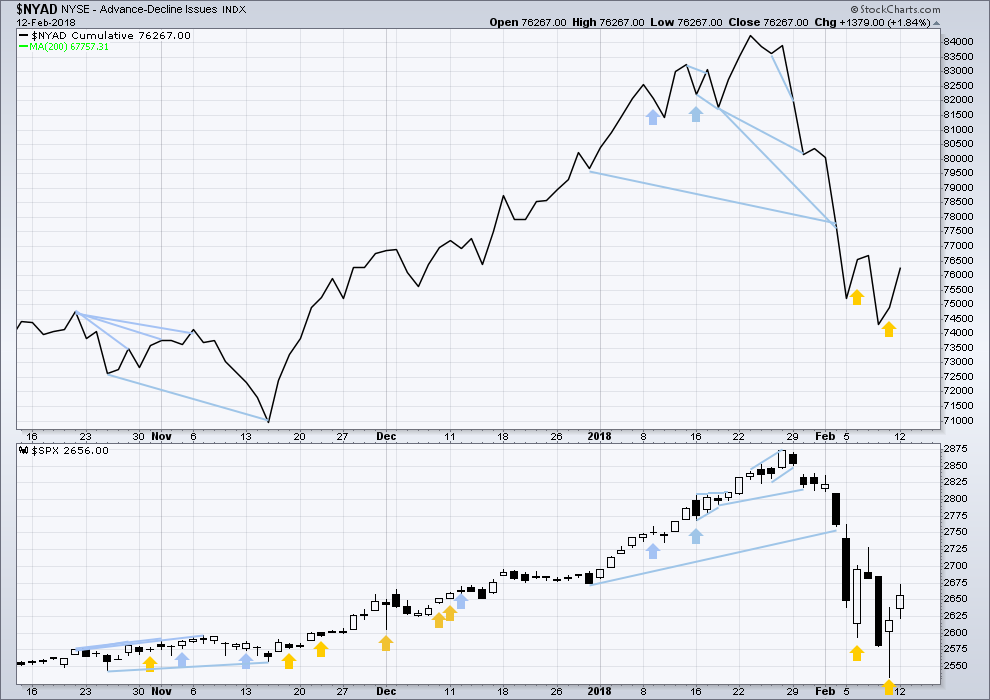
There is normally 4-6 months divergence between price and market breadth prior to a full fledged bear market. This has been so for all major bear markets within the last 90 odd years. With no longer term divergence yet at this point, any decline in price should be expected to be a pullback within an ongoing bull market and not necessarily the start of a bear market.
All of small, mid and large caps last week moved lower. The decline has support from wide breadth.
Breadth should be read as a leading indicator.
Upwards movement today has support from rising market breadth. This is bullish.
DOW THEORY
All indices have made new all time highs as recently as three weeks ago, confirming the ongoing bull market.
The following lows need to be exceeded for Dow Theory to confirm the end of the bull market and a change to a bear market:
DJIA: 17,883.56.
DJT: 7,029.41.
S&P500: 2,083.79.
Nasdaq: 5,034.41.
Published @ 9:05 p.m. EST.