
A pullback was expected to end about 1,318 and an upwards swing to resume there, but the pullback was already over and upwards movement continued.
Summary: Look for a little sideways or lower movement to begin the new week, which may end about 1,344. Thereafter, the upwards swing should continue to the target, which remains at 1,367.
New updates to this analysis are in bold.
Grand SuperCycle analysis is here.
Last in-depth historic analysis with monthly and several weekly charts is here, video is here.
There are multiple wave counts at this time at the weekly and monthly chart levels. In order to make this analysis manageable and accessible only two will be published on a daily basis, one bullish and one bearish. This does not mean the other possibilities may not be correct, only that publication of them all each day is too much to digest. At this stage, they do not diverge from the two possibilities below.
BULLISH ELLIOTT WAVE COUNT
FIRST WEEKLY CHART
Click chart to enlarge.
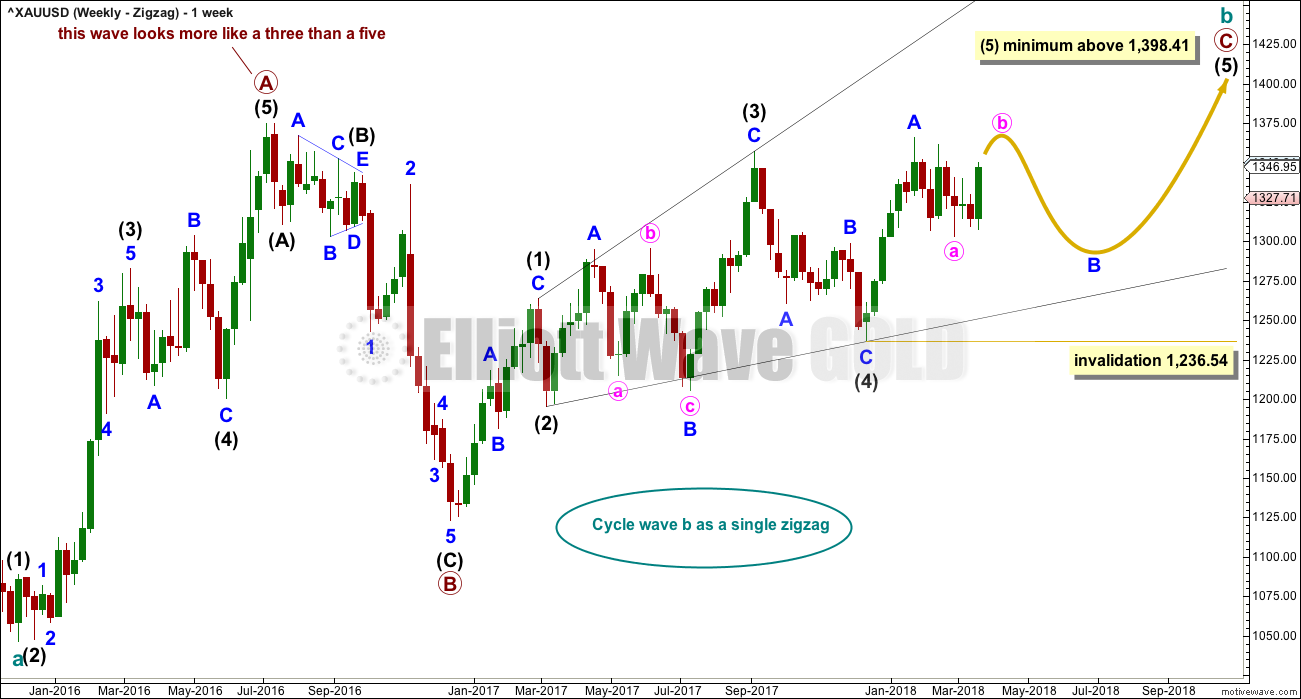
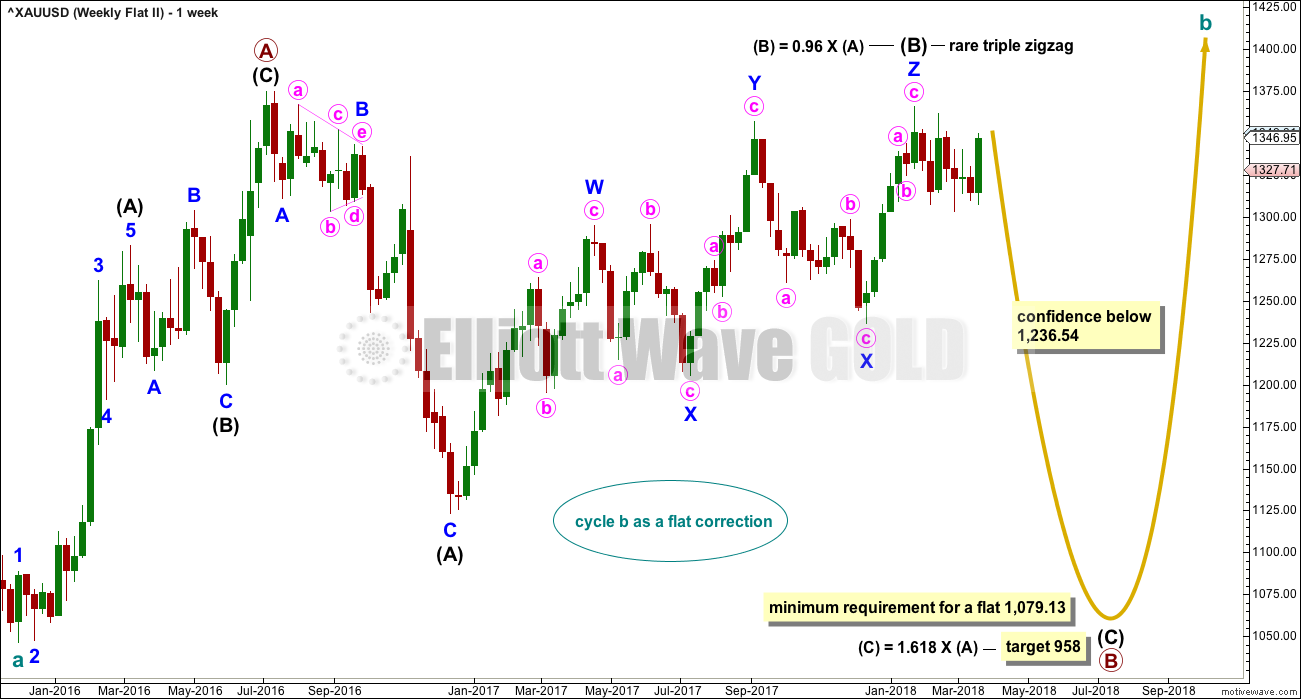
Cycle wave b may be a single zigzag. Zigzags subdivide 5-3-5. Primary wave C must subdivide as a five wave structure and may be either an impulse or an ending diagonal. Overlapping at this stage indicates an ending diagonal.
Within an ending diagonal, all sub-waves must subdivide as zigzags. Intermediate wave (4) must overlap into intermediate wave (1) price territory. This diagonal is expanding: intermediate wave (3) is longer than intermediate wave (1) and intermediate wave (4) is longer than intermediate wave (2). Intermediate wave (5) must be longer than intermediate wave (3), so it must end above 1,398.41 where it would reach equality in length with intermediate wave (3).
Within the final zigzag of intermediate wave (5), minor wave B may not move beyond the start of minor wave A below 1,236.54.
Within the diagonal of primary wave C, each sub-wave is extending in price and so may also do so in time. Within each zigzag, minor wave B may exhibit alternation in structure and may show an increased duration.
Within intermediate wave (1), minor wave B was a triangle lasting 11 days. Within intermediate wave (2), minor wave B was a zigzag lasting 2 days. Within intermediate wave (3), minor wave B was a regular flat lasting 60 days. Within intermediate wave (4), minor wave B was a regular contracting triangle lasting 40 days. Within intermediate wave (5), minor wave B may be expected to be an expanded flat, combination or running triangle to exhibit some alternation in structure. It may last as long as 40 to 60 days. So far it has lasted 41 days (refer to daily chart) and the structure is incomplete.
At this stage, it looks like minor wave B may most likely be a flat correction, or it may also still be a triangle. Both ideas are presented below.
This first weekly chart sees the upwards wave labelled primary wave A as a five wave structure. It must be acknowledged that this upwards wave looks better as a three than it does as a five. The fifth weekly chart below will consider the possibility that it was a three.
FIRST DAILY CHART – FLAT
Click chart to enlarge.
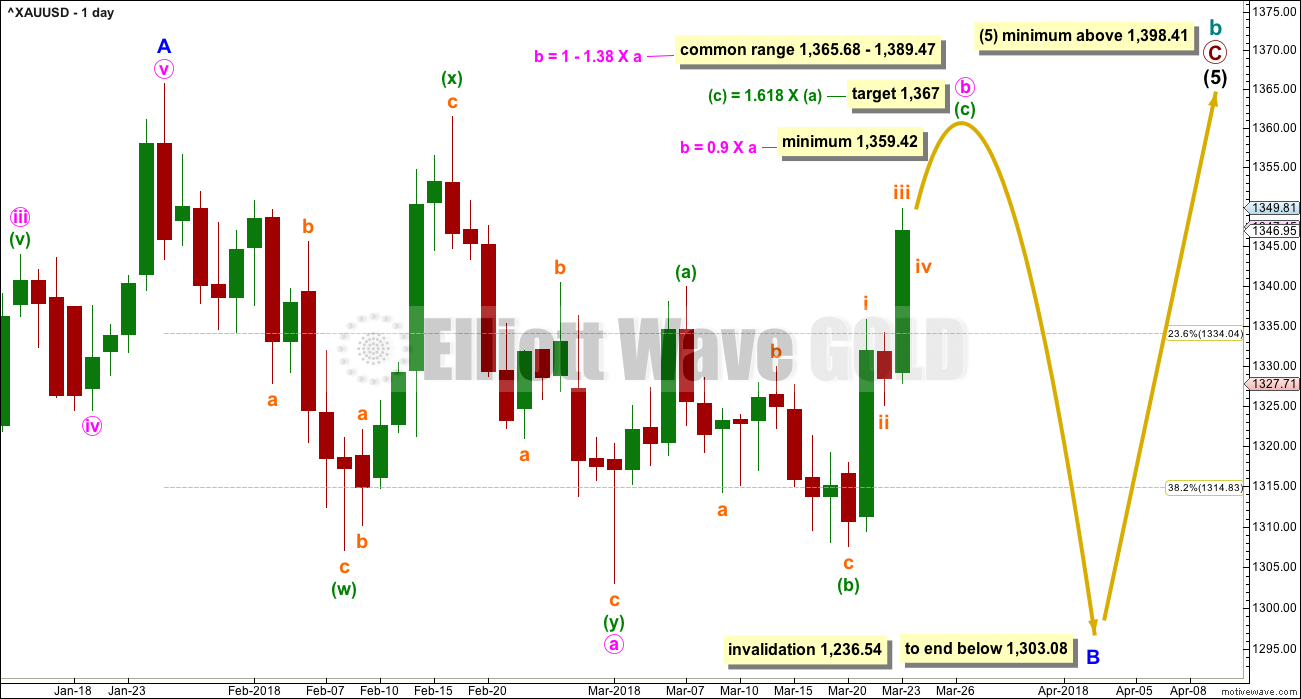
Minor wave B may be an incomplete flat correction, and within the flat minute wave a must subdivide as a three, which may have been a double zigzag.
Minute wave b must also subdivide as a three and must retrace a minimum 0.9 length of minute wave a. The target would see minute wave b end within the most common range for B waves within flats, and at an area of strong resistance.
Minuette wave (c) must subdivide as a five wave structure. It may only be either an impulse or an ending diagonal. An impulse is much more likely.
Subminuette wave ii is showing up on the daily chart. When it is complete, minuette wave (c) should look like a five wave structure, and within it both of subminuette waves ii and iv should show up on the daily chart to give the wave count the right look.
Subminuette wave iv may complete another small range red daily candlestick on Monday.
HOURLY CHART
Click chart to enlarge.
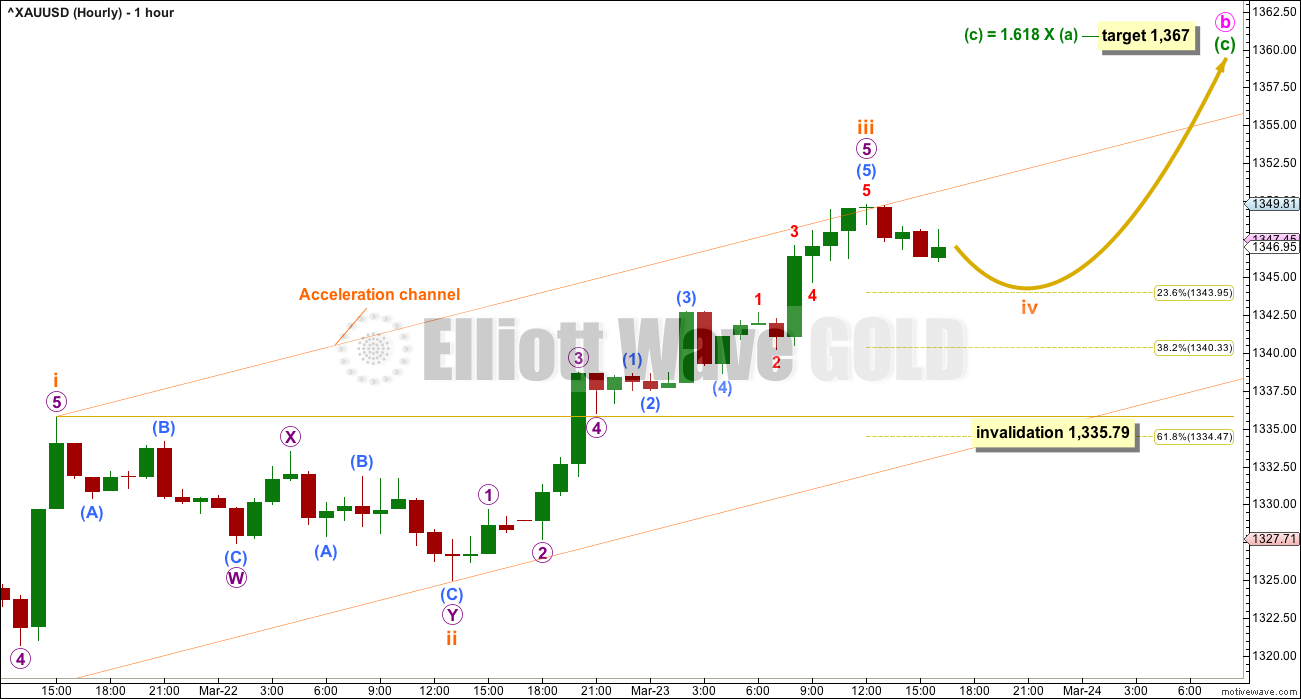
Minuette wave (c) so far looks like it is unfolding as an impulse. So far subminuette waves i, ii and now iii may be complete. If subminuette wave iii is over at Friday’s high, then it would be slightly shorter than subminuette wave i. This limits subminuette wave v to no longer than equality with subminuette wave iii, so that subminuette wave iii is not the shortest actionary wave and the core Elliott wave rule is met.
Subminuette wave ii was a shallow double zigzag. Subminuette wave iv may be a flat, combination or triangle to exhibit alternation in structure with subminuette wave ii. To exhibit alternation in depth it may be more shallow, ending about the 0.236 Fibonacci ratio. Because subminuette wave iv may not move into subminuette wave i price territory, below 1,335.79, it may not be as deep as the 0.618 Fibonacci ratio at 1,334.
Subminuette wave iv should last about a day or so for the wave count to have the right look at the daily chart level.
SECOND DAILY CHART – TRIANGLE
Click chart to enlarge.
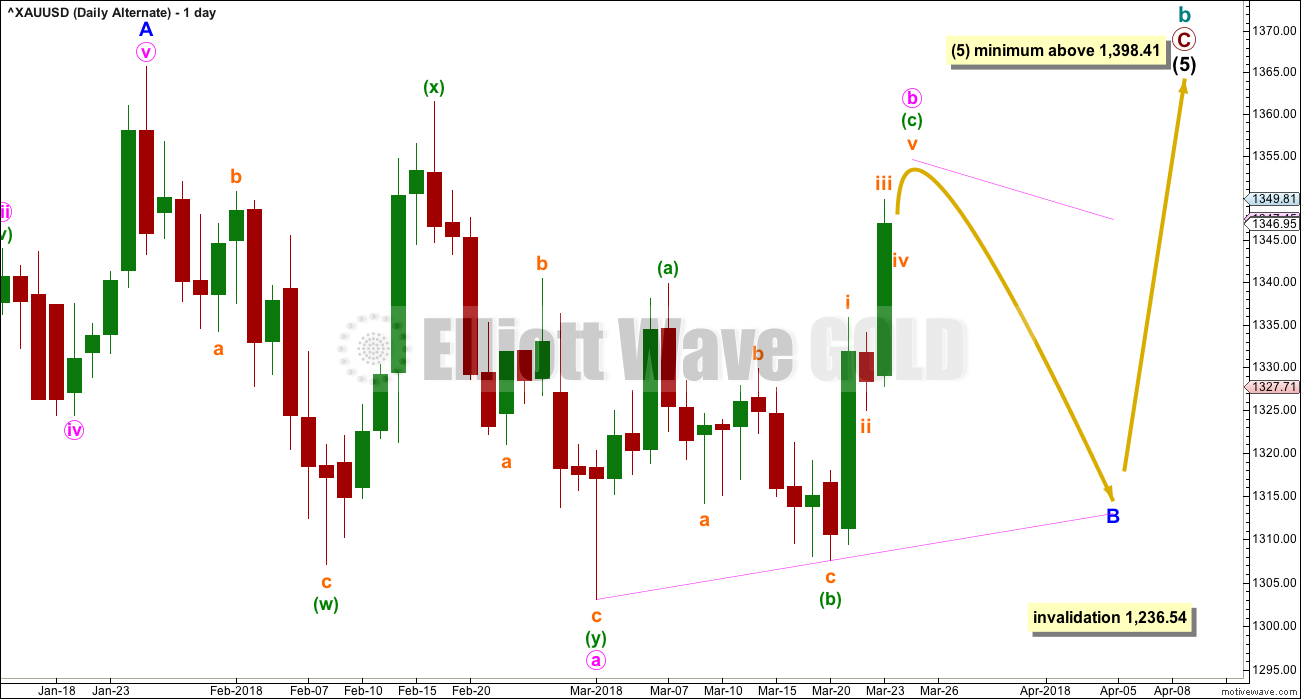
This alternate daily chart is identical to the first daily chart up to the high labelled minor wave A. Thereafter, it looks at a different structure for minor wave B.
Minor wave B may be an incomplete triangle, and within it minute wave a may have been a double zigzag. All remaining triangle sub-waves must be simple A-B-C structures, and three of the four remaining sub-waves must be simple zigzags. One remaining sub-wave may be a flat correction.
Minute wave b may be unfolding upwards as a single zigzag, and within it minuette wave (b) may not move beyond the start of minuette wave (a) below 1,303.08.
This alternate wave count expects weeks of choppy overlapping movement in an ever decreasing range.
All daily charts expect an impulse is unfolding higher for the short term. The subdivisions and labelling at the hourly chart level would all be mostly the same.
BEARISH ELLIOTT WAVE COUNT
FIFTH WEEKLY CHART
Click chart to enlarge.
There were five weekly charts published in the last historic analysis. This fifth weekly chart is the most immediately bearish wave count, so this is published as a bearish possibility.
This fifth weekly chart sees cycle wave b as a flat correction, and within it intermediate wave (B) may be a complete triple zigzag. This would indicate a regular flat as intermediate wave (B) is less than 1.05 the length of intermediate wave (A).
If cycle wave b is a flat correction, then within it primary wave B must retrace a minimum 0.9 length of primary wave A at 1,079.13 or below. The most common length of B waves within flats is from 1 to 1.38 times the length of the A wave. The target calculated would see primary wave B end within this range.
I have only seen two triple zigzags before during my 10 years of daily Elliott wave analysis. If this wave count turns out to be correct, this would be the third. The rarity of this structure is identified on the chart.
FIFTH DAILY CHART
Click chart to enlarge.
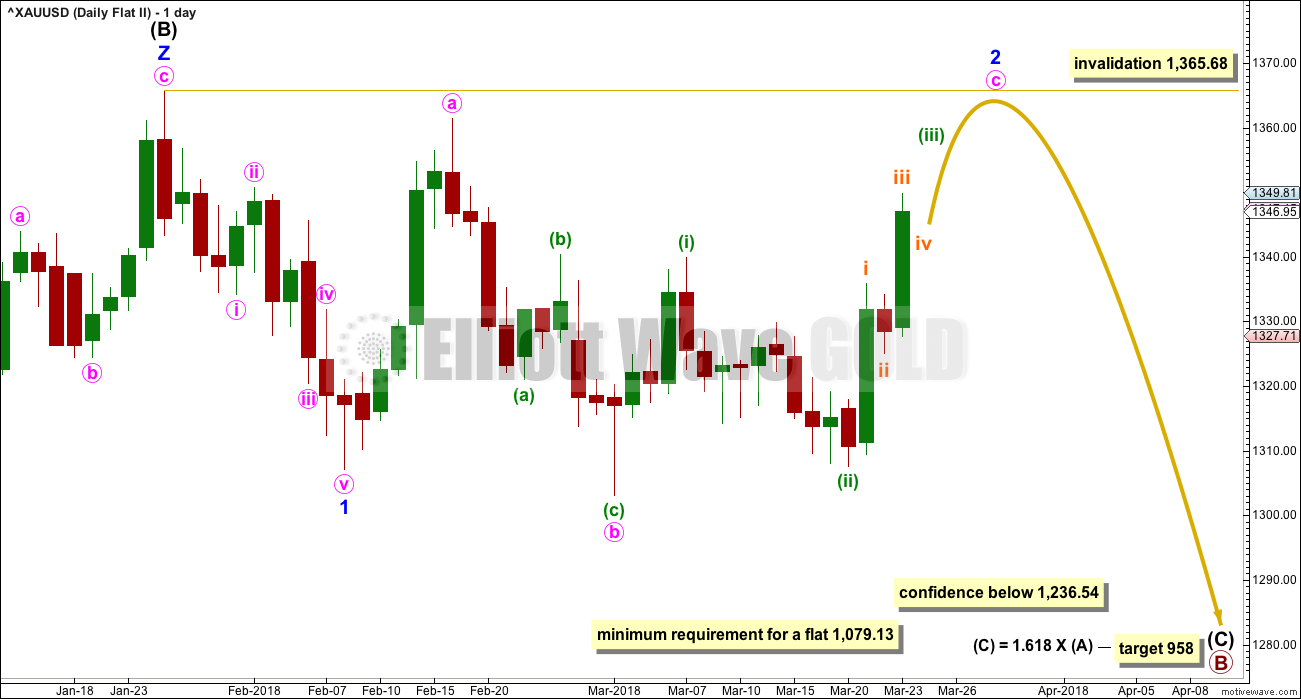
If a new wave down at intermediate degree is beginning, then the first wave of minor wave 1 must subdivide as a five, which may only be an impulse or a leading diagonal.
Minor wave 1 may have been a complete impulse over on the 8th of February. But this downwards wave does not look very good as a five. It can be made to fit at lower time frames, but this movement fits better as a zigzag. The probability of this wave count is reduced.
Minor wave 2 may be an incomplete expanded flat. Minute wave c would be likely to end at least slightly above the end of minute wave a at 1,361.46 to avoid a truncation and a very rare running flat. Minor wave 2 may not move beyond the start of minor wave 1 above 1,365.68.
TECHNICAL ANALYSIS
WEEKLY CHART
Click chart to enlarge. Chart courtesy of StockCharts.com.
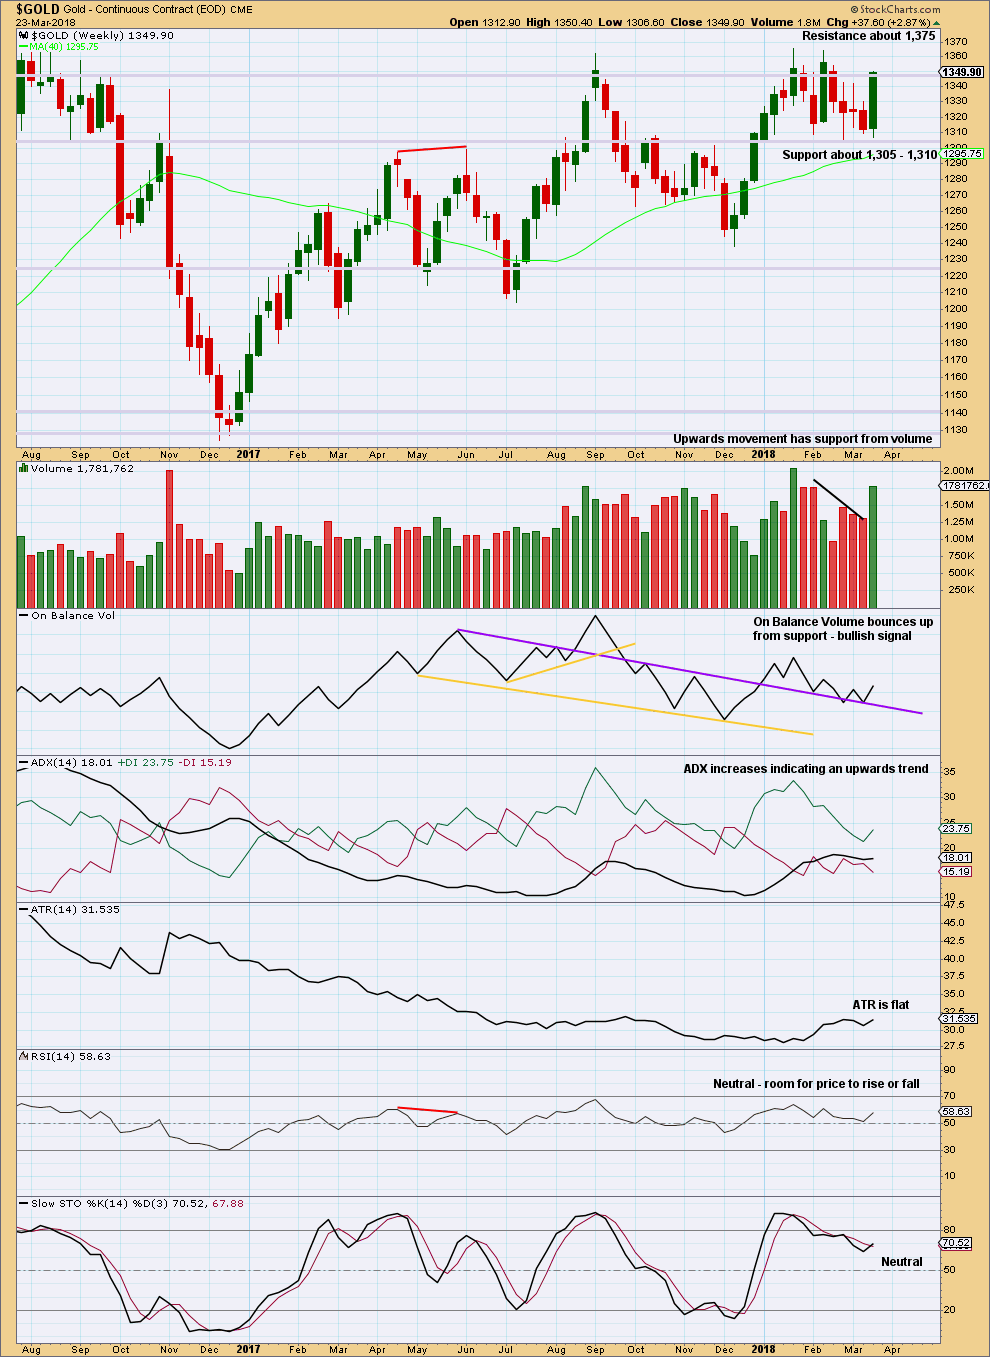
Again, price bounces up off support. This week’s strong weekly candlestick with an almost shaven head is very bullish. Support from volume and a bullish signal from On Balance Volume all support the Elliott wave analysis which expects upwards movement is incomplete.
Look for final resistance about 1,375.
DAILY CHART
Click chart to enlarge. Chart courtesy of StockCharts.com.
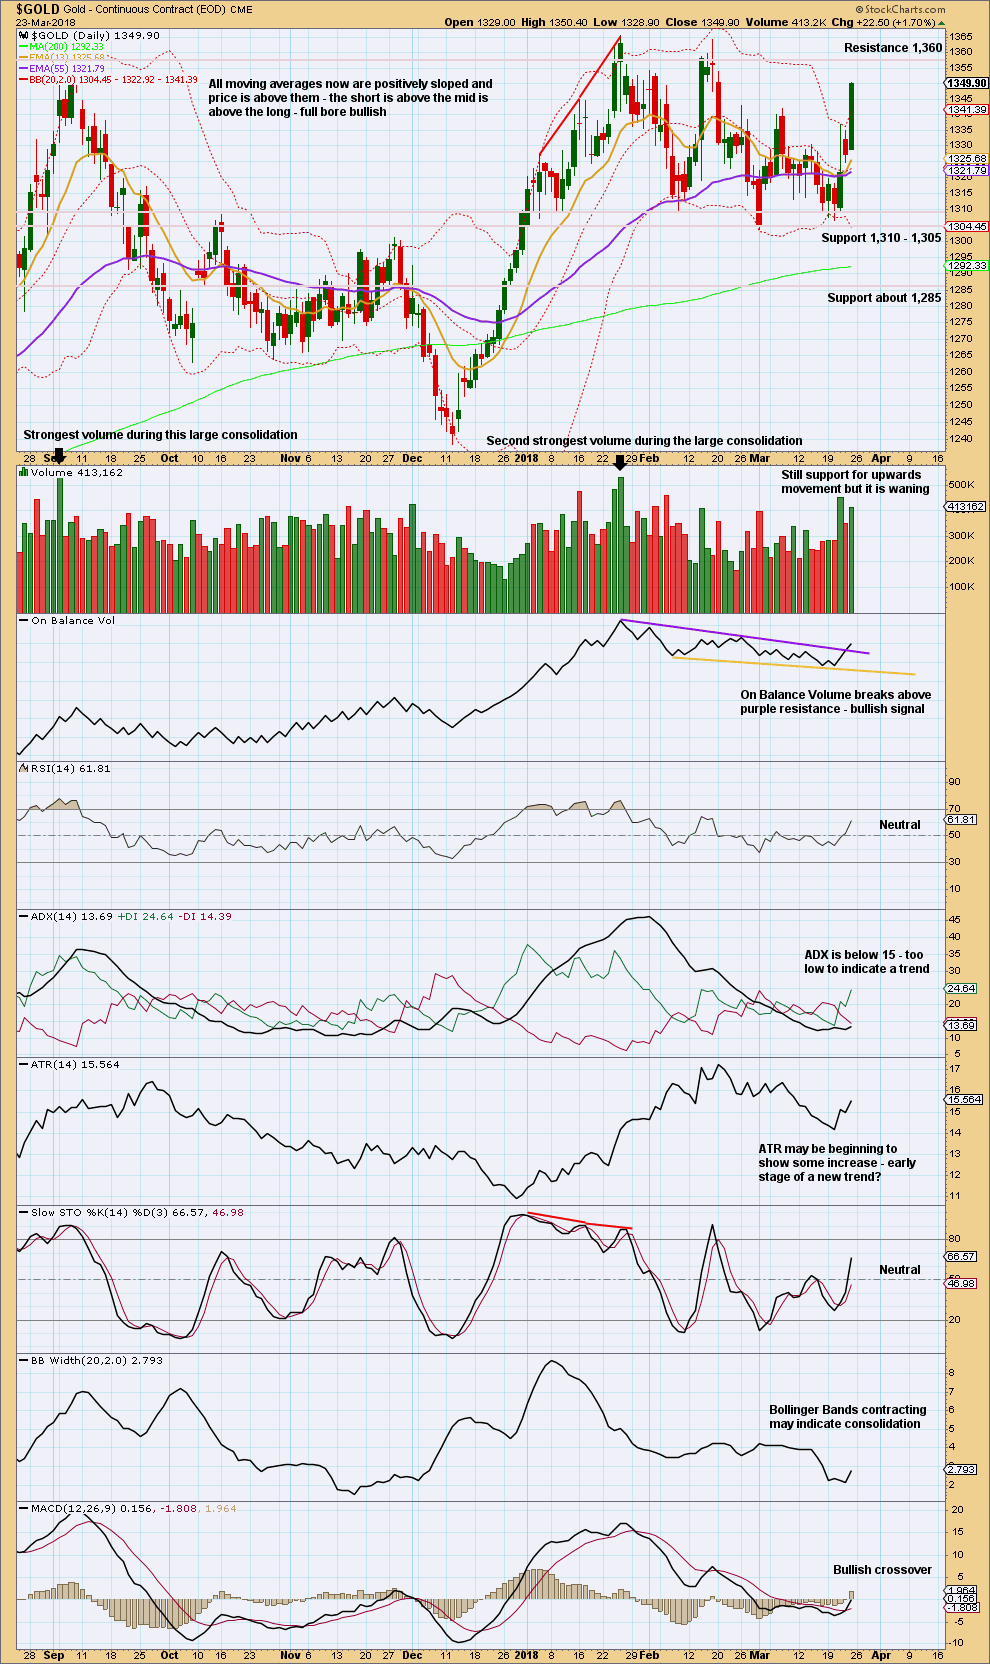
Looking at the bigger picture, Gold has been within a large consolidation since about January 2017 (this chart does not show all of this large consolidation), and during this consolidation it is two upwards days that have strongest volume and an upwards week that has strongest volume. Volume suggests an upwards breakout may be more likely than downwards.
Currently, Gold is within a smaller consolidation that began in early January 2018. This consolidation is delineated by support about 1,310 to 1,305 and resistance (final) about 1,375. It is an upwards day during this smaller consolidation that has strongest volume, suggesting an upwards breakout may be more likely here than downwards.
A very strong upwards day with an almost shaven head and support from volume offer good support to the Elliott wave counts which see this as a third wave. A bullish signal from On Balance Volume also offers support to the Elliott wave counts.
Resistance is next at 1,360. Thereafter, further resistance is at 1,365 and then 1,375.
GDX WEEKLY CHART
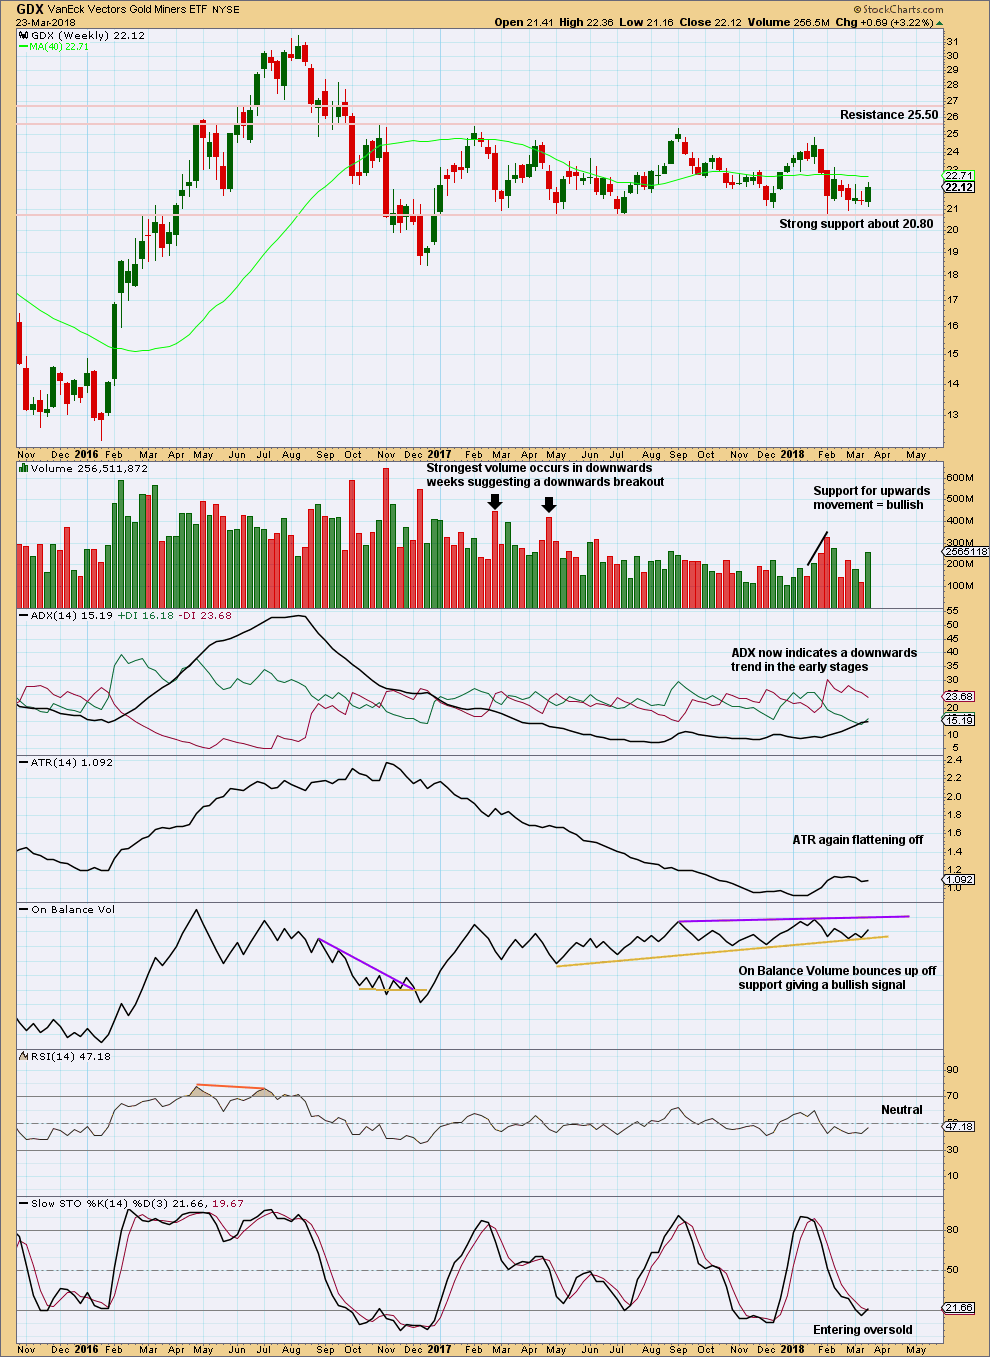
Click chart to enlarge. Chart courtesy of StockCharts.com.
Support about 20.80 has been tested about eight times and so far has held. The more often a support area is tested and holds, the more technical significance it has.
In the first instance, expect this area to continue to provide support. Only a strong downwards day, closing below support and preferably with some increase in volume, would constitute a downwards breakout from the consolidation that GDX has been in for a year now.
Resistance is about 25.50. Only a strong upwards day, closing above resistance and with support from volume, would constitute an upwards breakout.
Bullish volume this week and a bullish signal from On Balance Volume offer support to the view that an upwards swing should continue here to resistance.
GDX DAILY CHART
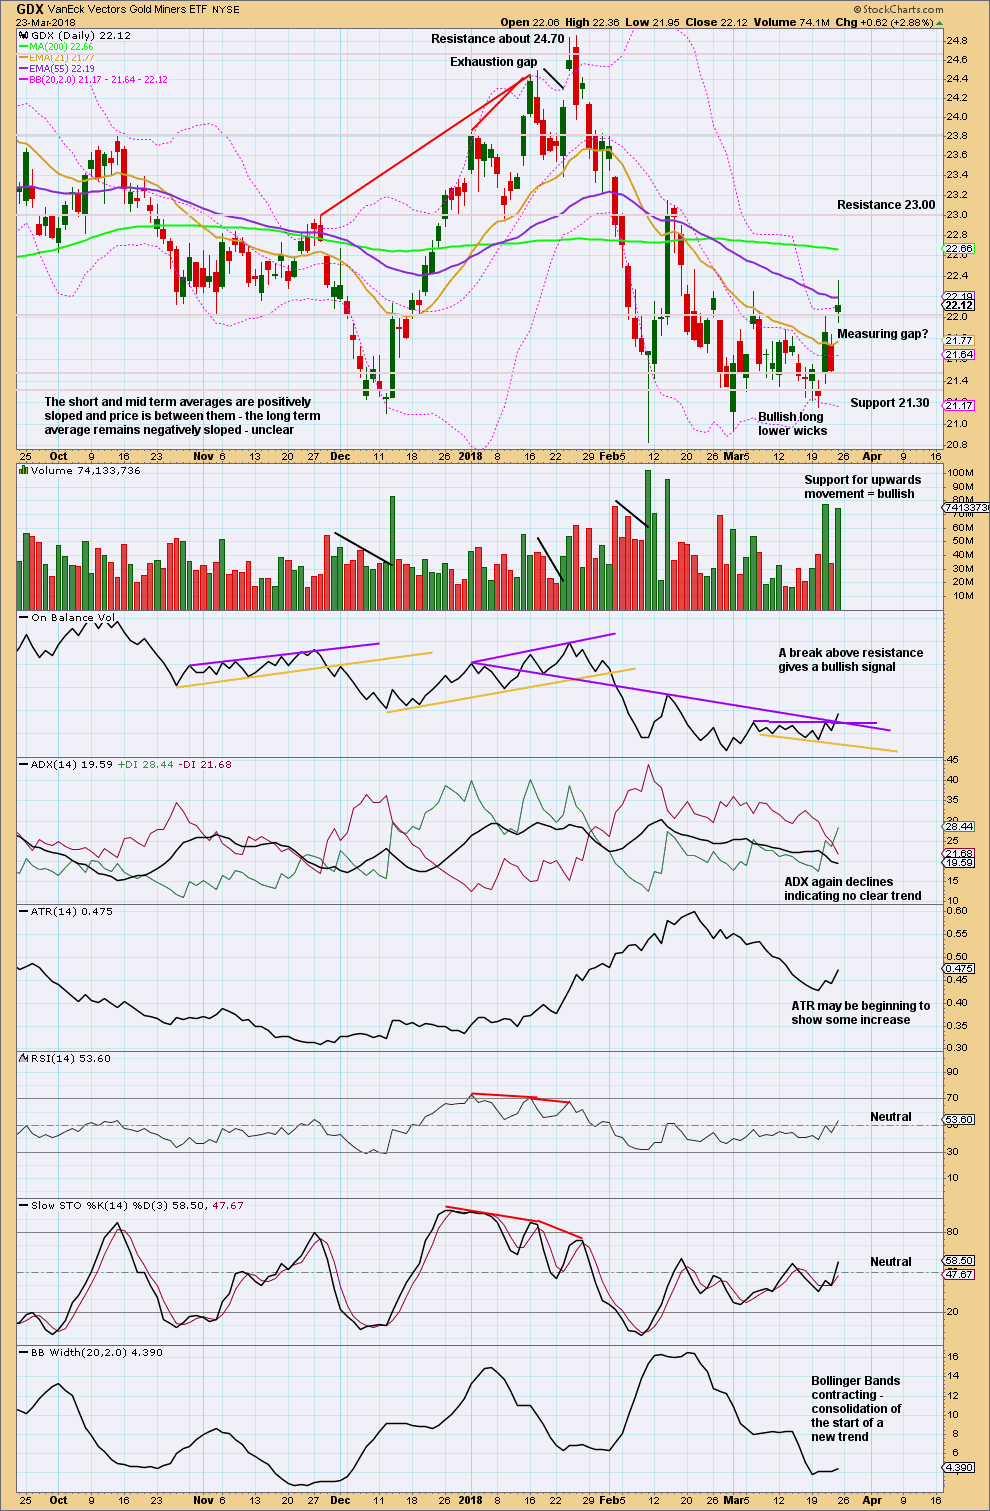
Click chart to enlarge. Chart courtesy of StockCharts.com.
A bullish signal from On Balance Volume at the daily chart level and a bullish volume profile suggest more upwards movement next week for GDX.
Assume the opening gap for Friday is a measuring gap until proven otherwise. Measuring gaps may be used in trading to place stops. They are not usually closed for some time, so in an upwards trend should provide support. Stops may be placed just below the gap. This measuring gap gives a target at 22.63.
The long upper wick on Friday’s candlestick suggests a short term pullback may begin on Monday. Volume suggests any downwards movement here is a counter trend movement though.
Published @ 10:41 p.m. EST on 24th March, 2018.
Hourly chart updated:
Hi Lara,
I 2nd Dreamer’s question about links.
Also, I know you are extremely busy. If/when you are able would you consider doing an update/showing a chart and commenting on your outlook for US Dollar at least Intermediate/Long term.
Thank you,
Melanie
I can’t find Dreamers question about links?
I have updated USD analysis last week. It’s here.
Lara,
Dreamer’s comment is under Lara’s Wkly. We are wondering if links do not work because Lara’s Wkly is currently ‘public analysis’?
Thanks for tip on US Dollar.
Thanks Melanie, I found Dreamer’s comment.
Cesar’s fixing the links now.
Feels like the second daily may become the preferred or sub 3 is continuing
I think submineutte iv was over very quickly. That happens fairly often for commodities. They have very strong fifth waves, forcing the fourth waves just before to be relatively brief and shallow. The disproportion between a quick fourth wave and a longer lasting second wave can give their impulses a three wave look at higher time frames.
I think that’s what’s happening here… maybe.