
A downwards day was expected for Thursday, and this is exactly what happened.
The target is now calculated at two degrees to a small $1 zone.
Summary: Look for downwards movement now to end about 1,318 – 1,317. Thereafter, the upwards swing may resume. Expect this upwards swing to continue for a few days. The target is at 1,391, but this may be too high.
New updates to this analysis are in bold.
Grand SuperCycle analysis is here.
Last in-depth historic analysis with monthly and several weekly charts is here, video is here.
There are multiple wave counts at this time at the weekly and monthly chart levels. In order to make this analysis manageable and accessible only two will be published on a daily basis, one bullish and one bearish. This does not mean the other possibilities may not be correct, only that publication of them all each day is too much to digest. At this stage, they do not diverge from the two possibilities below.
BULLISH ELLIOTT WAVE COUNT
FIRST WEEKLY CHART
Click chart to enlarge.
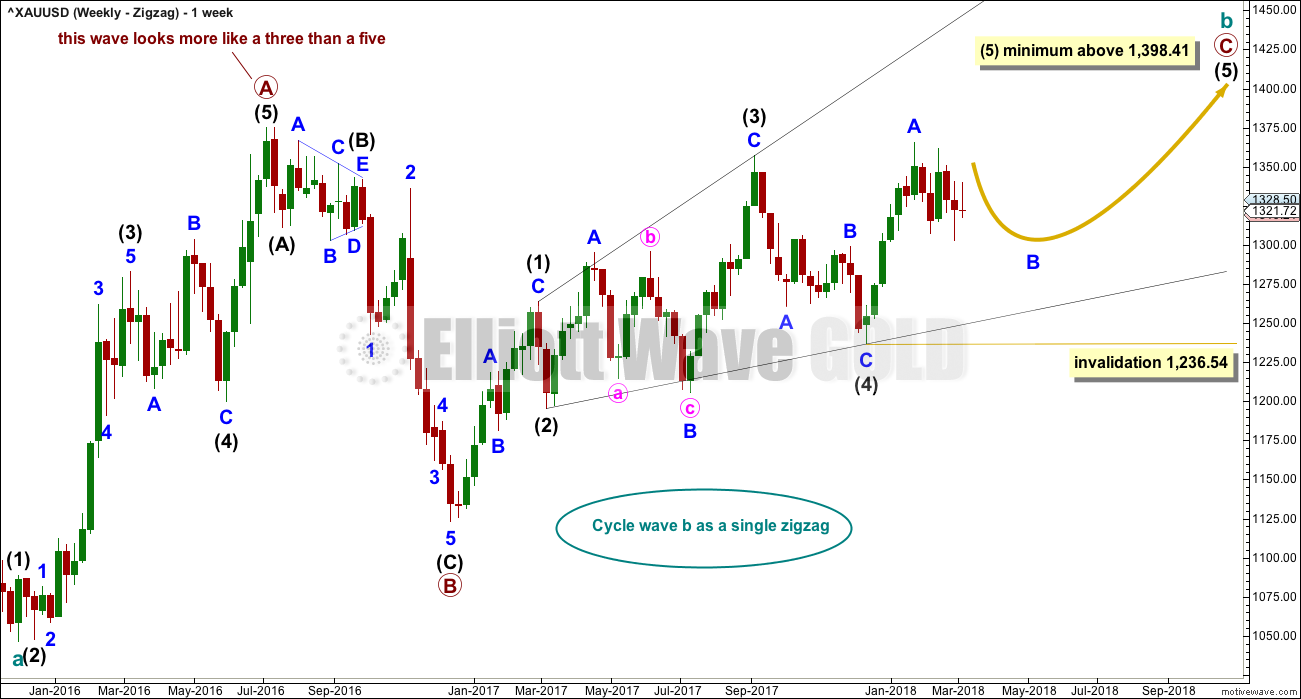
Cycle wave b may be a single zigzag. Zigzags subdivide 5-3-5. Primary wave C must subdivide as a five wave structure and may be either an impulse or an ending diagonal. Overlapping at this stage indicates an ending diagonal.
Within an ending diagonal, all sub-waves must subdivide as zigzags. Intermediate wave (4) must overlap into intermediate wave (1) price territory. This diagonal is expanding: intermediate wave (3) is longer than intermediate wave (1) and intermediate wave (4) is longer than intermediate wave (2). Intermediate wave (5) must be longer than intermediate wave (3), so it must end above 1,398.41 where it would reach equality in length with intermediate wave (3).
Within the final zigzag of intermediate wave (5), minor wave B may not move beyond the start of minor wave A below 1,236.54.
Within the diagonal of primary wave C, each sub-wave is extending in price and so may also do so in time. Within each zigzag, minor wave B may exhibit alternation in structure and may show an increased duration.
Within intermediate wave (1), minor wave B was a triangle lasting 11 days. Within intermediate wave (2), minor wave B was a zigzag lasting 2 days. Within intermediate wave (3), minor wave B was a regular flat lasting 60 days. Within intermediate wave (4), minor wave B was a regular contracting triangle lasting 40 days. Within intermediate wave (5), minor wave B may be expected to be an expanded flat, combination or running triangle to exhibit some alternation in structure. It may last as long as 40 to 60 days. So far it has lasted 29 days and the structure is incomplete.
This first weekly chart sees the upwards wave labelled primary wave A as a five wave structure. It must be acknowledged that this upwards wave looks better as a three than it does as a five. The fifth weekly chart below will consider the possibility that it was a three.
FIRST DAILY CHART
Click chart to enlarge.
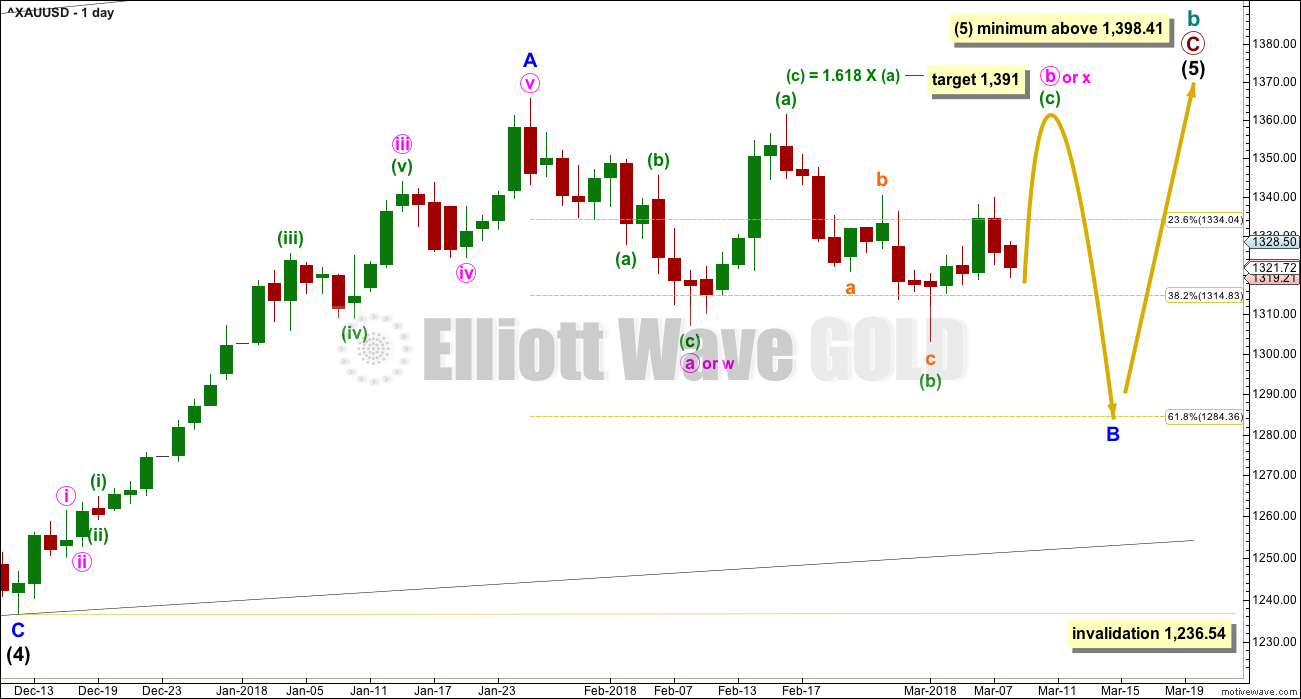
Within the ending diagonal, intermediate wave (5) must sub-divide as a zigzag.
Minor wave B may now be either a flat or a combination. If the last low now labelled minuette wave (b) is the end of minute wave a as a double zigzag, then minor wave B may still be a triangle. If the current upwards swing completes and looks like a zigzag, then this possibility would be published as an alternate.
Within either a flat or combination for minor wave B, the correction of minute wave b or x is unfolding as an expanded flat correction. When this expanded flat is complete, then a downwards swing for minute wave c or y would be expected.
Because both options of a flat or combination for minor wave B now expect minute wave b or x to be completing as an expanded flat, they both need to see a five up complete for minuette wave (c). Hourly charts for both ideas would now be exactly the same, so only one hourly chart is published at this time.
If minor wave B is unfolding as a flat correction, then minute wave c may move reasonably below the low of minute wave a at 1,307.09 and must be a five wave structure.
If minor wave B is unfolding as a combination, then minute wave y may be a flat or triangle and may end about the same level as minute wave w at 1,307.09.
HOURLY CHART
Click chart to enlarge.
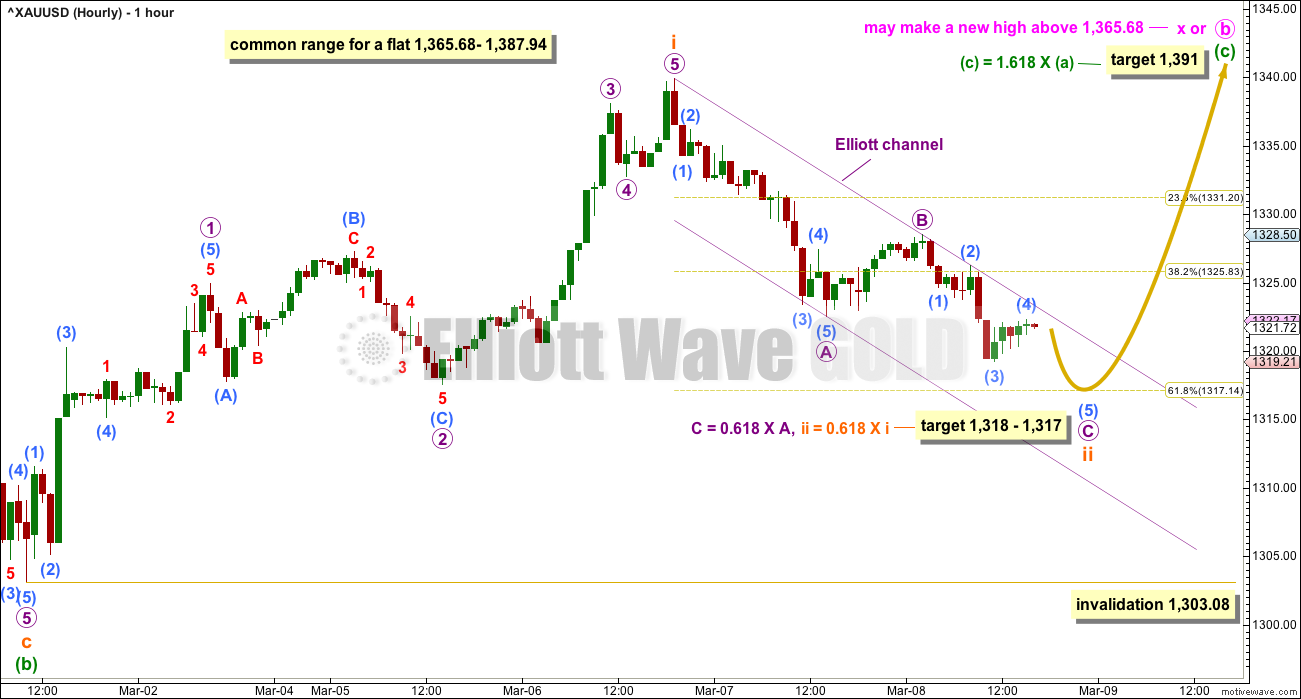
Minuette wave (c) upwards should be a five wave structure. It may take a few days to unfold.
Subminuette wave ii may be unfolding as a zigzag. A target is calculated now at two degrees giving a small $1 zone for it to end. It may now end within the next 24 hours.
Subminuette wave ii may not move beyond the start of subminuette wave i below 1,303.08.
When subminuette wave ii is complete, then subminuette wave iii must make a new high above the high of subminuette wave i at 1,339.89. The final target of minuette wave (c) remains the same.
BEARISH ELLIOTT WAVE COUNT
FIFTH WEEKLY CHART
Click chart to enlarge.
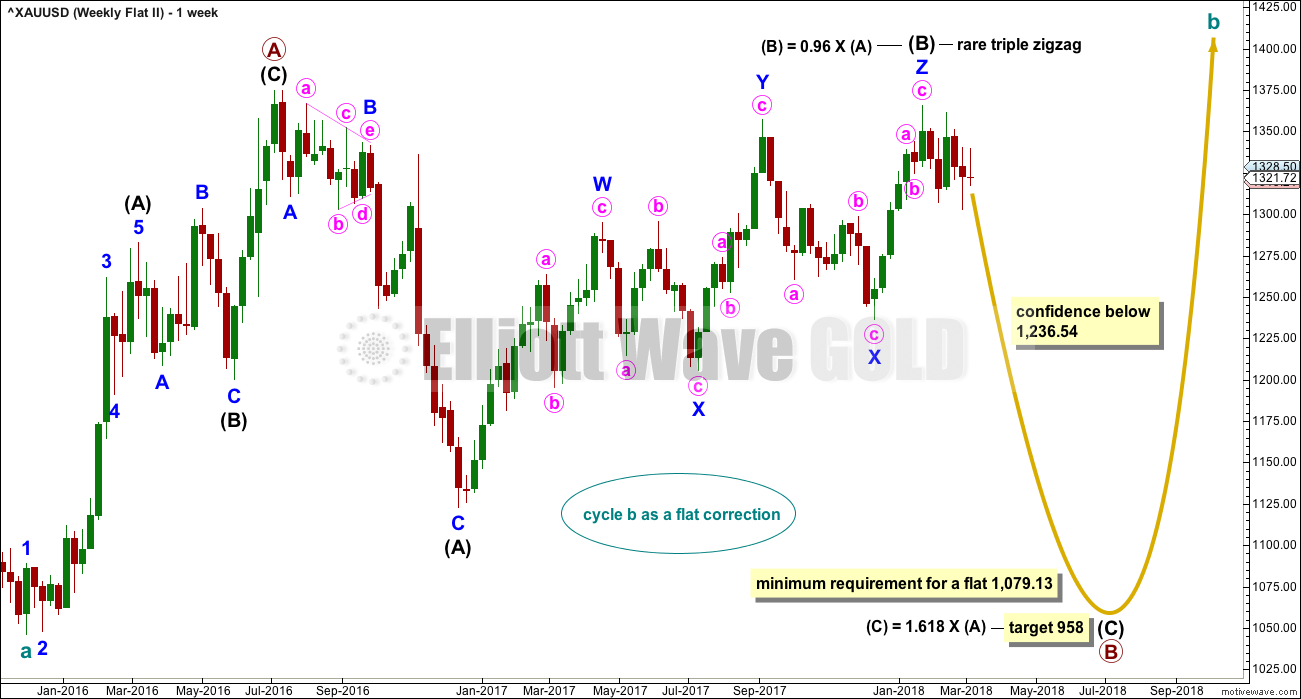
There were five weekly charts published in the last historic analysis. This fifth weekly chart is the most immediately bearish wave count, so this is published as a bearish possibility.
This fifth weekly chart sees cycle wave b as a flat correction, and within it intermediate wave (B) may be a complete triple zigzag. This would indicate a regular flat as intermediate wave (B) is less than 1.05 the length of intermediate wave (A).
If cycle wave b is a flat correction, then within it primary wave B must retrace a minimum 0.9 length of primary wave A at 1,079.13 or below. The most common length of B waves within flats is from 1 to 1.38 times the length of the A wave. The target calculated would see primary wave B end within this range.
I have only seen two triple zigzags before during my 10 years of daily Elliott wave analysis. If this wave count turns out to be correct, this would be the third. The rarity of this structure is identified on the chart.
TECHNICAL ANALYSIS
WEEKLY CHART
Click chart to enlarge. Chart courtesy of StockCharts.com.
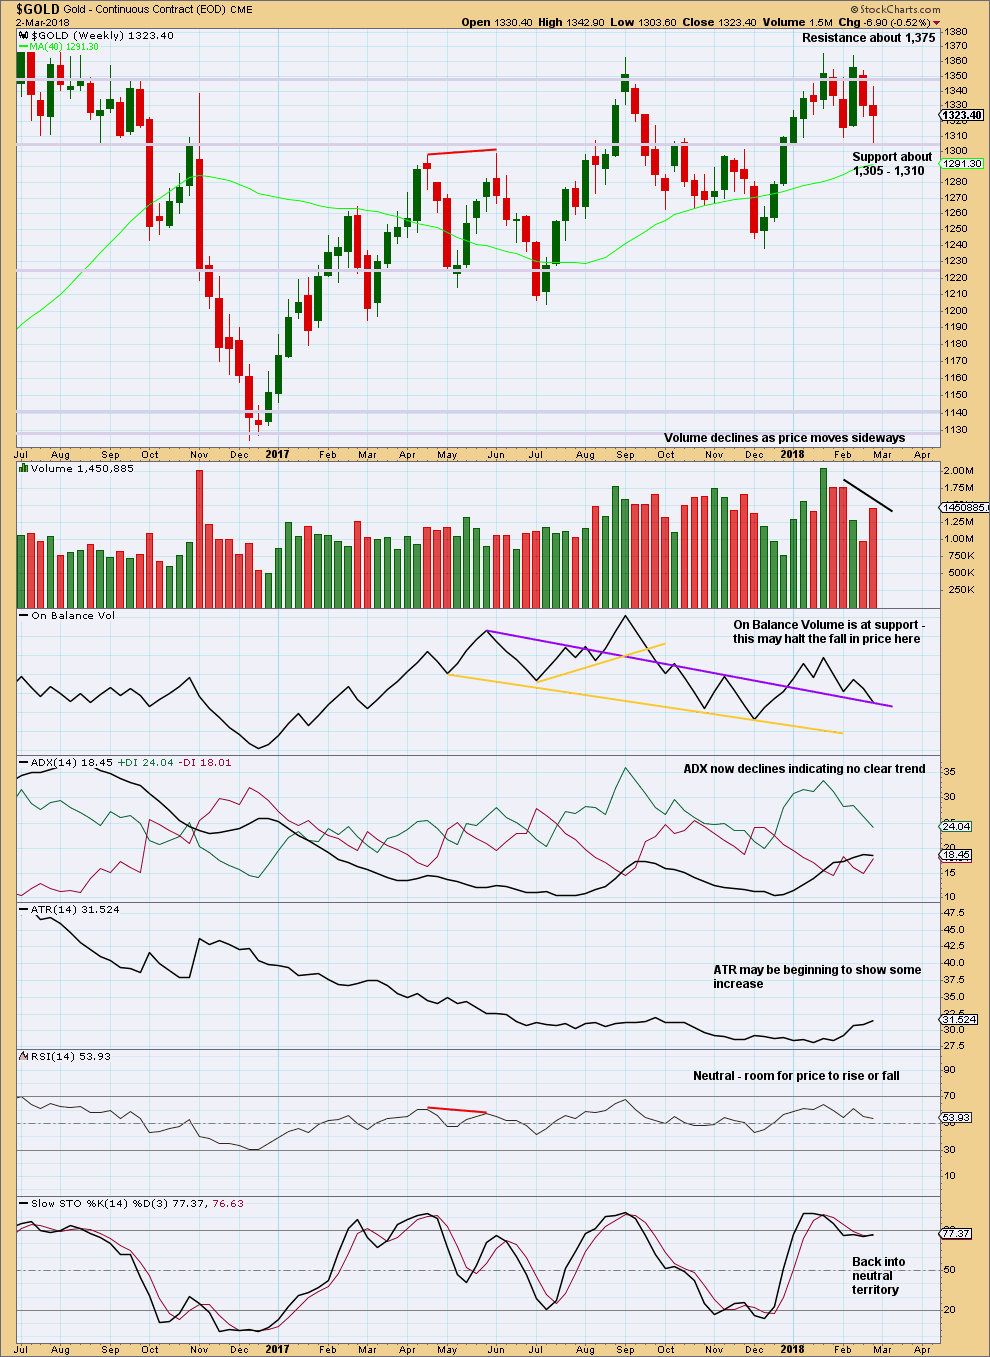
Price has again bounced up strongly from support about 1,305 – 1,310. The balance of volume during last week was downwards, and there was some support from volume during the week for this movement. This is bearish.
But On Balance Volume at support along with price at support should be given reasonable weight. Look for an upwards swing to continue to resistance.
DAILY CHART
Click chart to enlarge. Chart courtesy of StockCharts.com.
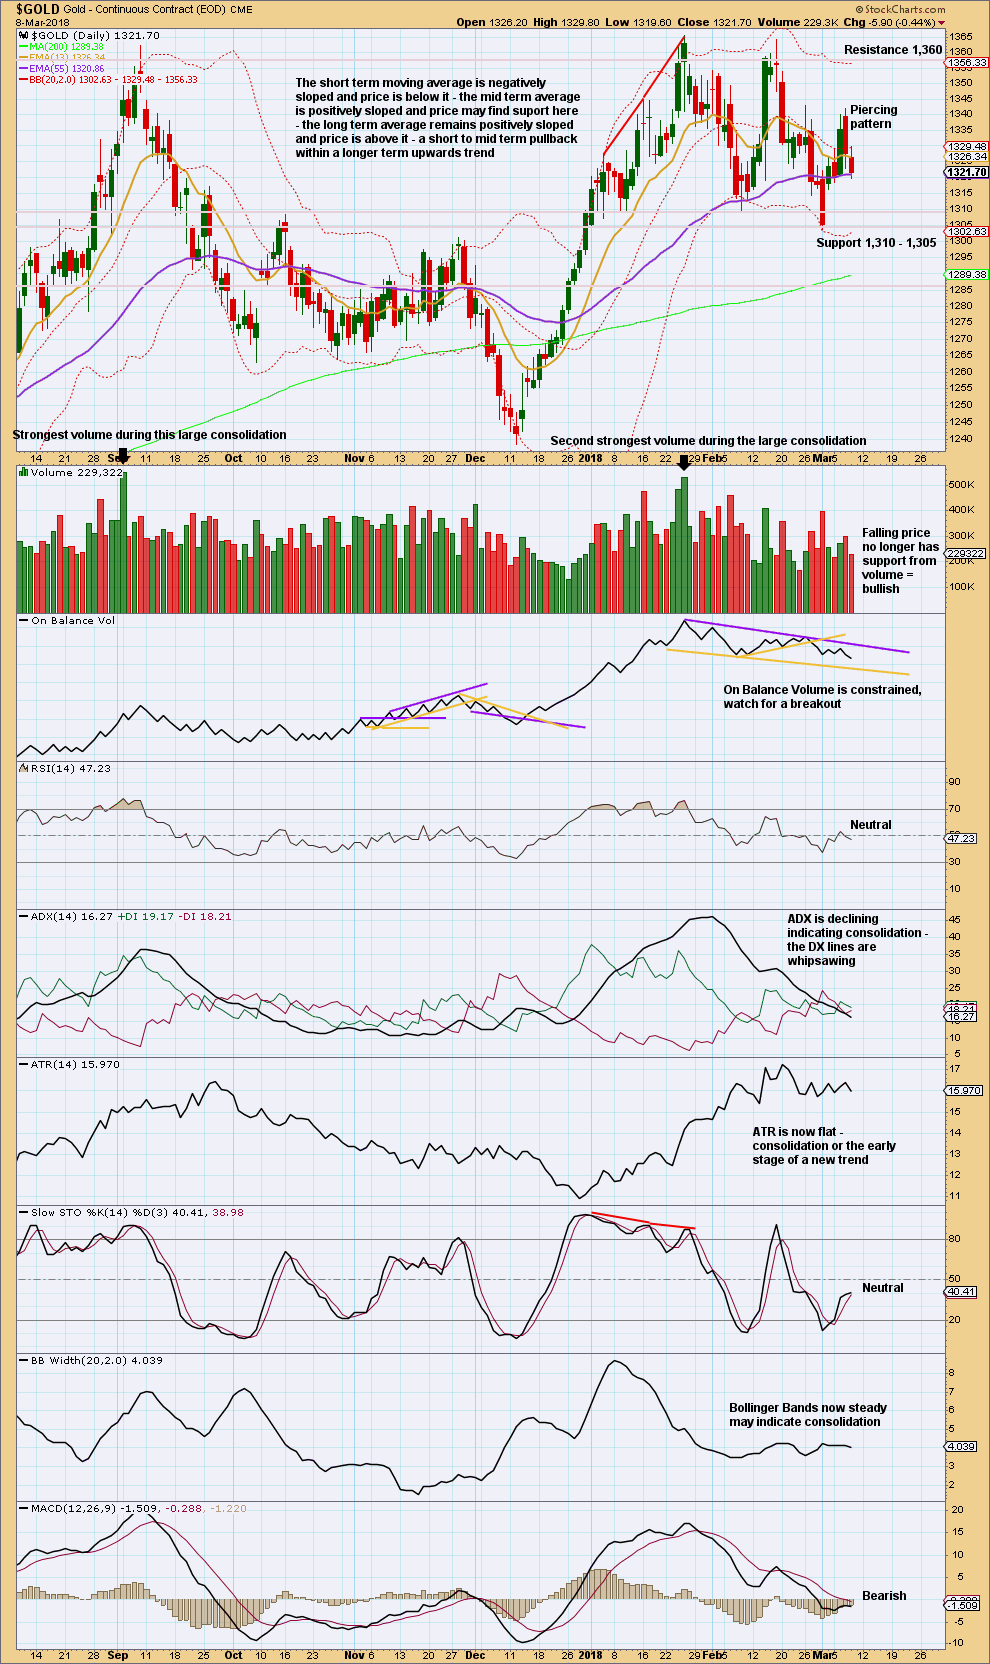
Looking at the bigger picture, Gold has been within a large consolidation since about January 2017 (this chart does not show all of this large consolidation), and during this consolidation it is two upwards days that have strongest volume and an upwards week that has strongest volume. Volume suggests an upwards breakout may be more likely than downwards.
Currently, Gold is within a smaller consolidation that began in early January 2018. This consolidation is delineated by support about 1,310 to 1,305 and resistance (final) about 1,375. It is an upwards day during this smaller consolidation that has strongest volume, suggesting an upwards breakout may be more likely here than downwards.
Price is currently swinging from resistance to support and back again. Price does not move in a straight line when it is within a consolidation and swings. Consolidations are characterised by very choppy, overlapping movement. Resistance or support may be overshot, only to then see price turn and move back within the zone. An approach to consolidations using classic analysis is normally to wait for a breakout before looking to enter a position. An upwards breakout should have support from volume for confidence. A downwards breakout does not necessarily need support from volume, but it is nice to have it.
ADX usually declines and the +DX and -DX lines may whipsaw during a consolidation.
Price found support while Stochastics was oversold. Look now for an end to the downwards swing and an upwards swing to continue this week to resistance. For the very short term, volume now declines as price falls and so the upwards swing may resume about here.
GDX WEEKLY CHART
Click chart to enlarge. Chart courtesy of StockCharts.com.
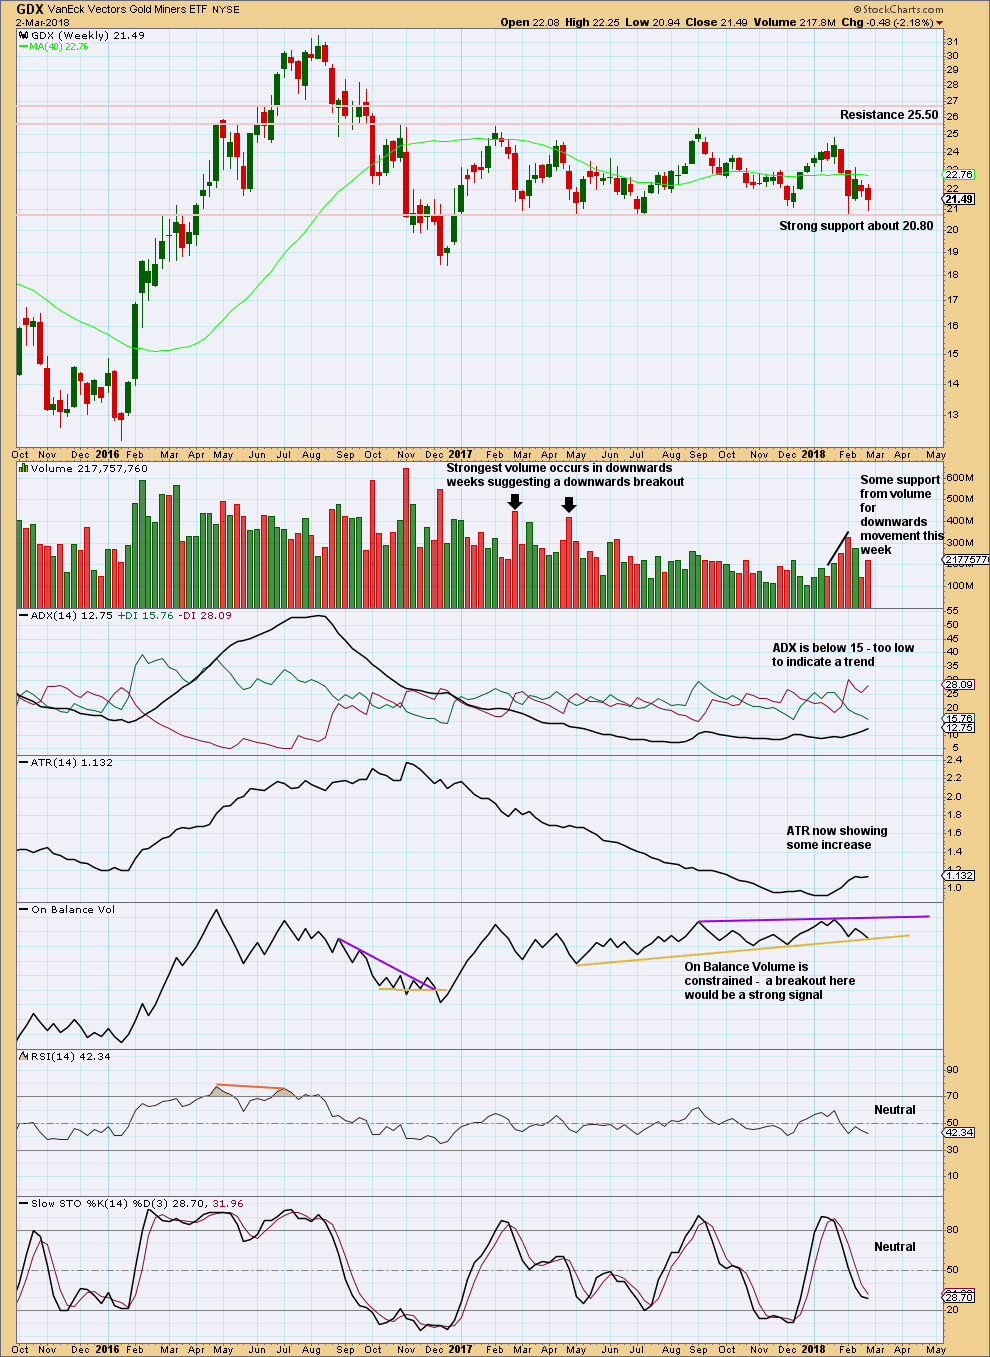
Support about 20.80 has been tested about eight times and so far has held. The more often a support area is tested and holds, the more technical significance it has.
In the first instance, expect this area to continue to provide support. Only a strong downwards day, closing below support and preferably with some increase in volume, would constitute a downwards breakout from the consolidation that GDX has been in for a year now.
Resistance is about 25.50. Only a strong upwards day, closing above resistance and with support from volume, would constitute an upwards breakout.
On Balance Volume should be watched closely. A breakout there may signal the breakout direction for price.
With price now again almost at support and On Balance Volume last week at support, it seems reasonable to expect an upwards swing now for GDX to resistance.
GDX DAILY CHART
Click chart to enlarge. Chart courtesy of StockCharts.com.
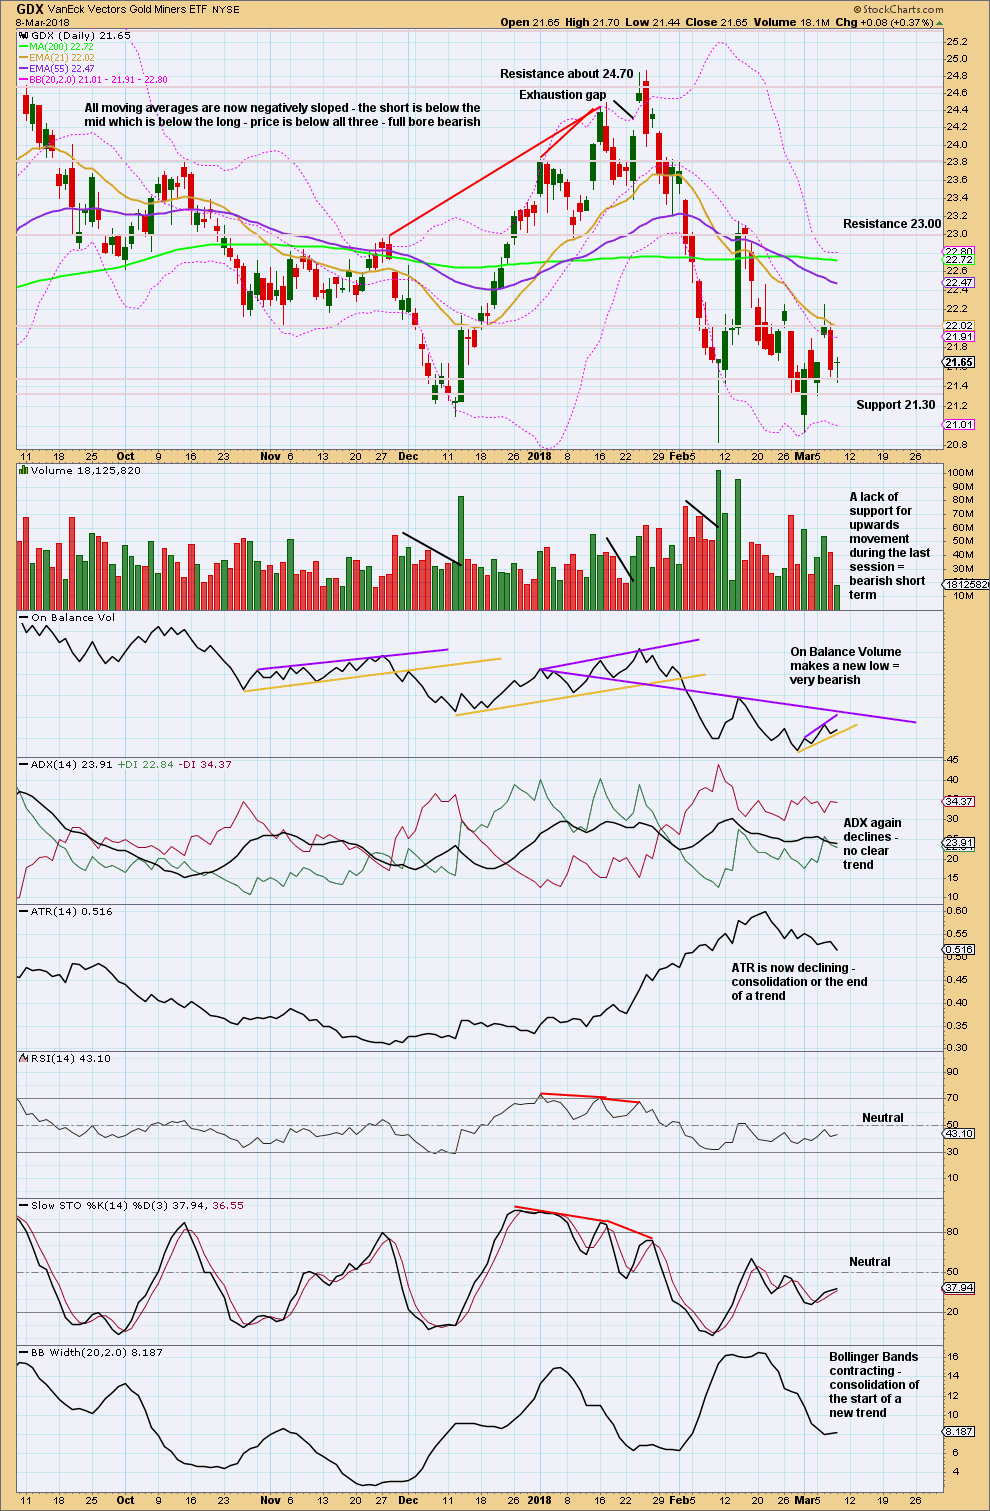
Price has bounced up strongly just above support about 20.85. The short term volume profile remains bullish. The strong Bullish Engulfing reversal pattern at the last low still supports the idea of an upwards swing here.
Today’s candlestick moved price lower, but the balance of volume was upwards and the candlestick closed green. Upwards movement during the session does not have support from volume. The doji represents indecision. This may be a pause before a little more downwards movement towards support.
First resistance about 22.00. Next resistance about 23.00.
Published @ 06:33 p.m. EST.
Updated hourly chart:
The channel about the last wave down is breached by upwards movement. Today’s candlestick looks like it will have a long lower wick, bullish, and will close green.
Gold formed inverse HnS in 4 hour period. NL at 1340.
Once gold clears 1340 Lara’s target will be the next target.
Good weekend all.
Waiting for confirmation with reclaim of 50 day MA next session. A close above 125.99 Monday triggers a long trade for me. Have a great weekend everyone! 🙂
ii can retrace lower that 2?
Yes.
The rule for subminuette ii is that it may not move beyond the start of subminuette i.
It has nothing to do with micro wave 2 within submineutte wave i.