
For reference to the S&P500 wave structure at January 2018.
ANALYSIS OF A PRIOR CYCLE DEGREE FIFTH WAVE
Click chart to enlarge. Chart courtesy of StockCharts.com.
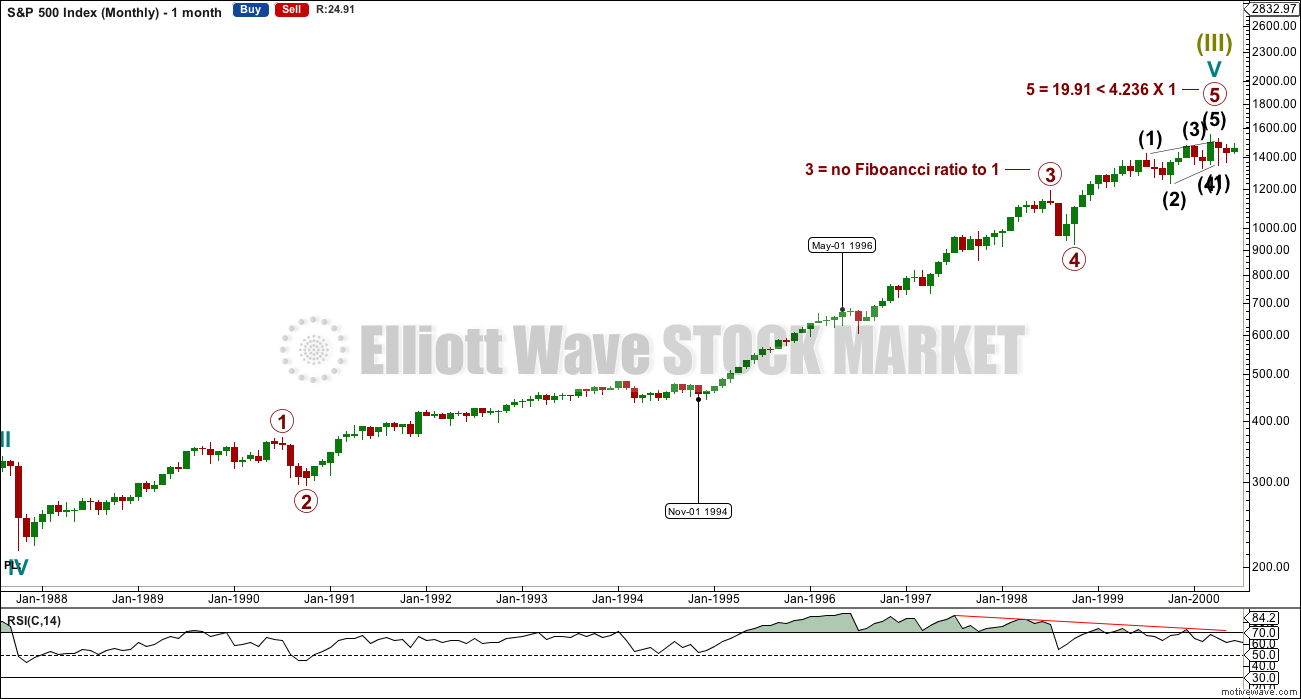
This monthly chart shows a possible wave count for the last cycle degree fifth wave within the Grand Super Cycle analysis.
If this historic and the current wave counts are both correct, then the equivalent position for January 2018 would be towards the end of the segment delineated by dates December 1994 to May 1996.
The technical analysis chart below looks at this portion of the wave.
Click chart to enlarge. Chart courtesy of StockCharts.com.
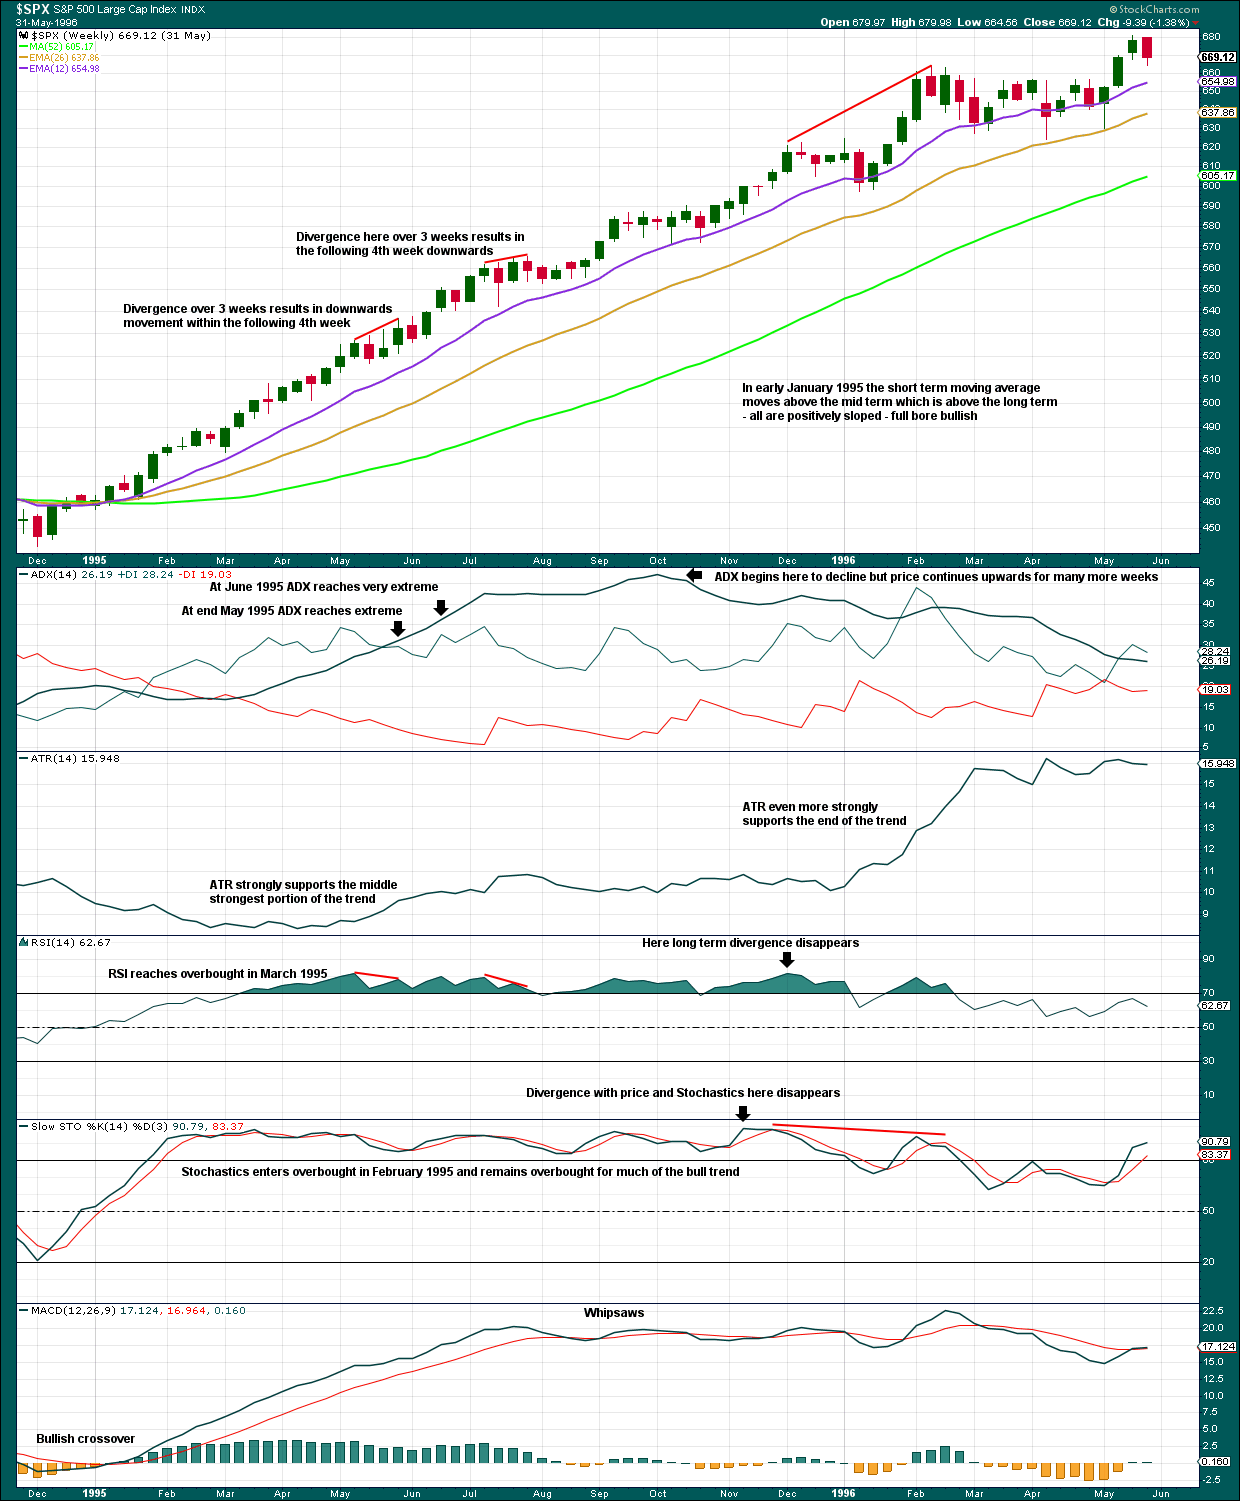
The purpose of this exercise is to see how regularly used indicators behaved in a market which may be a reasonably close equivalent to the current market.
First, it should be noted that on this weekly chart the longest duration for a pullback from an all time high is two weeks. This does look somewhat similar to the current market conditions.
Divergence between RSI and price and Stochastics and price was not always reliable. Sometimes it simply disappeared.
ADX may remain very extreme for several weeks. ADX may even decline from very extreme yet price may continue higher for many more weeks.
When normal volatility returns, MACD may not be a reliable guide to when to enter and exit a market, as it can whipsaw for many weeks while price may continue overall higher.
Putting this next to the market conditions in January 2018, it seems clear that overbought and extreme conditions have persisted for long periods in the past when the S&P has a strong bull market.
Published @ 09:51 p.m. EST.