
The main hourly wave count expected upwards movement but the target at 1,349 was inadequate.
Specific trading advice is given today for GDX, which may have today broken out of a symmetrical triangle structure.
Summary: Today’s session looks strongly like a blow off top. The long upper wick and clear divergence between price and Stochastics is bearish. This supports the idea of a downwards swing from here to support. The target is at 1,306.
The upwards thrust and quick reversal today is a very good example of how a swing within a consolidation can be unpredictable, and can overshoot resistance or support before quickly reversing. This is one reason why trading consolidations has higher risk.
For members who would like to hedge this consolidation, a short position about here may be a very good half of your hedge, along with long positions which were advised to be opened about the last lows. If hedging, then risk only a maximum of 5% in total for both positions combined and always use stops. A short may have a stop just above today’s high.
When price has moved a reasonable distance from each opening point, then stops may be pulled to breakeven to reduce or eliminate risk.
New updates to this analysis are in bold.
Grand SuperCycle analysis is here.
Last in-depth historic analysis with monthly and several weekly charts is here, video is here.
There are multiple wave counts at this time at the weekly and monthly chart levels. In order to make this analysis manageable and accessible only two will be published on a daily basis, one bullish and one bearish. This does not mean the other possibilities may not be correct, only that publication of them all each day is too much to digest. At this stage, they do not diverge from the two possibilities below.
BULLISH ELLIOTT WAVE COUNT
FIRST WEEKLY CHART
Click chart to enlarge.
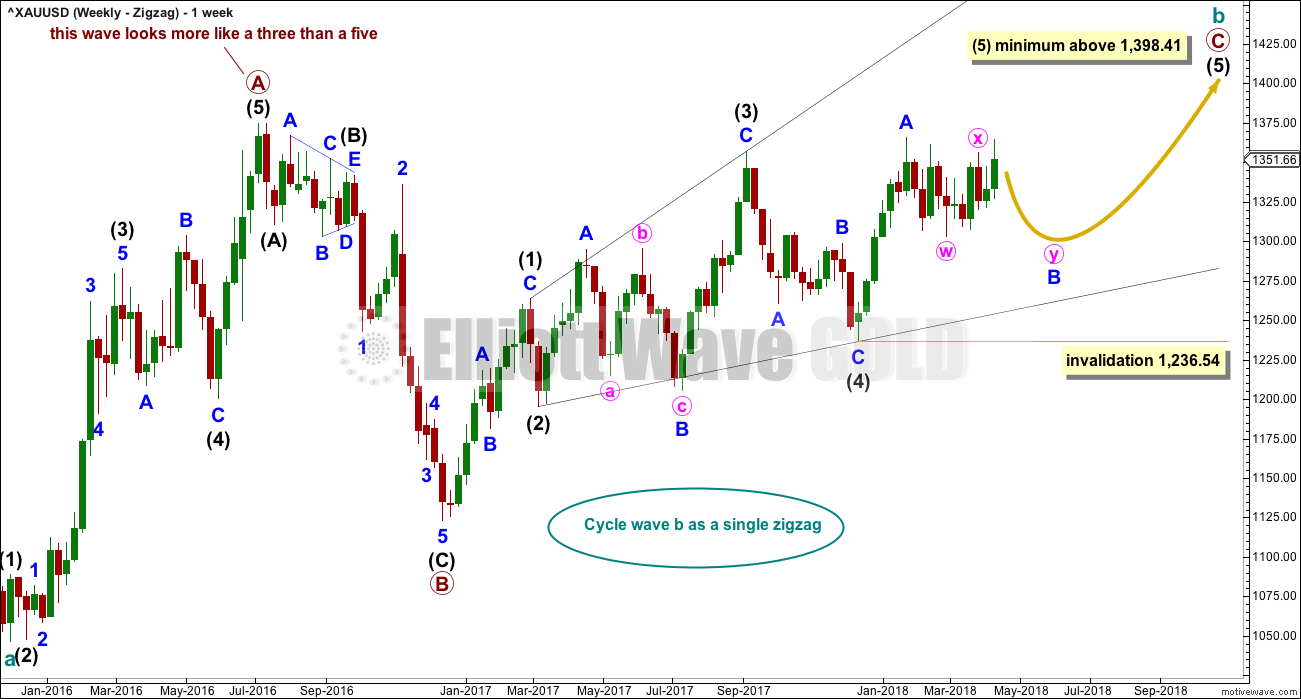
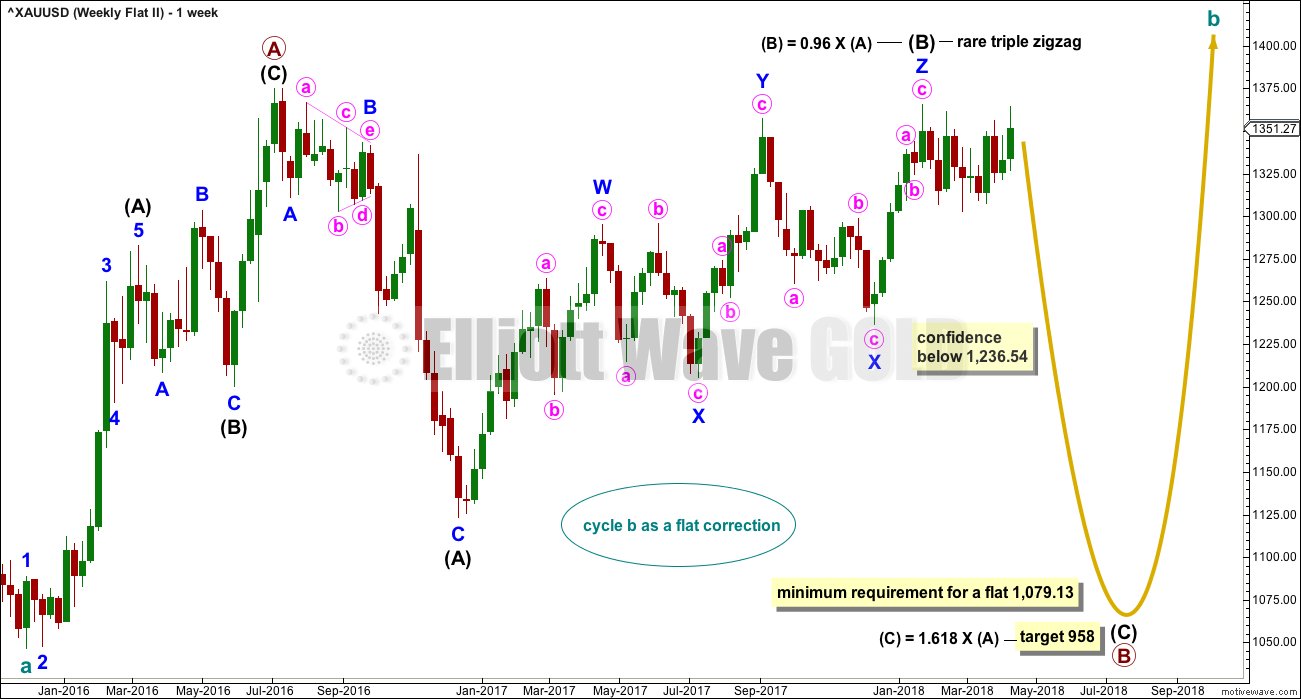
Cycle wave b may be a single zigzag. Zigzags subdivide 5-3-5. Primary wave C must subdivide as a five wave structure and may be either an impulse or an ending diagonal. Overlapping at this stage indicates an ending diagonal.
Within an ending diagonal, all sub-waves must subdivide as zigzags. Intermediate wave (4) must overlap into intermediate wave (1) price territory. This diagonal is expanding: intermediate wave (3) is longer than intermediate wave (1) and intermediate wave (4) is longer than intermediate wave (2). Intermediate wave (5) must be longer than intermediate wave (3), so it must end above 1,398.41 where it would reach equality in length with intermediate wave (3).
Within the final zigzag of intermediate wave (5), minor wave B may not move beyond the start of minor wave A below 1,236.54.
Within the diagonal of primary wave C, each sub-wave is extending in price and so may also do so in time. Within each zigzag, minor wave B may exhibit alternation in structure and may show an increased duration.
Within intermediate wave (1), minor wave B was a triangle lasting 11 days. Within intermediate wave (3), minor wave B was a regular flat lasting 60 days. Within intermediate wave (5), minor wave B may last as long as 40 to 60 days. So far it has lasted 54 days (refer to daily chart) and the structure is incomplete.
At this stage, minor wave B may now be a double flat or triangle. These two ideas are separated out in daily and hourly charts below.
This first weekly chart sees the upwards wave labelled primary wave A as a five wave structure. It must be acknowledged that this upwards wave looks better as a three than it does as a five. The fifth weekly chart below will consider the possibility that it was a three.
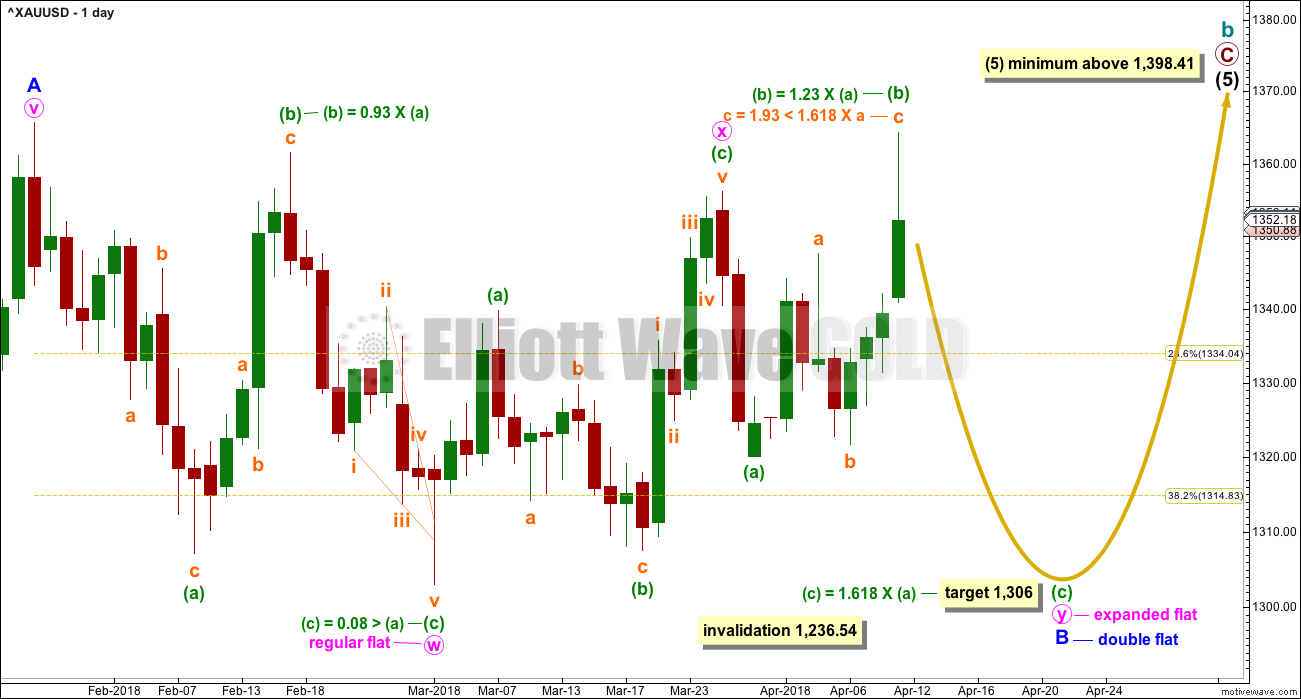
FIRST DAILY CHART – DOUBLE FLAT
Click chart to enlarge.
A new high today above 1,356.12 indicates minute wave y may not be a zigzag and instead may be an expanded flat correction. This indicates minor wave B may be a relatively rare double flat correction.
Within this possible double flat, the first flat labelled minute wave w is a regular flat. The second flat labeled minute wave y may be an expanded flat, providing alternation with the first.
Within the expanded flat of minute wave y, minuette wave (b) is within the common range of from 1 to 1.38 times the length of minuette wave (a). The most common Fibonacci ratio for minuette wave (c) is used to calculate a target for it to end.
The target would see minute wave y end close to the same level as minute wave w; the double flat would have a sideways look and achieve its purpose of taking up time and moving sideways. This target is also within a strong area of support.
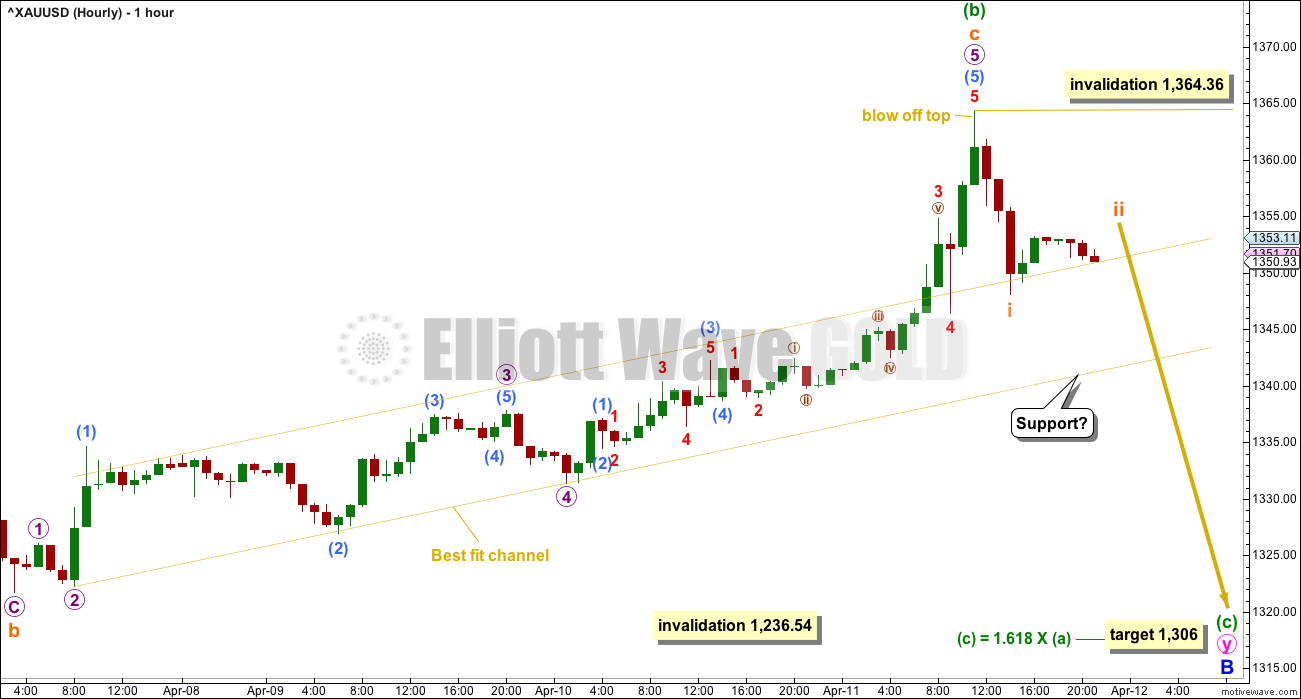
HOURLY CHART – DOUBLE FLAT
Click chart to enlarge.
Subminuette wave c must subdivide as a five wave structure. It is possible at this stage that it is complete, ending in a blow off top. Within this impulse, the final fifth wave of micro wave 5 may have ended as a very swift and strong fifth wave. This is typical behaviour of commodities, although it is more common to end third waves than it is to end C waves.
Minuette wave (c) must subdivide as a five wave structure, and within it subminuette wave ii may not move beyond the start of subminuette wave i above 1,364.36.
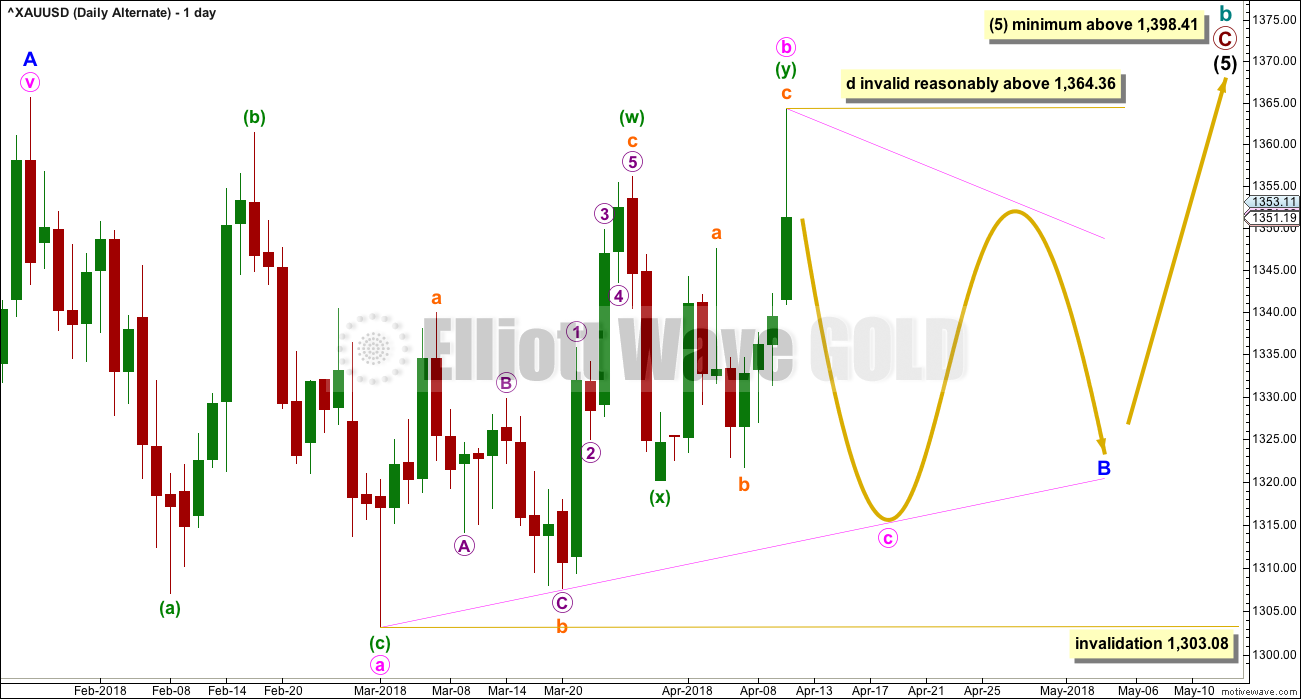
SECOND DAILY CHART – TRIANGLE
Click chart to enlarge.
This alternate daily chart is identical to the first daily chart up to the high labelled minor wave A. Thereafter, it looks at a different structure for minor wave B.
With some adjustment today, a triangle for minor wave B may still be valid. Within a triangle, four of the five sub-waves must sub-divide as zigzags and one sub-wave usually subdivides as a double zigzag; the double zigzag is most commonly wave C of the triangle, but it may be any sub-wave. Here, it may have been minute wave b.
All remaining triangles must be simple A-B-C structures, most likely zigzags.
Minute wave c may not move beyond the end of minute wave a below 1,303.08 for both a contracting or barrier triangle. Thereafter, minute wave d may not move above the end of minute wave b at 1,364.36 for a contracting triangle. For a barrier triangle, minute wave d may end about the same level as minute wave b in order for the b-d trend line to look essentially flat.
A final small zigzag downwards for minute wave e would most likely fall short of the a-c trend line.
This wave count still allows for choppy overlapping movement in an ever decreasing range for several weeks. Minor wave B may be as long lasting as a Fibonacci 21 weeks if it is a triangle, as triangles do tend to be very long lasting structures.
BEARISH ELLIOTT WAVE COUNT
FIFTH WEEKLY CHART
Click chart to enlarge.
There were five weekly charts published in the last historic analysis. This fifth weekly chart is the most immediately bearish wave count, so this is published as a bearish possibility.
This fifth weekly chart sees cycle wave b as a flat correction, and within it intermediate wave (B) may be a complete triple zigzag. This would indicate a regular flat as intermediate wave (B) is less than 1.05 the length of intermediate wave (A).
If cycle wave b is a flat correction, then within it primary wave B must retrace a minimum 0.9 length of primary wave A at 1,079.13 or below. The most common length of B waves within flats is from 1 to 1.38 times the length of the A wave. The target calculated would see primary wave B end within this range.
I have only seen two triple zigzags before during my 10 years of daily Elliott wave analysis. If this wave count turns out to be correct, this would be the third. The rarity of this structure is identified on the chart.
FIFTH DAILY CHART
Click chart to enlarge.
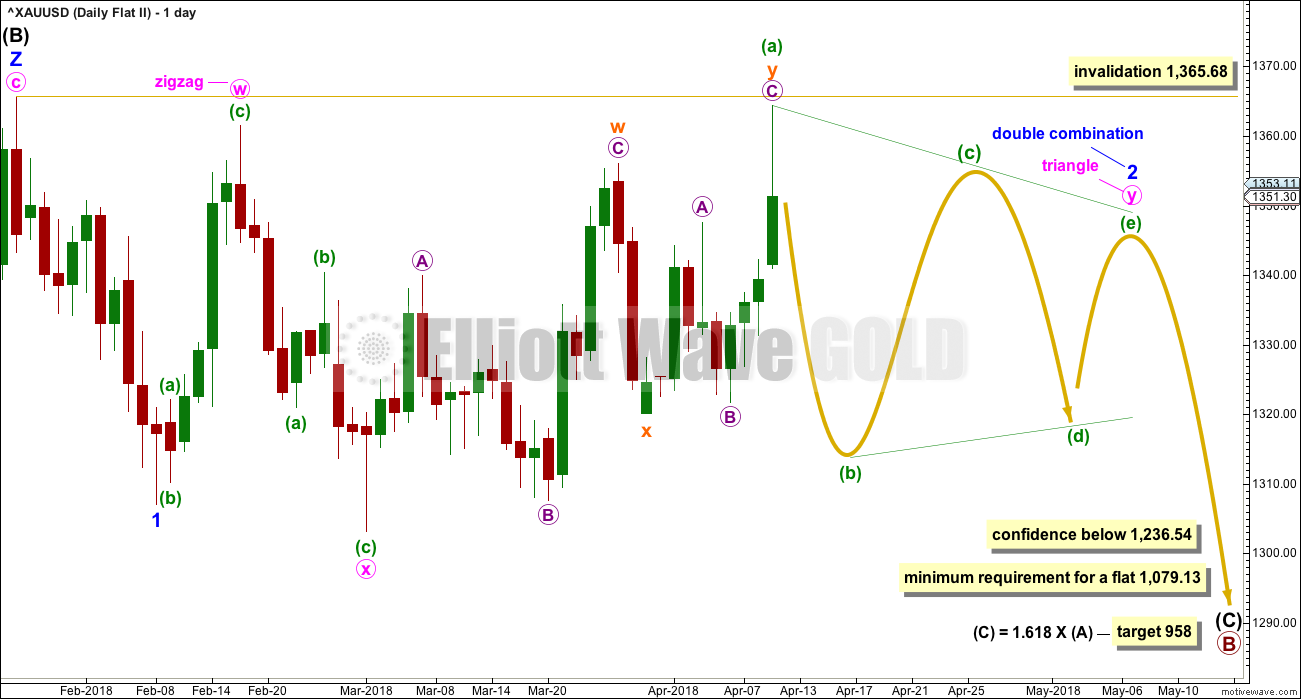
Minor wave 1 may have been a relatively brief impulse over at the low of the 8th of February. Thereafter, minor wave 2 may be an incomplete double combination.
The first structure in the double may be a zigzag labelled minute wave w. The double may be joined by a three in the opposite direction, a zigzag labelled minute wave x. The second structure in the double may be an incomplete triangle labelled minute wave y. This structure may yet take some weeks to complete. In my experience a double combination with a triangle for minute wave y is not very common. This reduces the probability of this wave count, but it remains valid.
This wave count is a good solution for this bearish wave count. All subdivisions fit and there are no rare structures so far within intermediate wave (C).
TECHNICAL ANALYSIS
WEEKLY CHART
Click chart to enlarge. Chart courtesy of StockCharts.com.
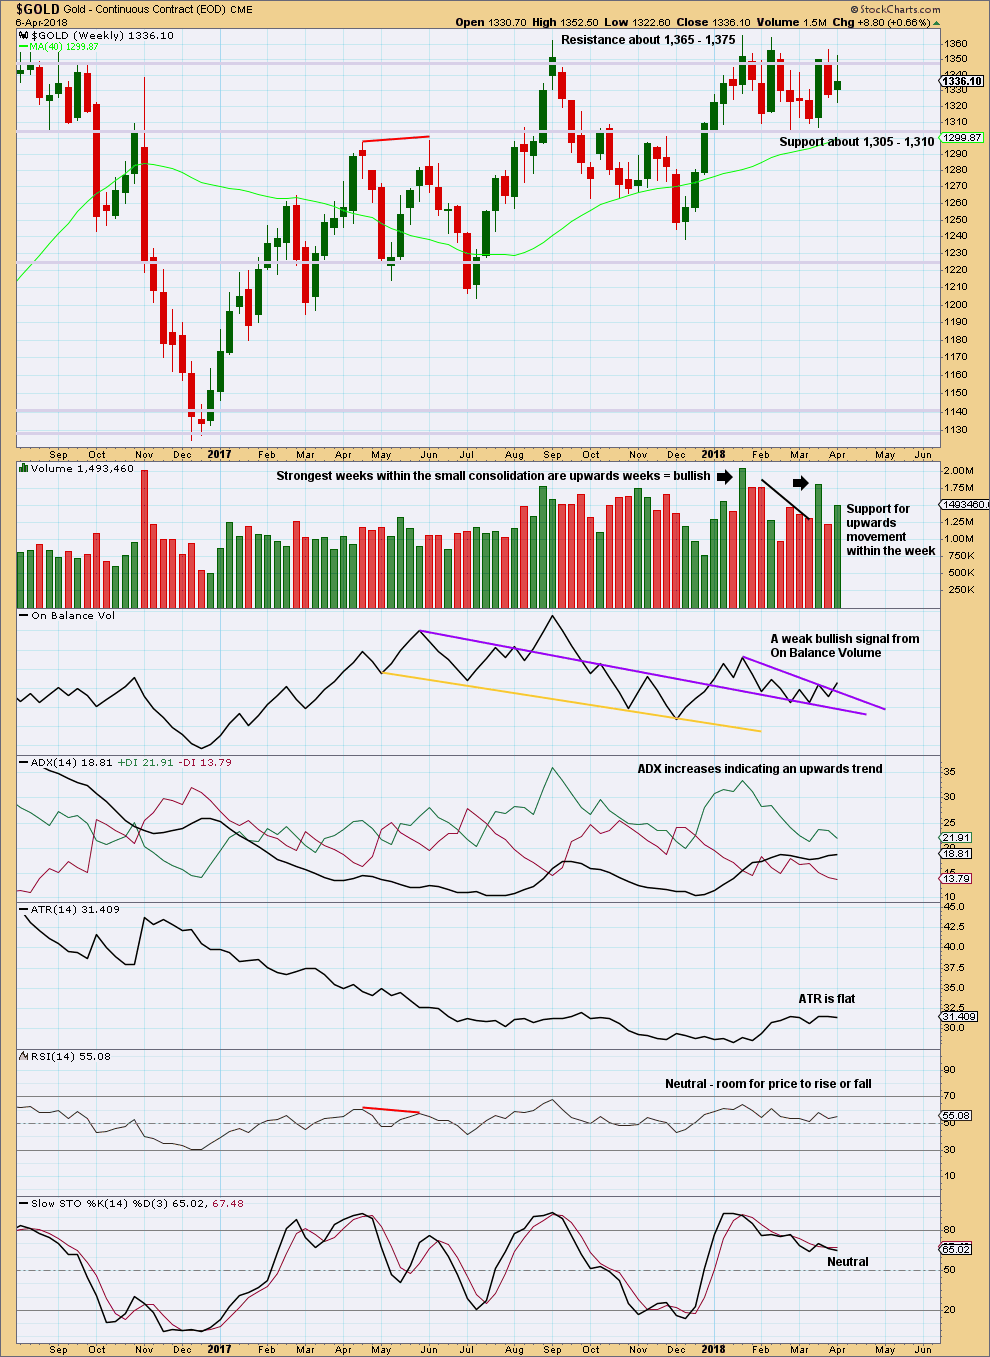
Gold is within a small consolidation with resistance about 1,365 to (final) 1,375 and strong support about 1,310 to 1,305. Volume suggests an upwards breakout is more likely than downwards.
The bullish signal this week from On Balance Volume is weak because the purple line, which has been breached, has a reasonable slope and was only tested twice prior.
DAILY CHART
Click chart to enlarge. Chart courtesy of StockCharts.com.
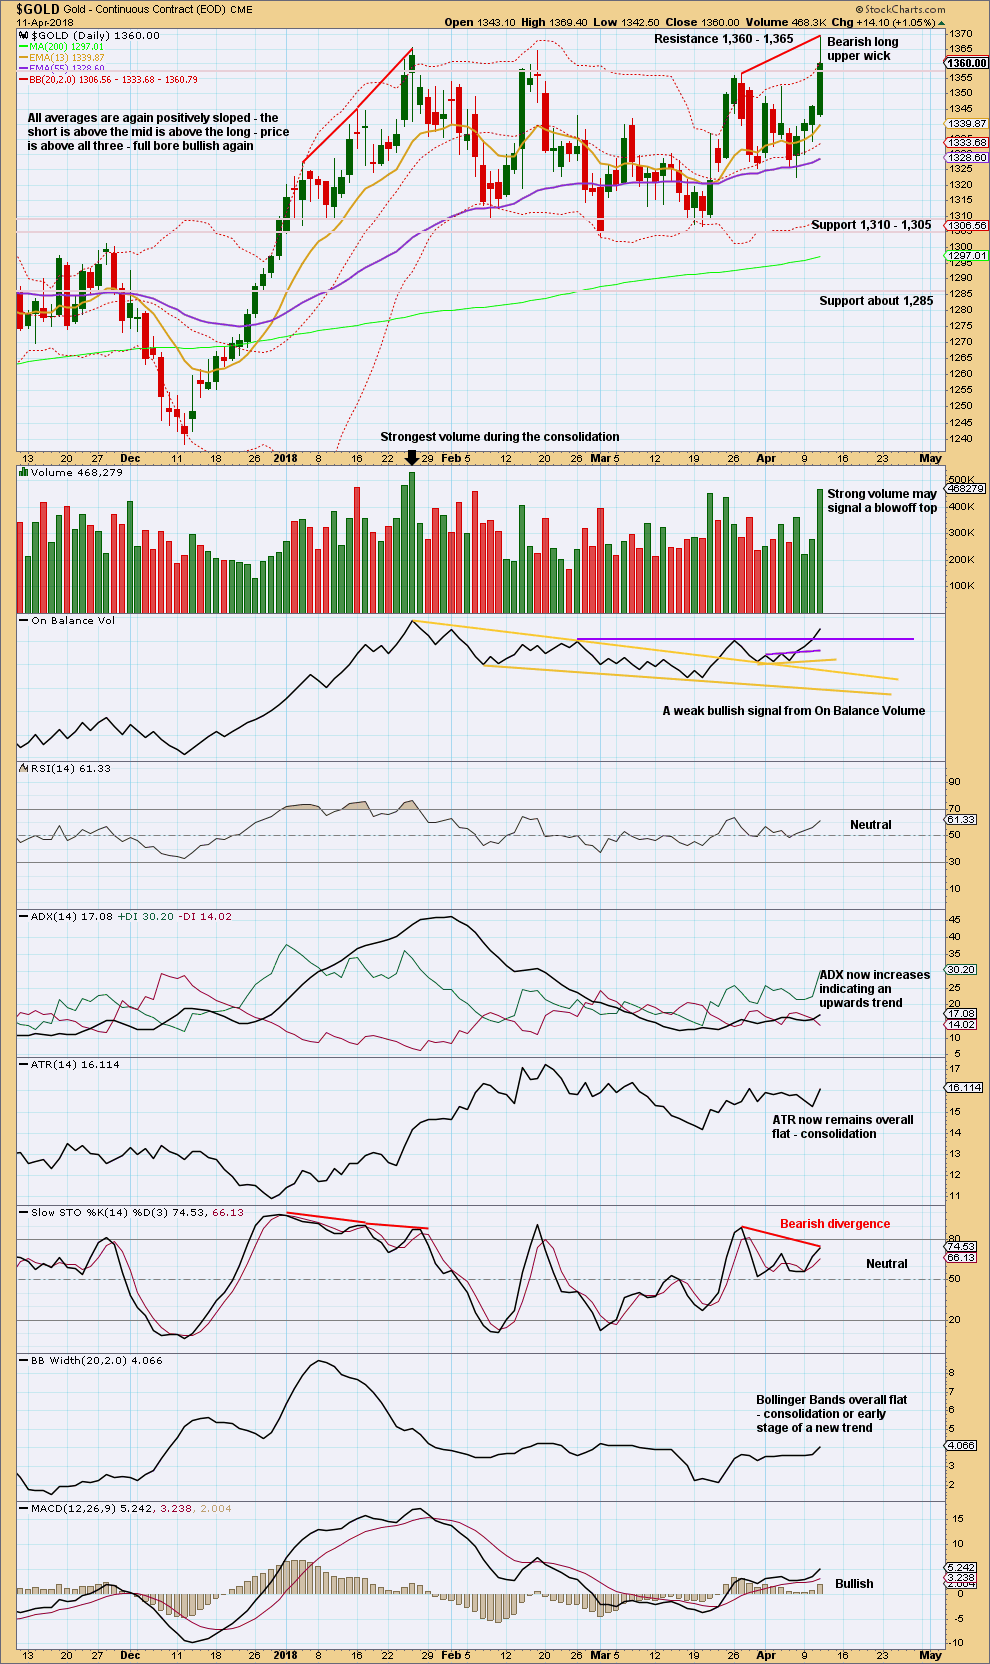
Gold is within a smaller consolidation that began back on about the 3rd of January. This consolidation is delineated by resistance about 1,360 to 1,365 and support about 1,310 to 1,305. It is the upwards day of the 15th of January that has strongest volume during this consolidation. This suggests an upwards breakout may be more likely than downwards.
The long upper wick today has found final resistance at 1,370. This looks like a blow off top, so expect a downwards reaction. This expectation may be reinforced by bearish divergence between price and Stochastics at today’s high.
The signal from On Balance Volume is only weak because the trend line breached only has two anchor points. However, it is reasonably long held and close to horizontal. Look for this line to possibly provide support.
GDX WEEKLY CHART
Click chart to enlarge. Chart courtesy of StockCharts.com.
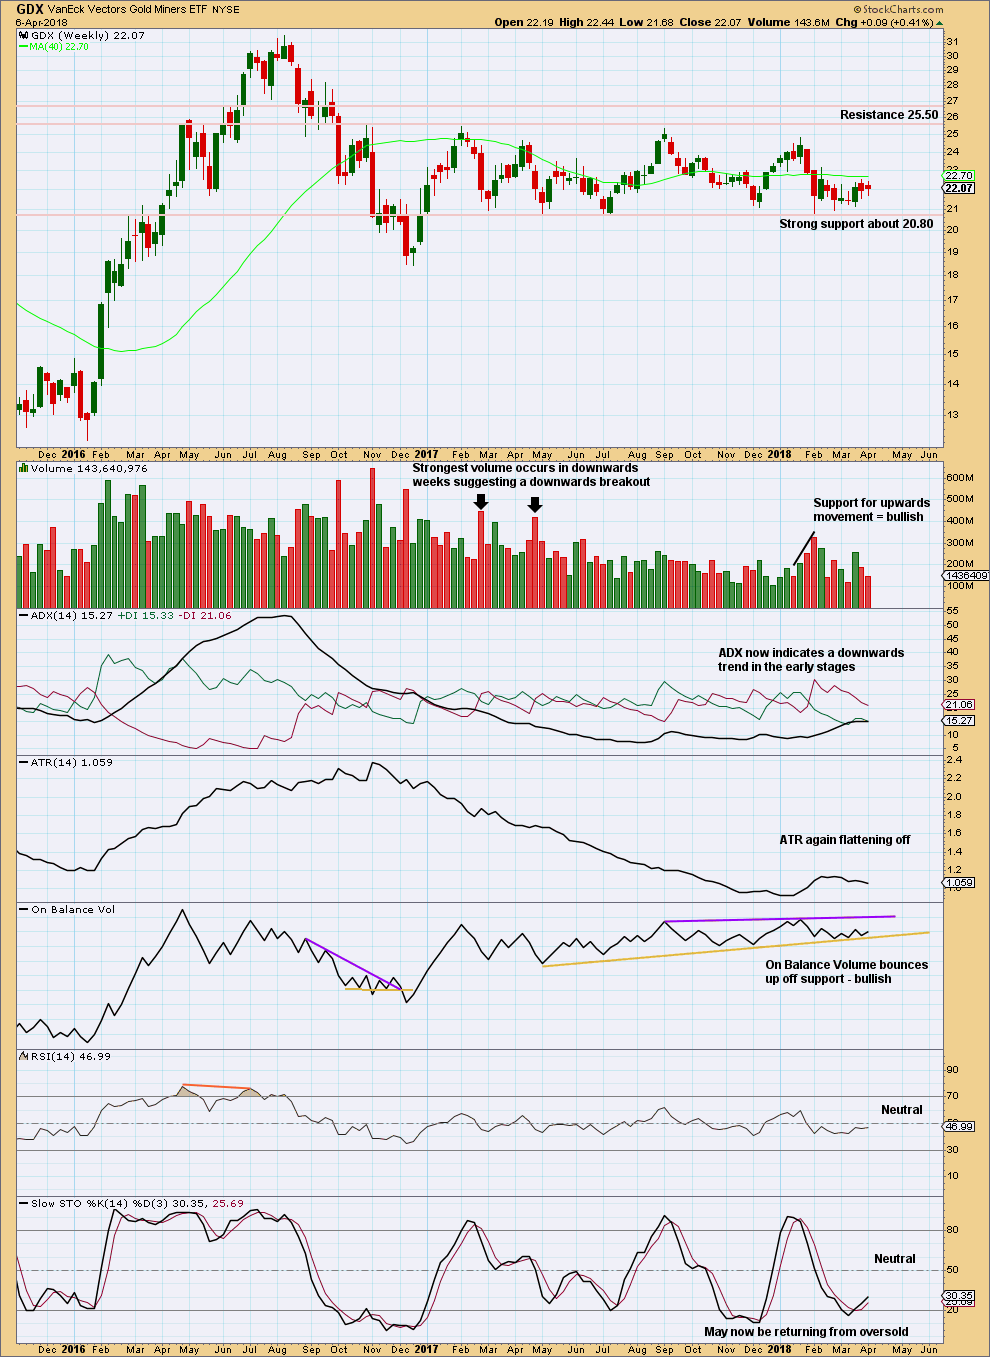
Support about 20.80 has been tested about eight times and so far has held. The more often a support area is tested and holds, the more technical significance it has.
In the first instance, expect this area to continue to provide support. Only a strong downwards day, closing below support and preferably with some increase in volume, would constitute a downwards breakout from the consolidation that GDX has been in for a year now.
Resistance is about 25.50. Only a strong upwards day, closing above resistance and with support from volume, would constitute an upwards breakout.
The last week closes with the balance of volume upwards, and it shows a decline. This is contradicted by a bullish signal from On Balance Volume last week as it bounces up off support.
GDX DAILY CHART
Click chart to enlarge. Chart courtesy of StockCharts.com.
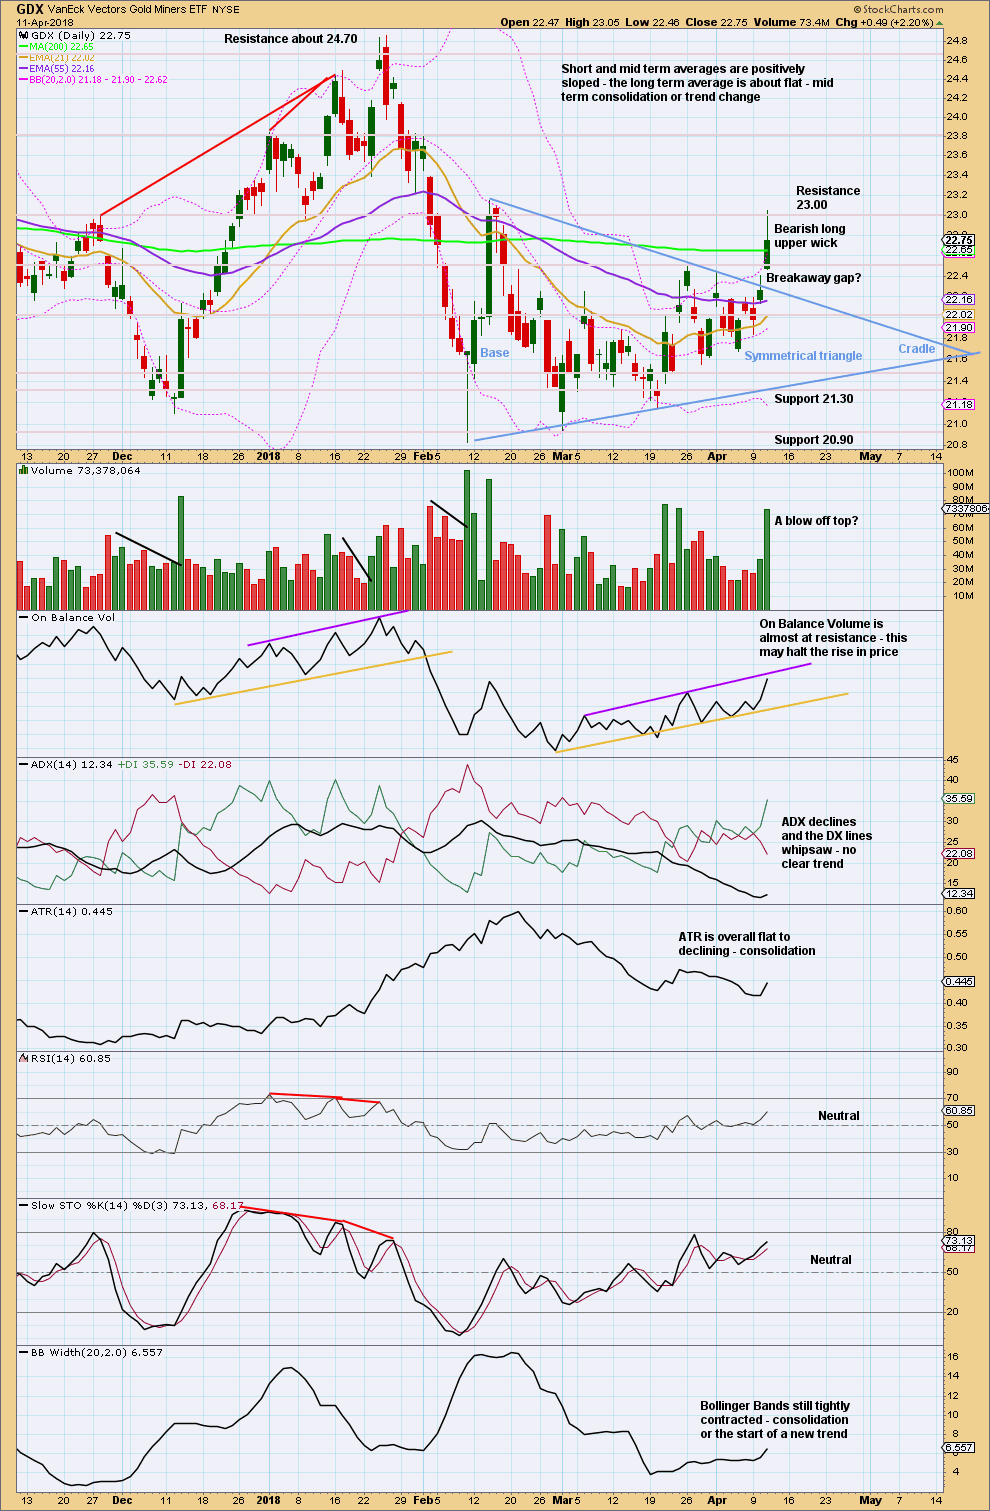
GDX has broken above the symmetrical triangle structure on an upwards day with good support from volume. The long upper wick and very strong volume suggest a downwards reaction from here.
On trading triangles from Dhalquist and Kirkpatrick, page 319:
“The ideal situation for trading triangles is a definite breakout, a high trading range within the triangle, an upward-sloping volume trend during the formation of the triangle, and especially a gap on the breakout. These patterns seem to work better with small-cap stocks in a rising market.
Although triangles are plentiful, their patterns suffer from many false and premature breakouts. This requires that a very strict breakout rule be used, either a wide filter or a number of closes outside the breakout zone. It also requires a close protective stop at the breakout level in case the breakout is false. Once these defensive levels have been exceeded, and price is on its way, the trader can relax for a little while because the failure rate after a legitimate breakout is relatively low. Trailing stops should then be placed at each preceding minor reversal.
…. in symmetrical triangles, the best performance comes from late breakouts in the 73% – 75% distance.
Volume on the breakout seems more desirable in symmetrical triangles.”
In this case, the breakout has come 61% of the triangle length from base to cradle. Volume towards the end of the triangle declined. The breakout is accompanied by a gap and has good support from volume.
Pullbacks occur 59% of the time for symmetrical triangles, and today’s long upper wick strongly suggests a pullback here.
Any long positions entered on a pullback may use the breakaway gap as a place for stops just below 22.41. If that gap is closed, then it may be an exhaustion gap and the breakout may have failed.
A profit target is calculated by adding the triangle width to the breakout point. This gives a target at 24.61.
Published @ 10:42 p.m. EST.
I’m also very excited to see some long term members sign up for my new Lara’s Weekly service. Thank you all very much for your support and confidence in my work!
I’m very excited at the prospect of a breakout from this consolidation. It’s been hard to analyse, hard to trade, and just a grinding bore really.
I’ll be spending some time today with the TA chart to really try and see it with fresh eyes. If that’s even possible. Going back to TA basics and trying to see which direction the breakout is most likely…. considering any bias I may have, suspending judgement.
The invalidation point may now be moved down. Use the best fit channel. It may provide support… or the power of a third wave down may breach it. The upper edge should provide resistance for any bounces along the way down.
I’d expect the target to be reached in a day or two.
And then… this B wave at minor degree which has lasted nearly 3 months could be over finally!