
Downwards movement continues as expected, which is choppy and overlapping, which was also expected.
Summary: Expect this downwards swing to continue to support, which is at about 1,310 to 1,305. The target is at 1,312, which is now just above the support zone. Do not expect this downwards swing to move in a straight line, because that is not how price behaves within a consolidation.
Only the most experienced of traders should attempt to trade when price is clearly consolidating as it currently is for Gold and GDX. The rest should either hedge or wait for a breakout and trade the next trend. Always use stops and invest only 1-5% of equity on any one trade.
New updates to this analysis are in bold.
Grand SuperCycle analysis is here.
Last in-depth historic analysis with monthly and several weekly charts is here, video is here.
There are multiple wave counts at this time at the weekly and monthly chart levels. In order to make this analysis manageable and accessible only two will be published on a daily basis, one bullish and one bearish. This does not mean the other possibilities may not be correct, only that publication of them all each day is too much to digest. At this stage, they do not diverge from the two possibilities below.
BULLISH ELLIOTT WAVE COUNT
FIRST WEEKLY CHART
Click chart to enlarge.
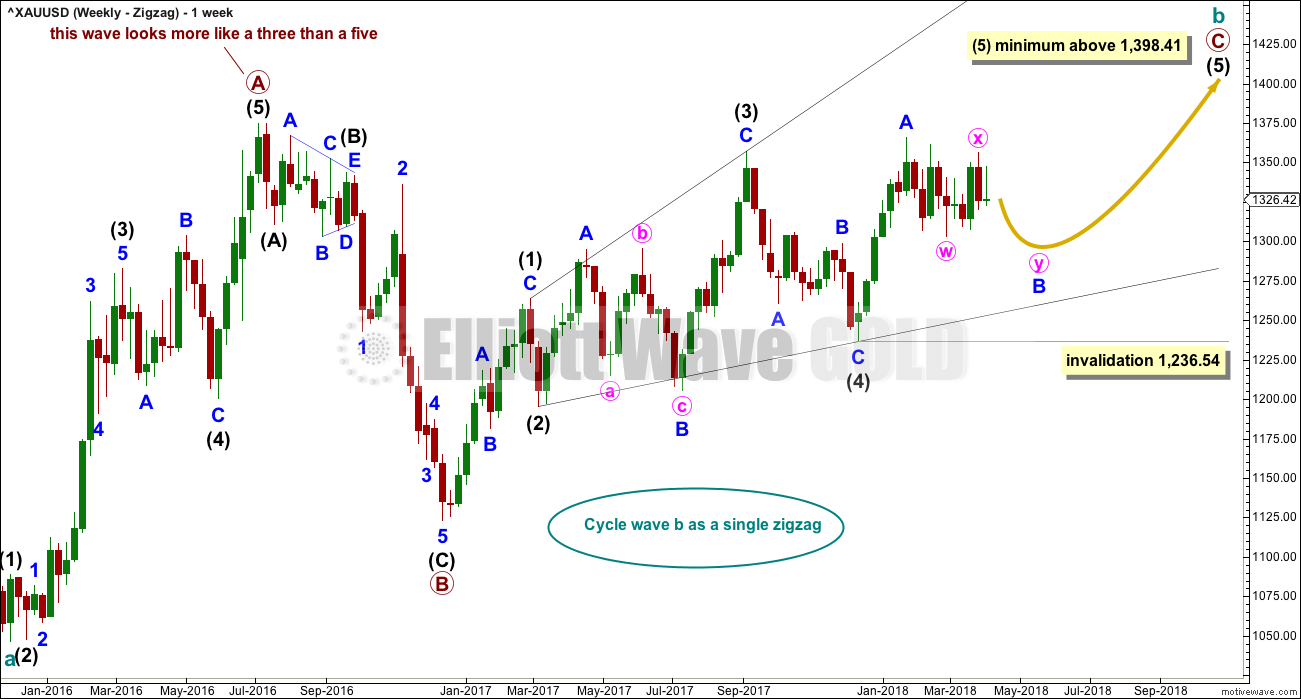
Cycle wave b may be a single zigzag. Zigzags subdivide 5-3-5. Primary wave C must subdivide as a five wave structure and may be either an impulse or an ending diagonal. Overlapping at this stage indicates an ending diagonal.
Within an ending diagonal, all sub-waves must subdivide as zigzags. Intermediate wave (4) must overlap into intermediate wave (1) price territory. This diagonal is expanding: intermediate wave (3) is longer than intermediate wave (1) and intermediate wave (4) is longer than intermediate wave (2). Intermediate wave (5) must be longer than intermediate wave (3), so it must end above 1,398.41 where it would reach equality in length with intermediate wave (3).
Within the final zigzag of intermediate wave (5), minor wave B may not move beyond the start of minor wave A below 1,236.54.
Within the diagonal of primary wave C, each sub-wave is extending in price and so may also do so in time. Within each zigzag, minor wave B may exhibit alternation in structure and may show an increased duration.
Within intermediate wave (1), minor wave B was a triangle lasting 11 days. Within intermediate wave (3), minor wave B was a regular flat lasting 60 days. Within intermediate wave (5), minor wave B may last as long as 40 to 60 days. So far it has lasted 50 days (refer to daily chart) and the structure is incomplete.
At this stage, minor wave B may now be a combination or triangle. These two ideas are separated out in daily and hourly charts below.
This first weekly chart sees the upwards wave labelled primary wave A as a five wave structure. It must be acknowledged that this upwards wave looks better as a three than it does as a five. The fifth weekly chart below will consider the possibility that it was a three.
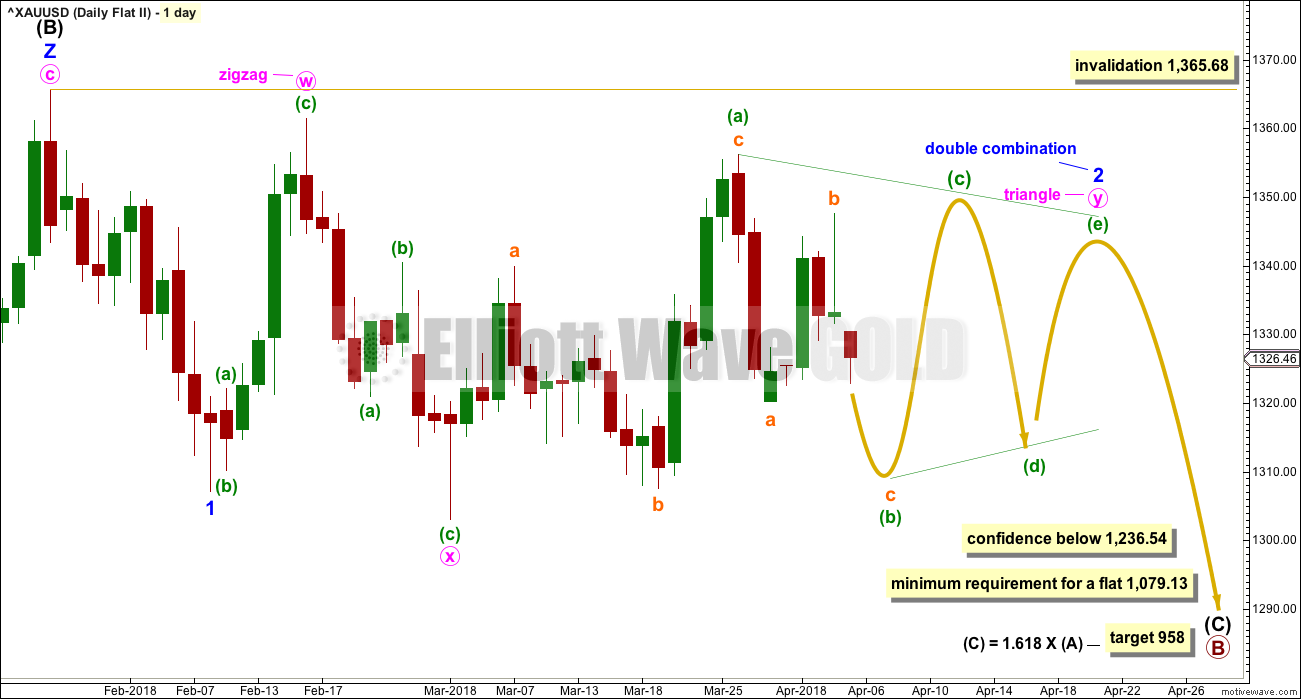
FIRST DAILY CHART – COMBINATION
Click chart to enlarge.
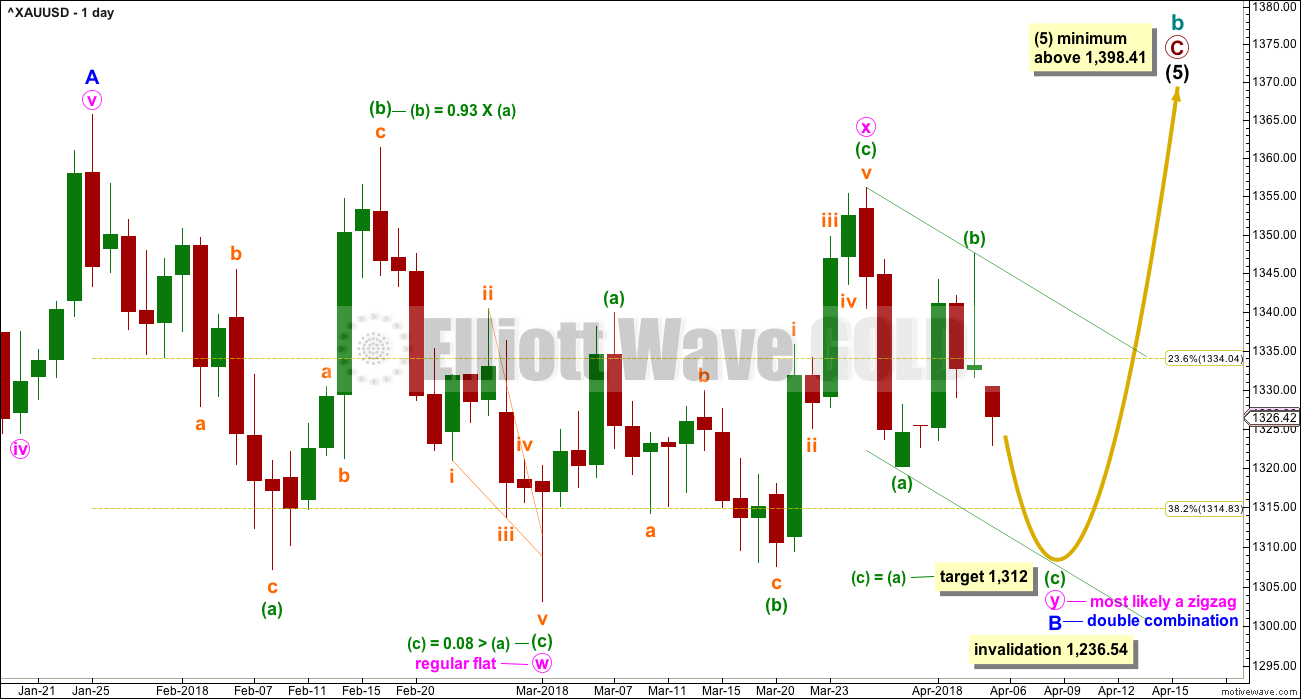
Minor wave B may be a double combination. Double combinations are very common structures. The first structure in the double may have been a regular flat correction labelled minute wave w.
The double is joined by a three in the opposite direction, a zigzag labelled minute wave x.
The second structure in the double may be a zigzag labelled minute wave y. It would most likely end about the same level as minute wave w, at about 1,303.08, so that the whole structure takes up time and moves price sideways. That is the purpose of double combinations. The target would see minute wave y end somewhat above minute wave w and give the combination a typical sideways look.
Minute wave y as a zigzag now looks like an obvious three wave structure at the daily chart level.
When minute wave y is a complete zigzag, then the probability of the combination being over would be very high. While double combinations are very common structures, triples are extremely rare.
While minute wave y may also be a flat correction, in my experience double flats are fairly rare.
Minute wave y may also be a triangle but the expected pathway at this stage would be the same as the triangle wave count below, so it will not be separated out. A triangle within a combination is also in my experience uncommon.
FIRST HOURLY CHART – COMBINATION
Click chart to enlarge.
Both wave counts at the daily chart level still expect that a zigzag downwards is unfolding. Both see minuette wave (a) complete at the last low as labelled on the daily chart.
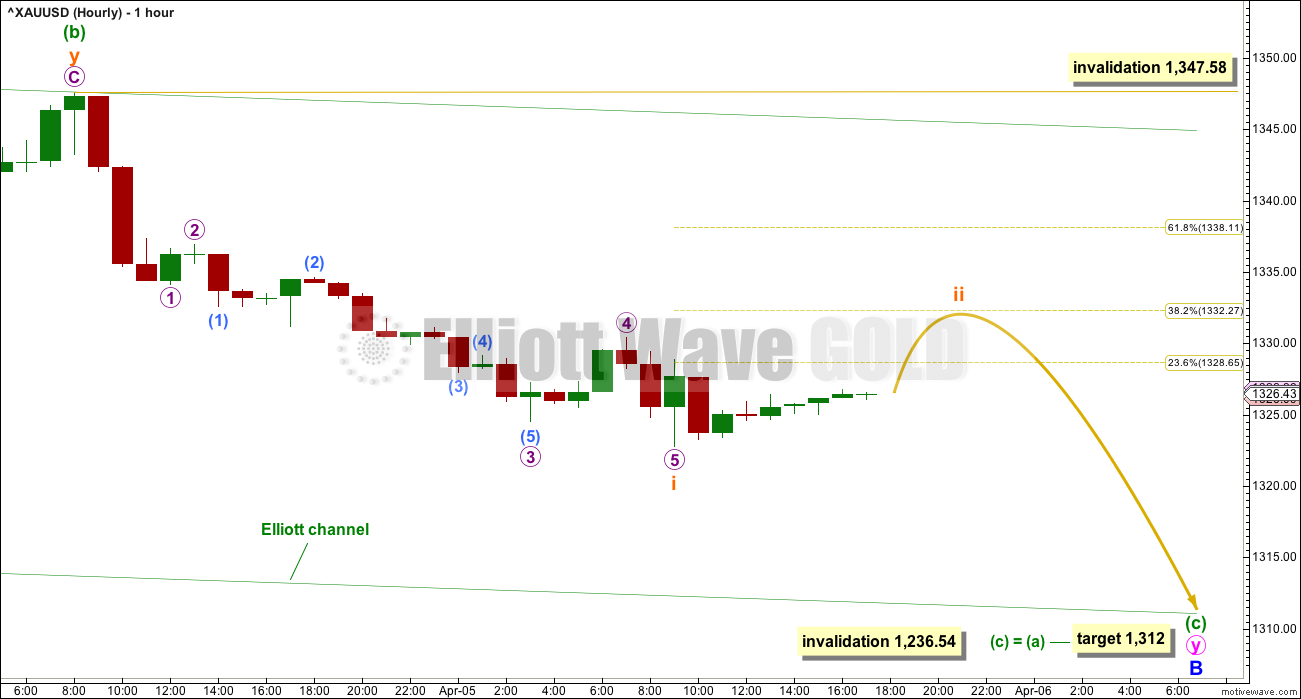
This first hourly chart expects that minuette wave (b) is now also complete. A target is calculated for minuette wave (c) to exhibit the most common Fibonacci ratio to minuette wave (a).
Minuette wave (c) must subdivide as a five wave structure. So far only subminuette wave i may be complete at today’s low. Subminuette wave ii may not move beyond the start of subminuette wave i above 1,347.58.
Subminuette wave ii may correct to either the 0.382 or 0.618 Fibonacci ratios of subminuette wave i.
Minuette wave (c) would be extremely likely to make at least a slight new low below minuette wave (a) at 1,320 to avoid a truncation.
ALTERNATE HOURLY CHART – COMBINATION
Click chart to enlarge.
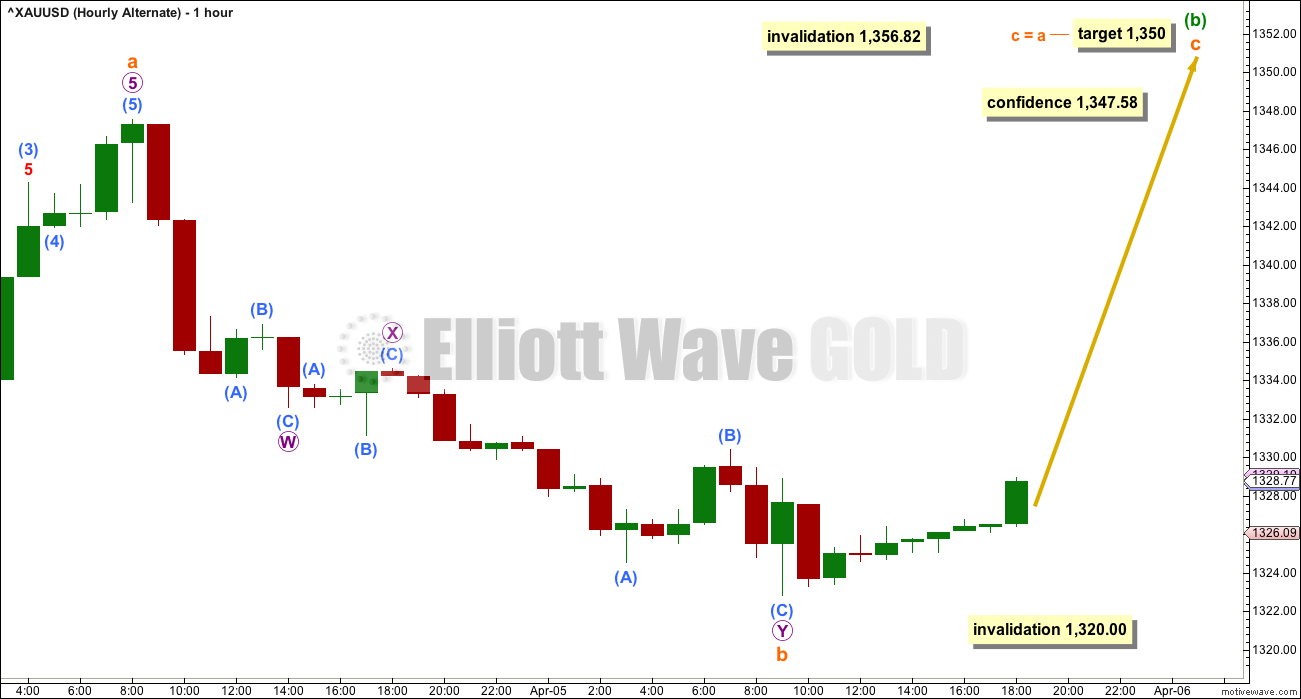
It is also still possible that minuette wave (b) is incomplete. The last wave upwards may be seen as an impulse for subminuette wave a. If subminuette wave a was a five, then subminuette wave b may not move beyond its start below 1,320.00.
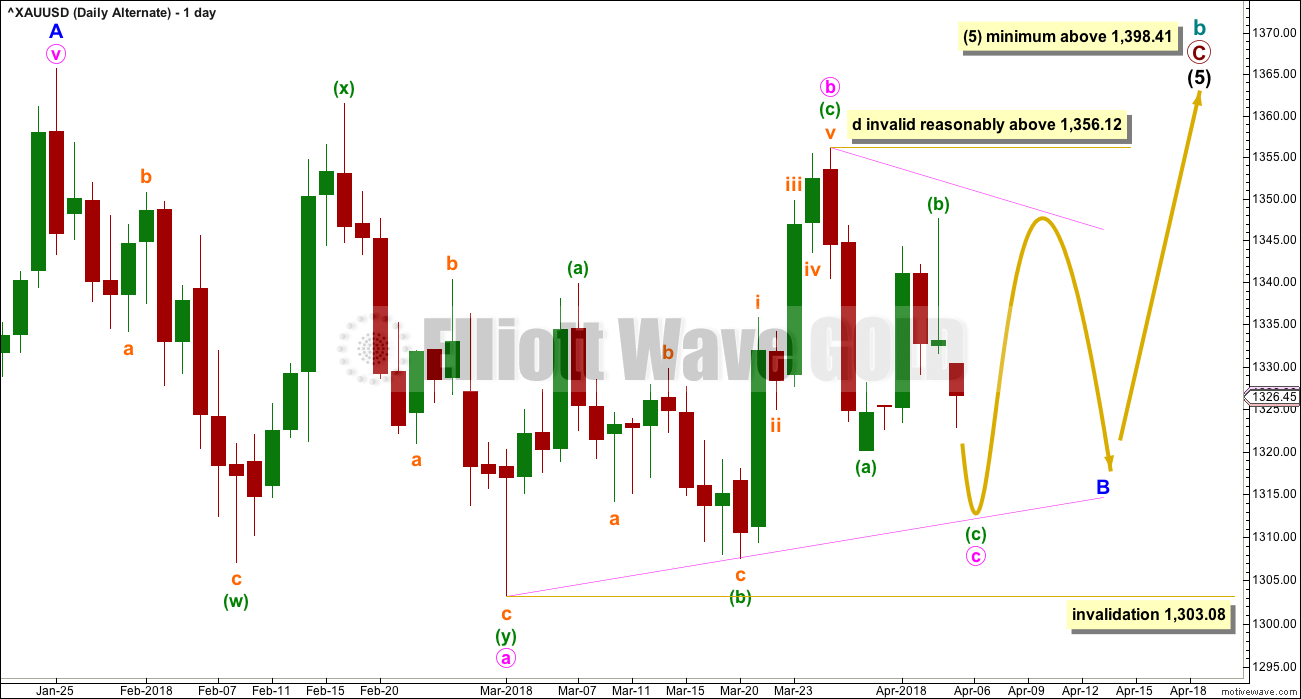
SECOND DAILY CHART – TRIANGLE
Click chart to enlarge.
This alternate daily chart is identical to the first daily chart up to the high labelled minor wave A. Thereafter, it looks at a different structure for minor wave B.
Minor wave B may be an incomplete triangle, and within it minute wave a may have been a double zigzag. All remaining triangle sub-waves must be simple A-B-C structures, and three of the four remaining sub-waves must be simple zigzags. One remaining sub-wave may be a flat correction.
Minute wave b may be unfolding upwards as a single zigzag, and within it minuette wave (b) may not move beyond the start of minuette wave (a) below 1,303.08.
This alternate wave count expects weeks of choppy overlapping movement in an ever decreasing range.
Triangles normally adhere very well to their trend lines. The triangle trend lines are commonly tested within the triangle sub-waves. Minuette wave (b) within minute wave b may have found support at the a-c trend line, and this indicates where minute wave c may end.
Minute wave c of the triangle may not move beyond the end of minute wave a below 1,303.08.
Minute wave d of a contracting triangle may not move beyond the end of minute wave b above 1,356.12. Minute wave d of a barrier triangle should end about the same level as minute wave b; the triangle will remain valid as long as the b-d trend line remains essentially flat. In practice, this means minute wave d can end slightly above 1,356.12. This invalidation point is not black and white; it involves an area of subjectivity.
Contracting triangles are the most common type. Barrier triangles are not common, but nor are they rare.
At the daily chart level, for this wave count it would be extremely likely that the zigzag of minute wave c looks like a three wave structure. At this stage, it shows up as one doji and one green candlestick. This now has a good look.
A separate hourly chart will not be published today for this wave count because it would now be exactly the same as the first wave count. Both wave counts expect a zigzag is unfolding lower, and both hourly charts work for this daily chart also.
BEARISH ELLIOTT WAVE COUNT
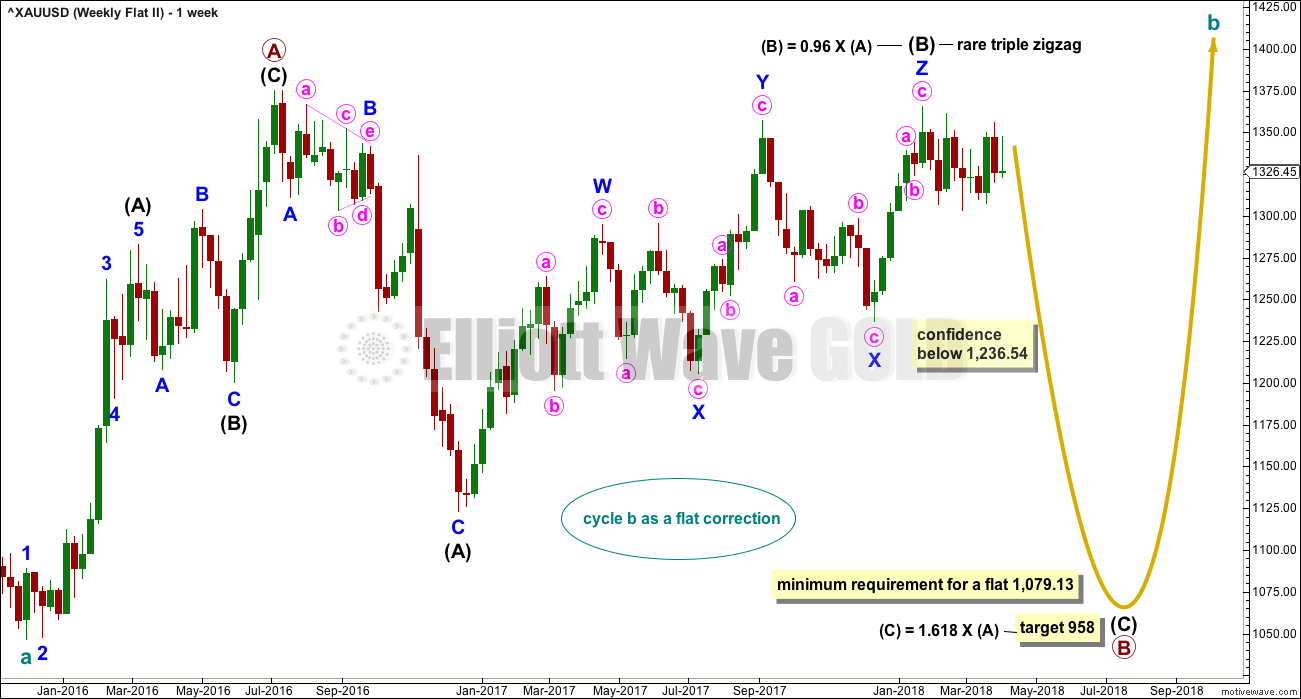
FIFTH WEEKLY CHART
Click chart to enlarge.
There were five weekly charts published in the last historic analysis. This fifth weekly chart is the most immediately bearish wave count, so this is published as a bearish possibility.
This fifth weekly chart sees cycle wave b as a flat correction, and within it intermediate wave (B) may be a complete triple zigzag. This would indicate a regular flat as intermediate wave (B) is less than 1.05 the length of intermediate wave (A).
If cycle wave b is a flat correction, then within it primary wave B must retrace a minimum 0.9 length of primary wave A at 1,079.13 or below. The most common length of B waves within flats is from 1 to 1.38 times the length of the A wave. The target calculated would see primary wave B end within this range.
I have only seen two triple zigzags before during my 10 years of daily Elliott wave analysis. If this wave count turns out to be correct, this would be the third. The rarity of this structure is identified on the chart.
FIFTH DAILY CHART
Click chart to enlarge.
Minor wave 1 may have been a relatively brief impulse over at the low of the 8th of February. Thereafter, minor wave 2 may be an incomplete double combination.
The first structure in the double may be a zigzag labelled minute wave w. The double may be joined by a three in the opposite direction, a zigzag labelled minute wave x. The second structure in the double may be an incomplete triangle labelled minute wave y. This structure may yet take some weeks to complete. In my experience a double combination with a triangle for minute wave y is not very common. This reduces the probability of this wave count, but it remains valid.
This wave count is a good solution for this bearish wave count. All subdivisions fit and there are no rare structures.
TECHNICAL ANALYSIS
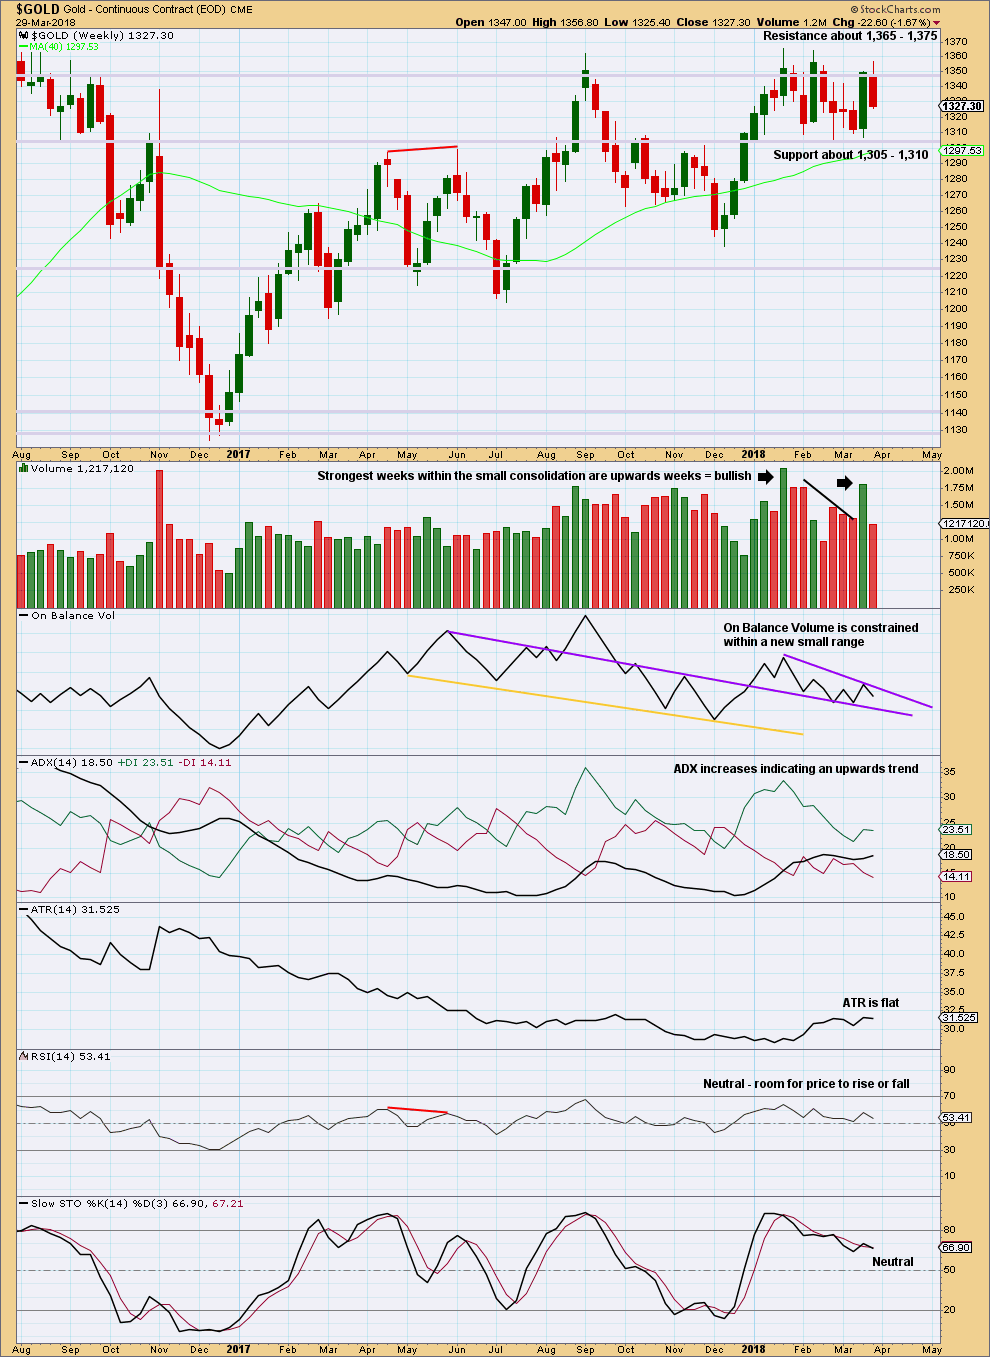
WEEKLY CHART
Click chart to enlarge. Chart courtesy of StockCharts.com.
A longer upper wick is bearish, but a lack of support from volume is slightly bullish. However, price can fall of its own weight. For downwards movement to be sustained for a little longer support from volume is not necessary.
A new resistance line is drawn on On Balance Volume.
DAILY CHART
Click chart to enlarge. Chart courtesy of StockCharts.com.
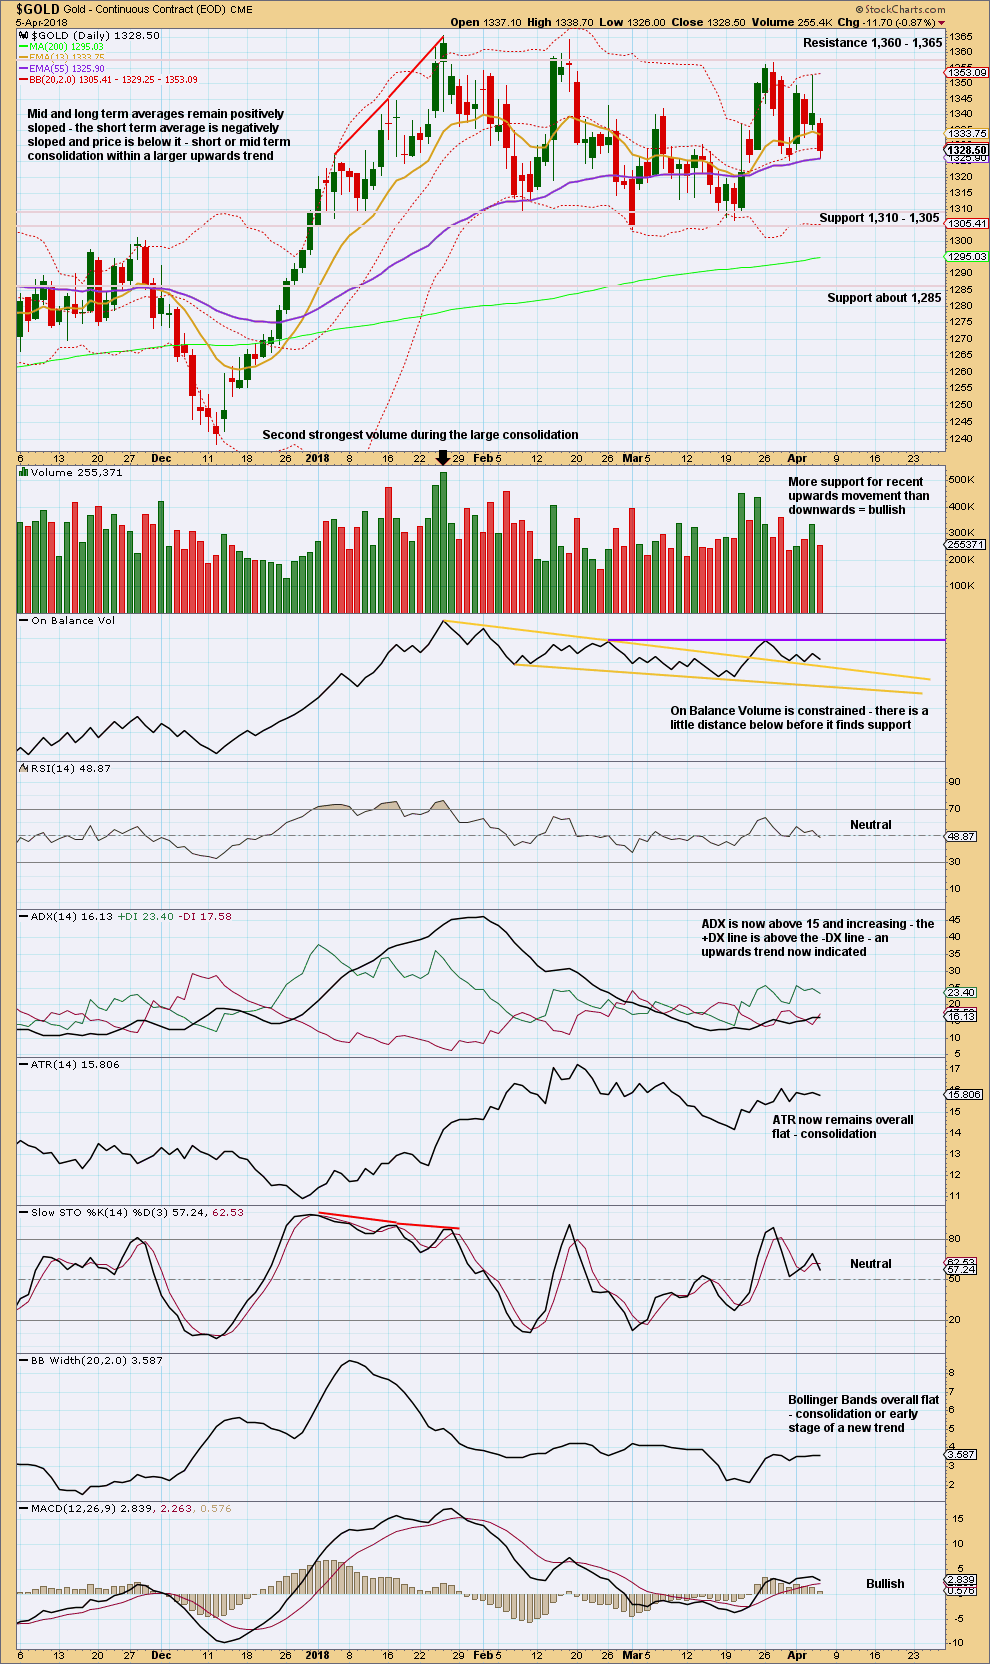
Gold is within a smaller consolidation that began back on about the 3rd of January. This consolidation is delineated by resistance about 1,360 to 1,365 and support about 1,310 to 1,305. It is the upwards day of the 15th of January that has strongest volume during this consolidation. This suggests an upwards breakout may be more likely than downwards.
The 15th of January also has the second strongest volume within a larger consolidation that goes back to about August 2017.
In the short term, the volume profile remains bullish and support for On Balance Volume is close by. For this downwards swing to continue to support at 1,310 – 1,305 the current support at the 55 day moving average and on On Balance Volume needs to be overcome. A bounce within the downwards swing may develop here.
GDX WEEKLY CHART
Click chart to enlarge. Chart courtesy of StockCharts.com.
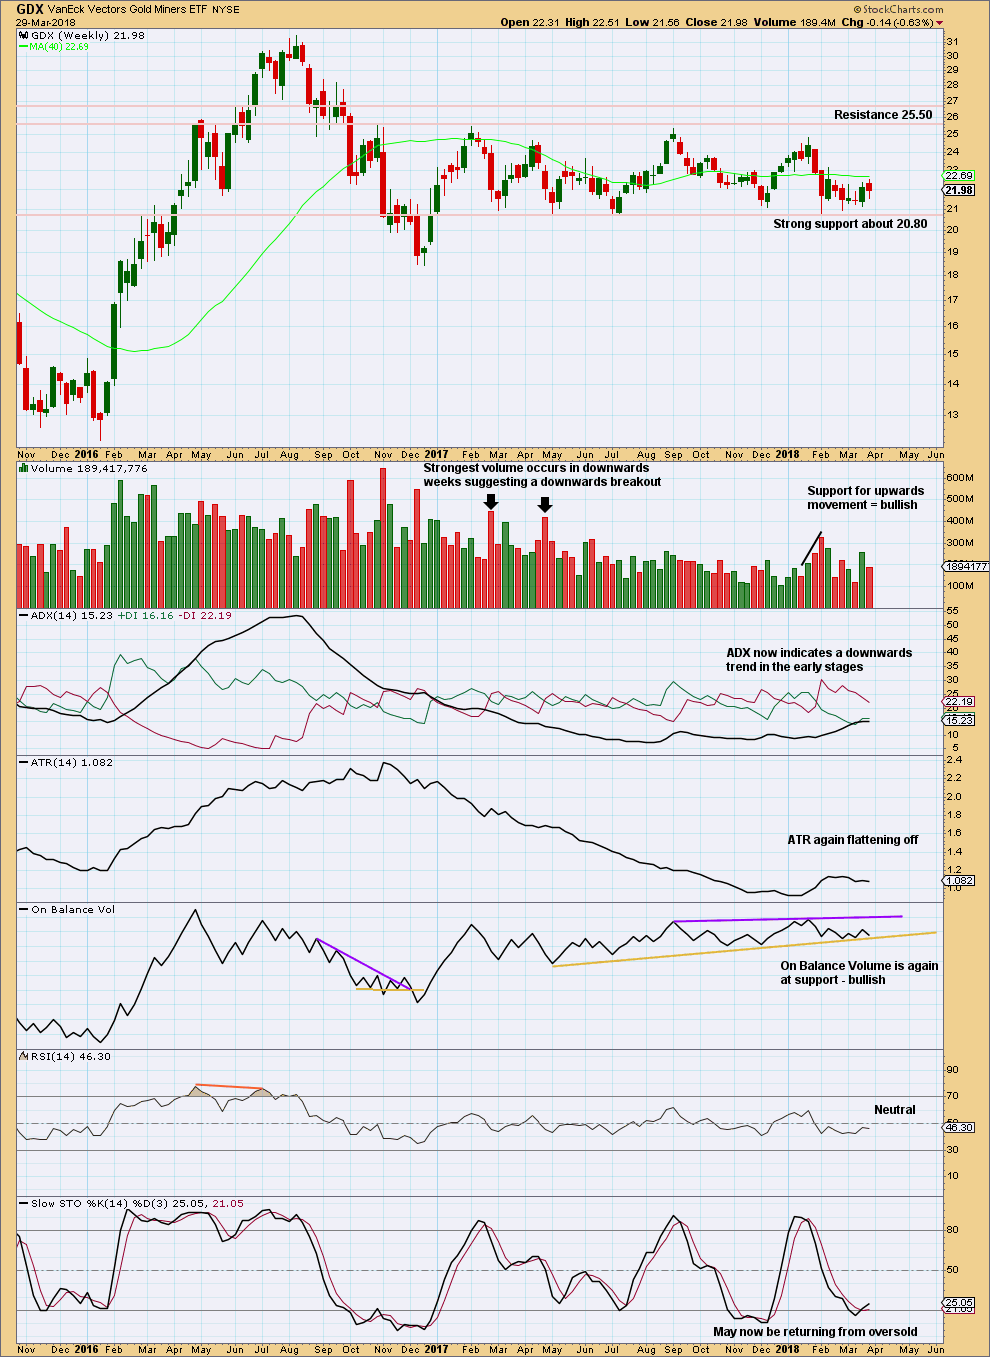
Support about 20.80 has been tested about eight times and so far has held. The more often a support area is tested and holds, the more technical significance it has.
In the first instance, expect this area to continue to provide support. Only a strong downwards day, closing below support and preferably with some increase in volume, would constitute a downwards breakout from the consolidation that GDX has been in for a year now.
Resistance is about 25.50. Only a strong upwards day, closing above resistance and with support from volume, would constitute an upwards breakout.
With On Balance Volume again at support look for upwards movement this week. Downwards movement during last week lacks support from volume.
GDX DAILY CHART
Click chart to enlarge. Chart courtesy of StockCharts.com.
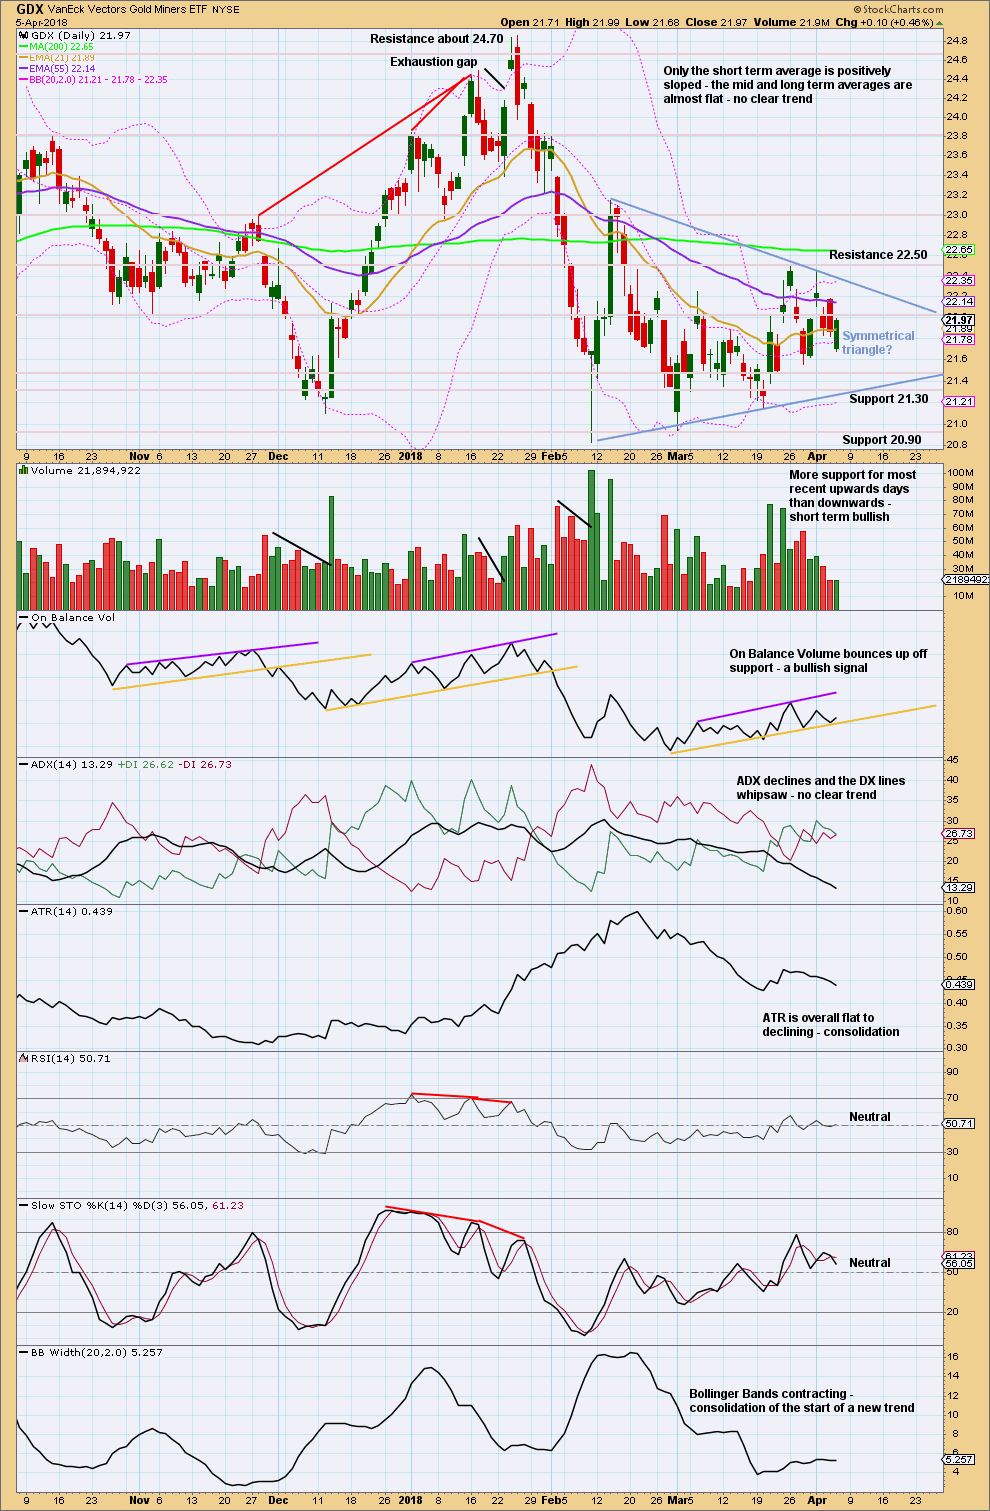
GDX is range bound at both weekly and daily time frames. The smaller consolidation here has resistance now about 22.50 and support about 21.30 and 20.90.
On Balance Volume is also constrained.
A symmetrical triangle may be forming. A breakout would require a close above resistance or below support, preferably with support from volume. A target for the next trend may be calculated after a breakout.
The very short term volume profile remains bullish.
Published @ 07:02 p.m. EST.
updated hourly chart:
subminuette wave ii showing up on the daily chart, this means subminuette wave iv may also do so (but does not have to)
Overall a downwards swing is still expected, and don’t expect it to move in a straight line.