
For the short term, a downwards swing within a consolidation was expected and overall an upwards breakout looked more likely thereafter. The upwards breakout has come sooner than expected.
Summary: Wednesday was a classic upwards breakout above resistance with support from volume. Friday may be a shallow pullback; if it continues lower, it should find support at prior resistance now in a zone from 16.950 to 16.835.
The trend is up. Use pullbacks as an opportunity to join the trend.
Always trade with stops, and invest only 1-5% of equity on any one trade.
Last monthly charts can be viewed here.
New updates to this analysis are in bold.
ELLIOTT WAVE COUNTS
MAIN WAVE COUNT
WEEKLY CHART
Click chart to enlarge.
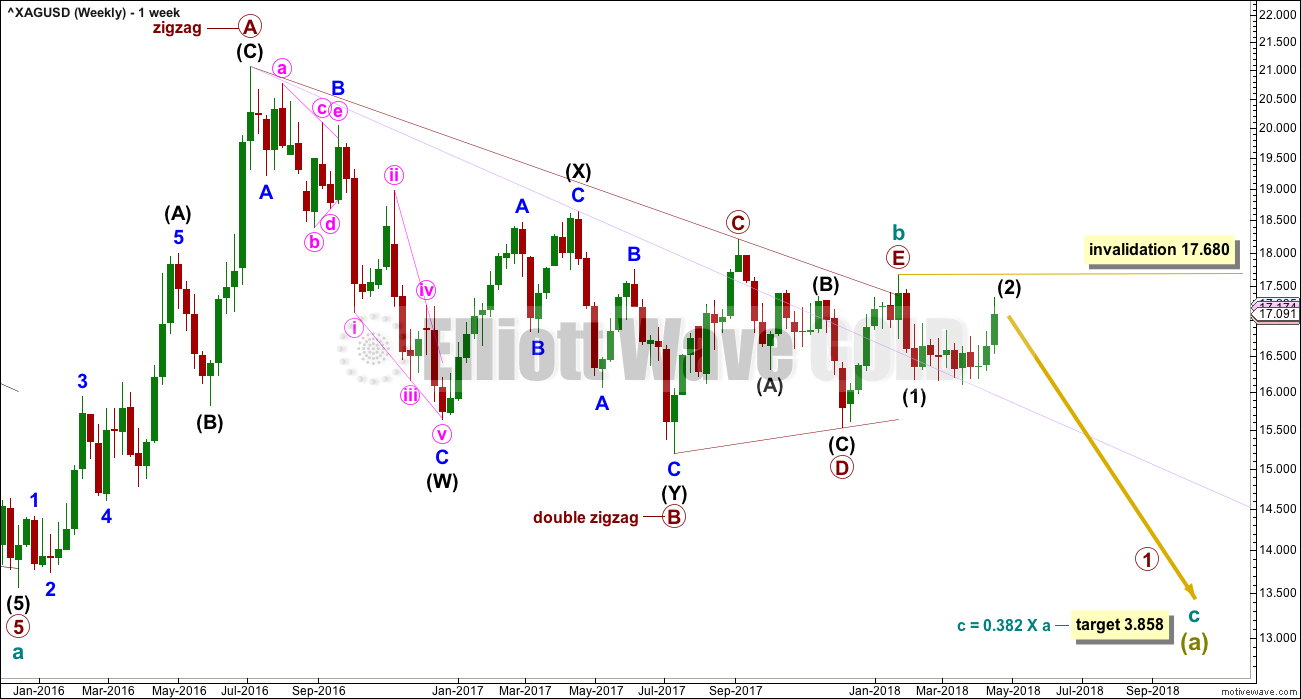
The main wave count expects that the bear market, which began from the April 2011 high, is incomplete.
Cycle wave a is seen as a five wave impulse for this main wave count. There are multiple corrective structures possible still for cycle wave b.
This first weekly chart sees cycle wave b as a now possibly complete regular contracting triangle.
Primary wave E of the triangle may have ended with an overshoot of the A-C trend line. If this wave count is correct, then price should have reversed already. Within the new downwards trend, no second wave correction may move beyond the start of the first wave above 17.680.
DAILY CHART
Click chart to enlarge.
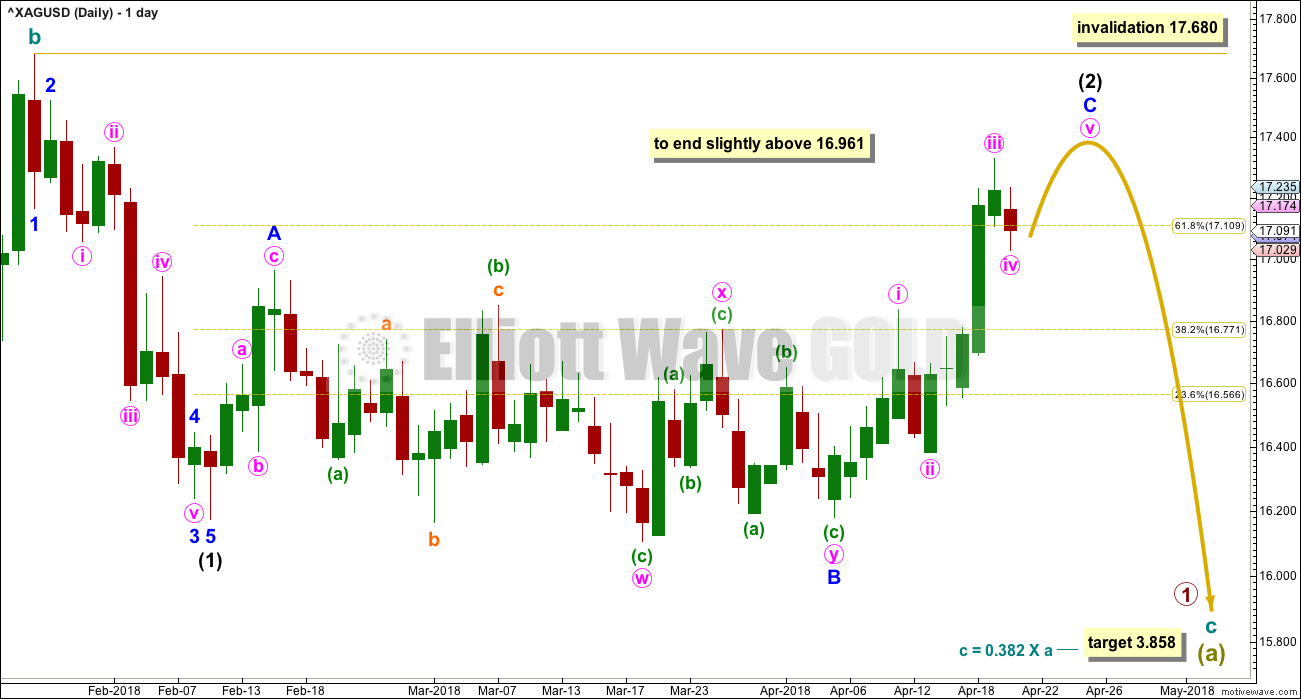
Intermediate wave (1) down subdivides well as a five wave structure.
Intermediate wave (2) is this week relabelled (the change is to minor wave B within it). The structure is still incomplete and still a flat correction.
Minor wave B is now labelled as a double zigzag. All subdivisions fit. However, the purpose of a second zigzag in a double is to deepen the correction when the first zigzag does not move price deep enough. Here, the second zigzag has failed to deepen the correction. This is not technically a truncation, but the effect is the same. This structure makes no sense because it has not achieved its purpose. This must necessarily reduce the probability of this wave count.
Intermediate wave (2) may not move beyond the start of intermediate wave (1) above 17.680.
At this stage, this first wave count still has the lowest probability of the three wave counts published for Silver.
SECOND WAVE COUNT
WEEKLY CHART
Click chart to enlarge.
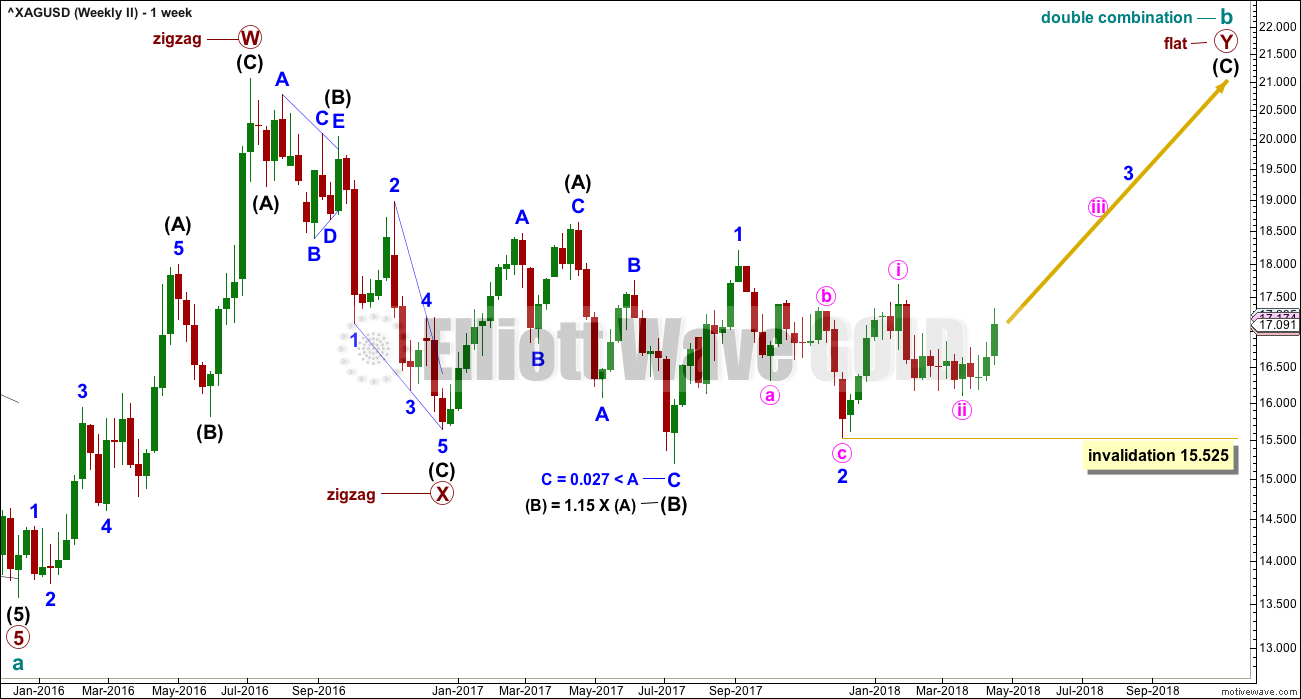
Cycle wave b may be completing as a double combination: zigzag – X – flat. The second structure, a flat correction for primary wave Y, may be underway.
Within a flat correction, intermediate wave (B) must retrace a minimum 0.9 length of intermediate wave (A) at 15.938. Intermediate wave (B) has met this minimum requirement; the rule for a flat correction is met. Intermediate wave (B) is longer than 1.05 times the length of intermediate wave (A) indicating this may be an expanded flat. Expanded flat corrections are the most common type. Normally their C waves are 1.618 or 2.618 the length of their A waves.
The purpose of combinations is to take up time and move price sideways. To achieve this purpose the second structure in the double normally ends about the same level as the first.
While the combination wave count at the weekly chart level does not currently work for Gold, it does still work for Silver. They do not have to complete the same structures for cycle wave b, and fairly often their structures are different.
Intermediate wave (C) for this wave count is starting out slowly, with deep time consuming second wave corrections. This may indicate very strong upwards movement ahead, with a time consuming and strong impulse to complete.
If minute wave ii continues lower, it may not move beyond the start of minute wave i below 15.525.
DAILY CHART
Click chart to enlarge.
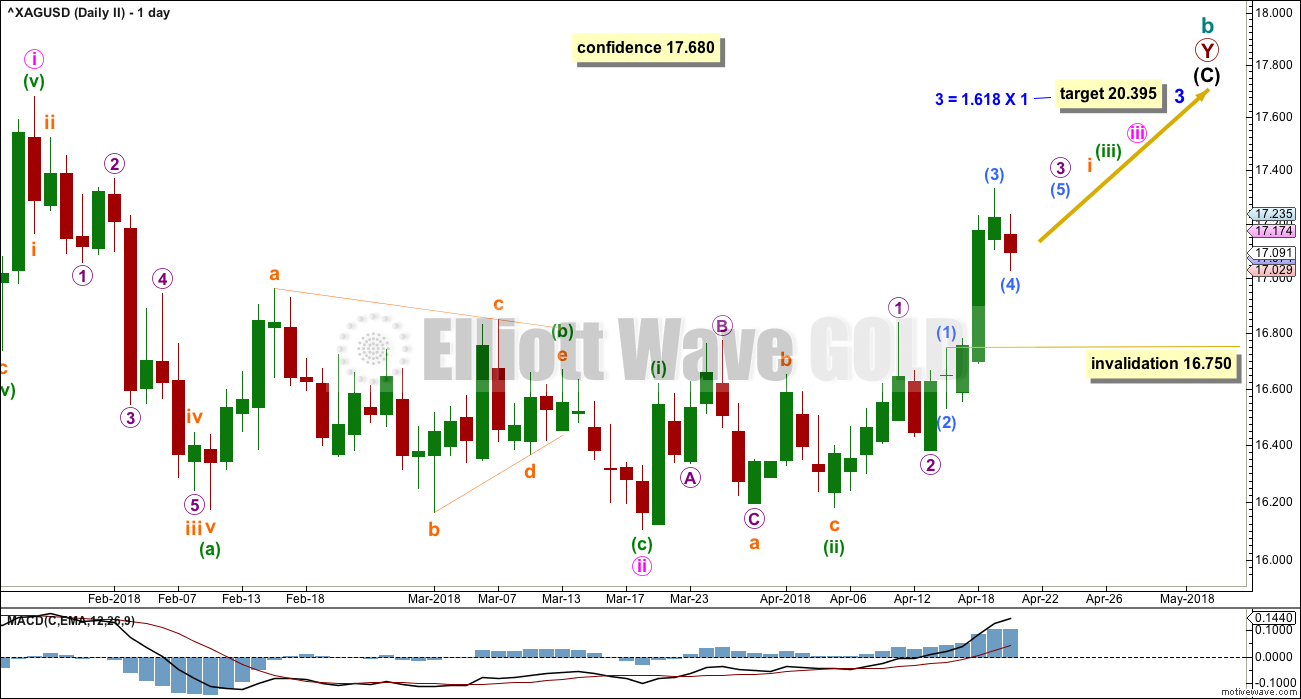
Minute wave ii looks most likely to be over. Minute wave iii may only subdivide as an impulse.
Within minute wave iii, minuette waves (i) and (ii) may be complete. Minuette wave (iii) may only subdivide as an impulse.
Within minuette wave (iii), subminuette wave i may be incomplete.
Within subminuette wave i, micro waves 1 and 2 may be complete. Micro wave 3 may only subdivide as an impulse. Within micro wave 3, sub-micro wave 4 may not move into sub-micro wave 1 price territory below 16.750.
ALTERNATE WAVE COUNT
WEEKLY CHART
Click chart to enlarge.
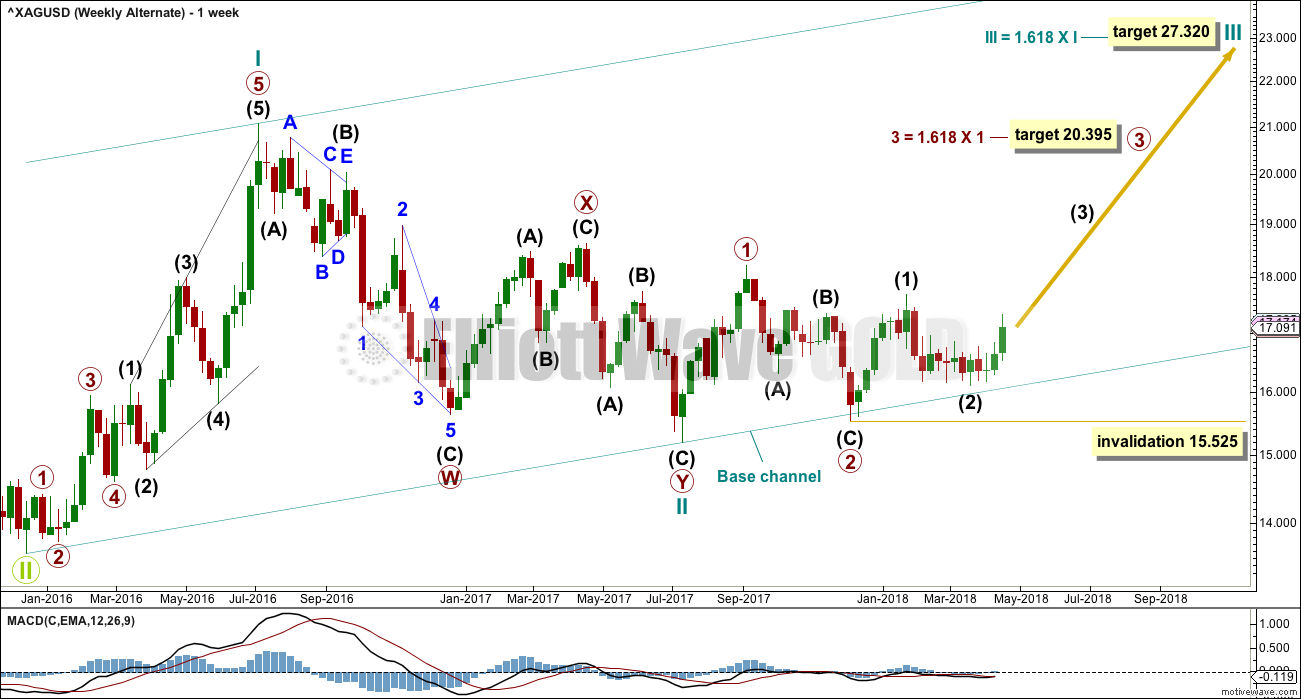
This alternate wave count looks at the possibility that the bear market may be over for Silver and a new bull market may have begun.
A series of three overlapping first and second waves may now be complete for cycle waves I and II, primary waves 1 and 2, and intermediate waves (1) and (2).
A third wave now at three large degrees may be beginning.
Targets calculated for third waves assume the most common Fibonacci ratios to their respective first waves. As price approaches each target, if the structure is incomplete or price keeps rising through the target, then the next Fibonacci ratio in the sequence would be used to calculate a new target.
Within primary wave 3, intermediate wave (2) may not move beyond the start of intermediate wave (1) below 15.525.
The large base channel about cycle waves I and II nicely shows where primary wave 2 found support. A lower degree second wave correction should find support (in a bull market) about a base channel drawn about a first and second wave one or more degrees higher. If this base channel is breached at the daily chart level with one full daily candlestick below and not touching it, then the probability of this alternate wave count would be reduced.
DAILY CHART
Click chart to enlarge.
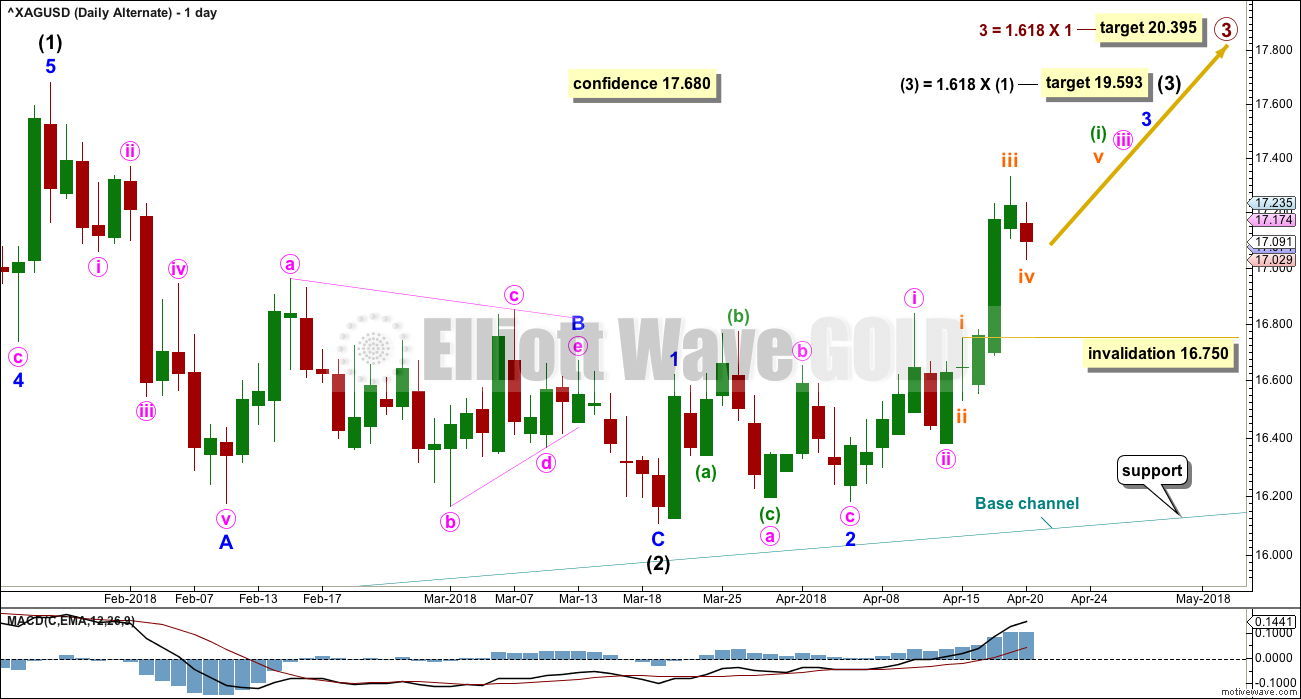
Intermediate wave (2) should be over.
Intermediate wave (3) may only subdivide as an impulse. Within intermediate wave (3), minor waves 1 and 2 may be complete. Minor wave 3 would be incomplete. Minor wave 3 may only subdivide as an impulse.
Within minor wave 3, minute waves i and ii may be complete. Minute wave iii may be incomplete and may only subdivide as an impulse.
Within minute wave iii, minuette wave (i) may be incomplete and may be subdividing as an impulse. Within the impulse of minuette wave (i), the correction of subminuette wave iv may not move into subminuette wave i price territory below 16.750.
TECHNICAL ANALYSIS
WEEKLY CHART
Click chart to enlarge. Chart courtesy of StockCharts.com.
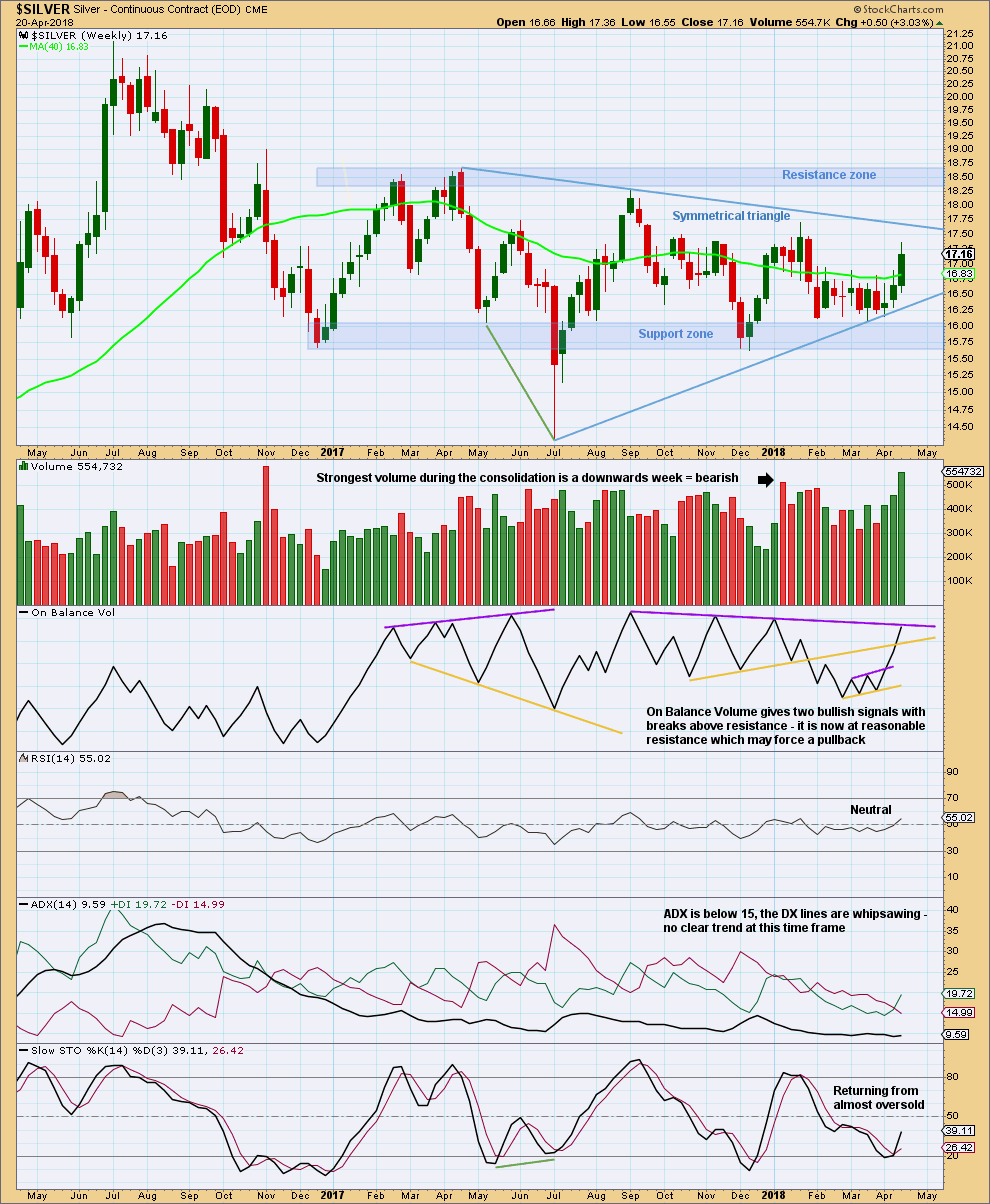
Price remains within the support and resistance zone.
An upwards swing may continue to resistance either at the upper edge of the symmetrical triangle trend line or up into the resistance zone.
If next week prints another green weekly candlestick, then On Balance Volume may give an important bullish signal with a break above resistance.
DAILY CHART
Click chart to enlarge. Chart courtesy of StockCharts.com.
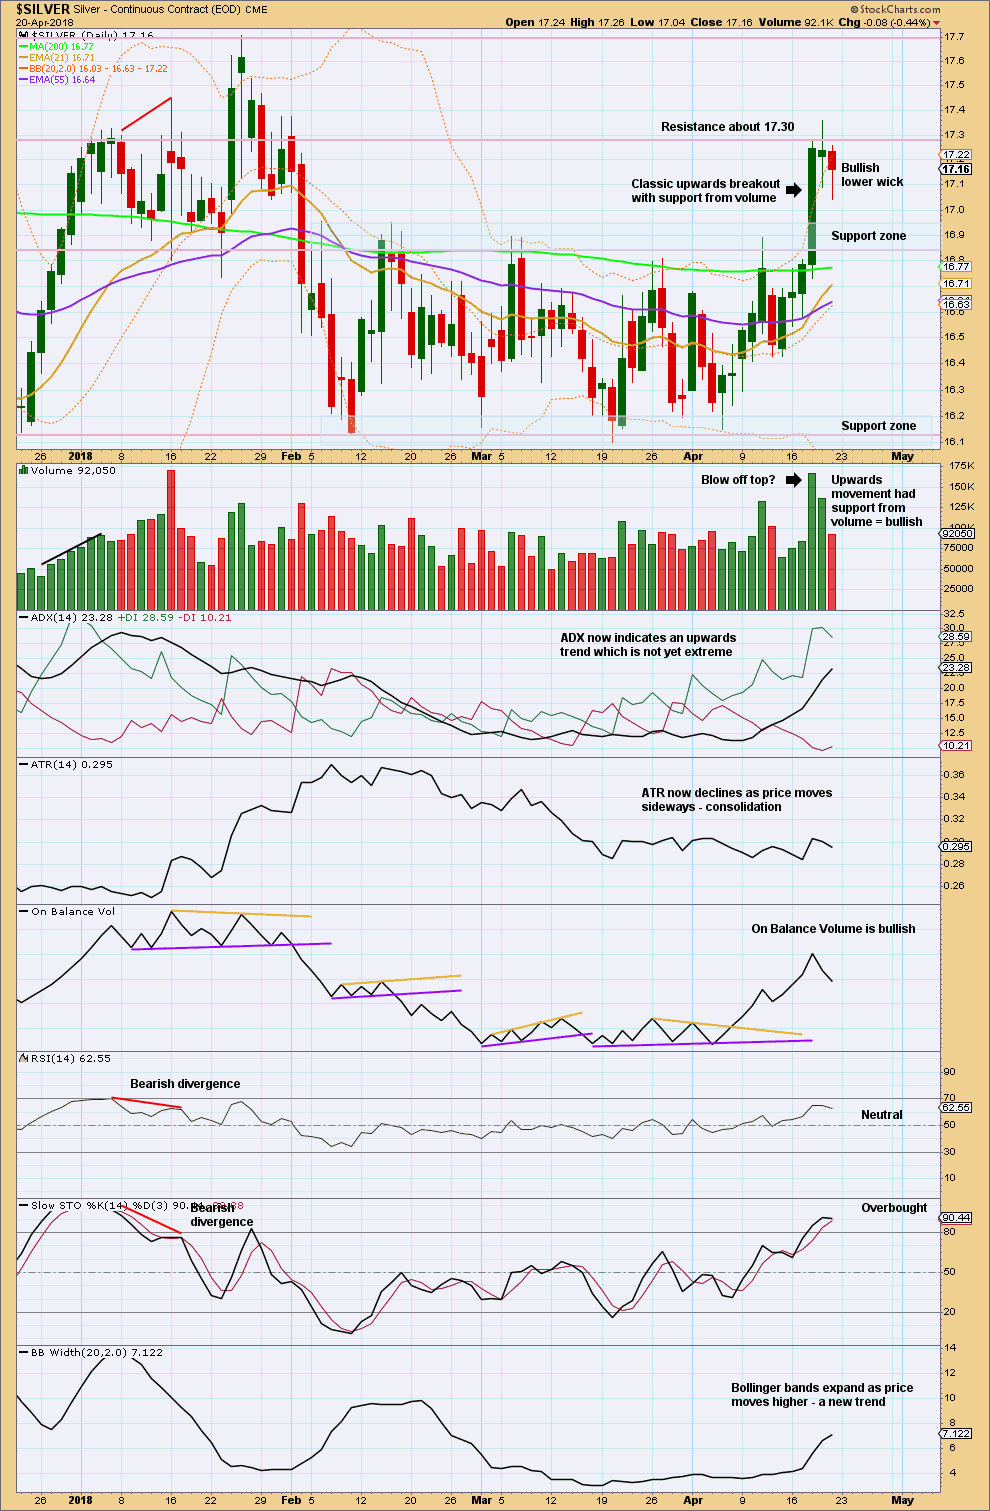
Wednesday was a classic upwards breakout, which has good support from volume. Because the volume level was a strong spike look for a reaction. Look now for a curve down back to support.
Friday’s downwards session does not have support from volume and has a long lower wick, both of which are bullish. The risk here for bulls is they may miss an entry opportunity if they wait for a deeper pullback, which may be over at Friday’s low. Alternatively, there is risk that an entry here may be premature and an underwater position may be held for a few days. I leave it up to each member to judge their own risk appetite.
A target using the measured rule is about 17.751.
Stops for long positions may be set just within the consolidation zone, just below 16.810 ideally. Reduce position size to allow for this movement, risking only 1-5% of equity on any one trade.
Published @ 04:20 a.m. EST on 21st April, 2018.
Updated second second wave count, daily chart:
Downwards movement today cannot be a fourth wave correction, so the last wave up must be over. It may be a three (which looks best) or it may be a five. Silver does not always have waves that look ideal, so both possibilities must be considered.
Bottom line from a classic TA perspective: silver remains range bound. Swinging from resistance to support and back again. The upwards move of 18th of April looked like a classic upwards breakout with support from volume, but the strong move back down into the consolidation zone indicates the breakout was false.
That’s another really difficult thing about this particular market. It will have false breakouts. Even breakouts that look as good as that one did, and when they have support from volume.
Of all the markets I analyse, this one is the hardest. It’s the most volatile and has the worst looking EW structures.
Thanks for the update Lara. Indeed silver is the most bipolar of markets.
Lots of interest in this market when it shot above key resistance levels, and the upper BB’s. It was due for a correction, but it’s surprising how deep it is…