
A small inside week closing as a doji saw only sideways movement from Oil. This leaves the analysis the same.
Summary: Classic technical analysis remains overly bullish. There is an upwards trend in place. Pullbacks are an opportunity to join the trend.
At this stage, three daily Elliott wave charts all conclude there may be a deep pullback here, but this does not have good support from classic technical analysis.
Always practice good risk management as the most important aspect of trading. Always trade with stops and invest only 1-5% of equity on any one trade. Failure to manage risk is the most common mistake new traders make.
New updates to this analysis are in bold.
MAIN WAVE COUNT
MONTHLY CHART
Click chart to enlarge.
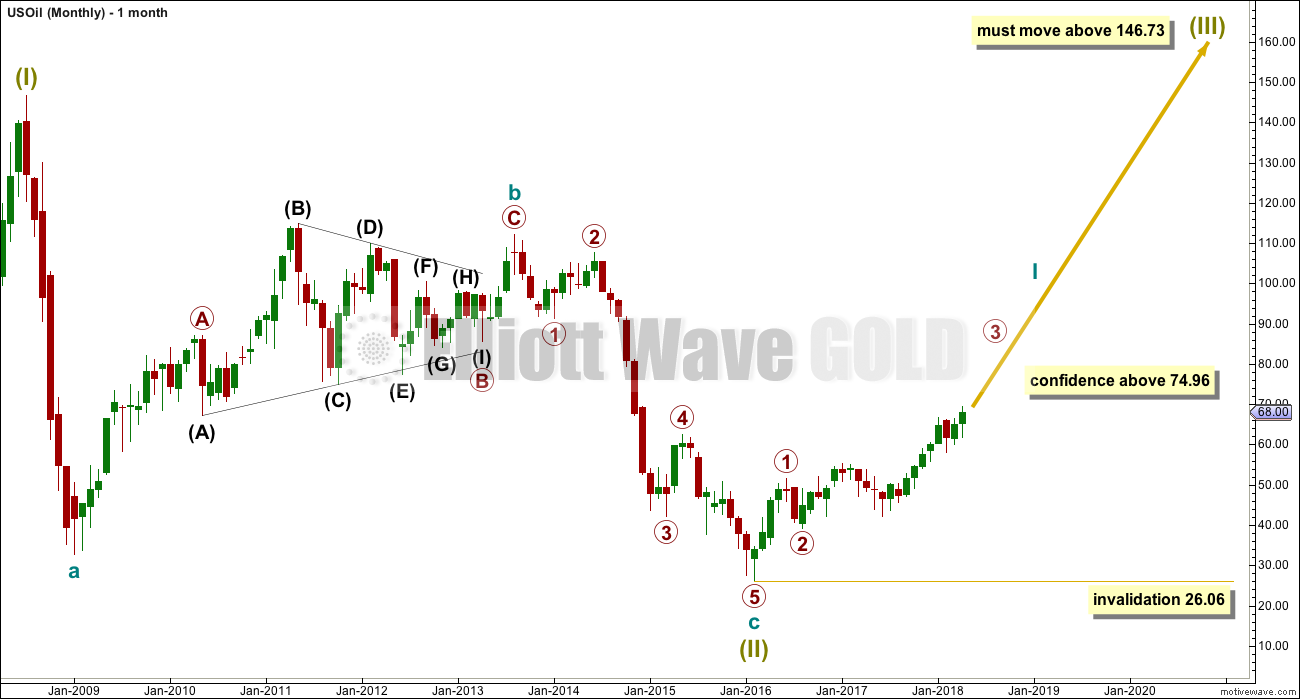
It is possible that the bear market for Oil is over and a new bull market is in the very early stages.
A huge zigzag down to the last low may be complete and is labelled here Super Cycle wave (II).
Cycle wave b must be seen as complete in August 2013 for this wave count to work. It cannot be seen as complete at the prior major swing high in May 2011.
Cycle wave b is seen as a zigzag, and within it primary wave B is seen as a running contracting triangle. These are fairly common structures, although nine wave triangles are uncommon. All subdivisions fit.
Primary wave C moves beyond the end of primary wave A, so it avoids a truncation. But it does not have to move above the price territory of primary wave B to avoid a truncation, which is an important distinction.
If cycle wave b begins there, then cycle wave c may be seen as a complete five wave impulse.
Super Cycle wave (III) must move beyond the end of Super Cycle wave (I). It must move far enough above that point to allow room for a subsequent Super Cycle wave (IV) to unfold and remain above Super Cycle wave (I) price territory.
Cycle wave I may be incomplete. It may be ready to move through the middle and end of its third wave at primary degree, which may be the strongest upwards portion of cycle wave I; a strong increase in momentum and range may be ahead.
When cycle wave I is complete, then cycle wave II may be a deep correction that may not move beyond the start of cycle wave I below 26.06.
Data from FXCM for USOil does not go back to the beginning of Super Cycle wave (I). Without an accurate known length of Super Cycle wave (I) a target cannot be calculated for Super Cycle wave (III) to end using Fibonacci ratios. The target for Super Cycle wave (III) may be calculated when cycle waves I, II, III and IV within it are complete. That cannot be done for many years.
WEEKLY CHART
Click chart to enlarge.
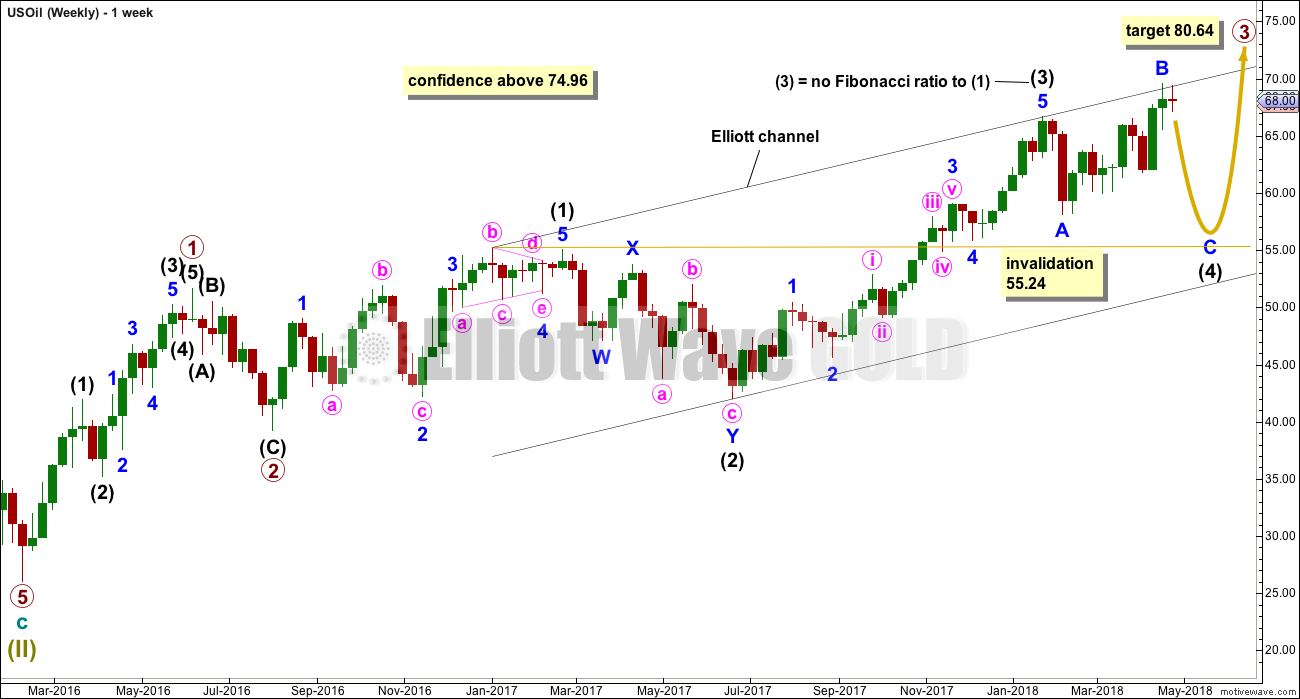
If a new bull market is in the very early stages for Oil, then it may have begun with two overlapping first and second waves at primary then at intermediate degree.
Primary wave 3 may only subdivide as an impulse, and within it intermediate wave (3) may be complete.
Intermediate wave (4) may not move into intermediate wave (1) price territory below 55.24. Intermediate wave (4) would most likely be incomplete. It may continue further sideways or lower.
Intermediate wave (2) is labelled as a double zigzag. To exhibit alternation intermediate wave (4) may most likely be a flat, combination or triangle. Intermediate wave (2) lasted 17 weeks. For good proportion and the right look, intermediate wave (4) may last a Fibonacci 13 or even 21 weeks in total. So far it has lasted 13 weeks.
Intermediate wave (4) would have to be over at the low labelled minor wave A to label it as complete, and would have lasted only two weeks. That idea has gross disproportion between intermediate waves (2) and (4), so it looks highly unlikely. What looks much more likely is that intermediate wave (4) should be continuing further.
Within all of a flat, triangle or combination, minor wave B (or X) may make a new high above the start of minor wave A (or W). The new high for minor wave B is entirely acceptable as part of intermediate wave (4).
Commodities typically exhibit swift and strong fifth waves within their impulses, and this tendency is particularly common for third wave impulses. Intermediate wave (5) may be a swift strong upwards wave when it arrives.
DAILY CHART
Click chart to enlarge.
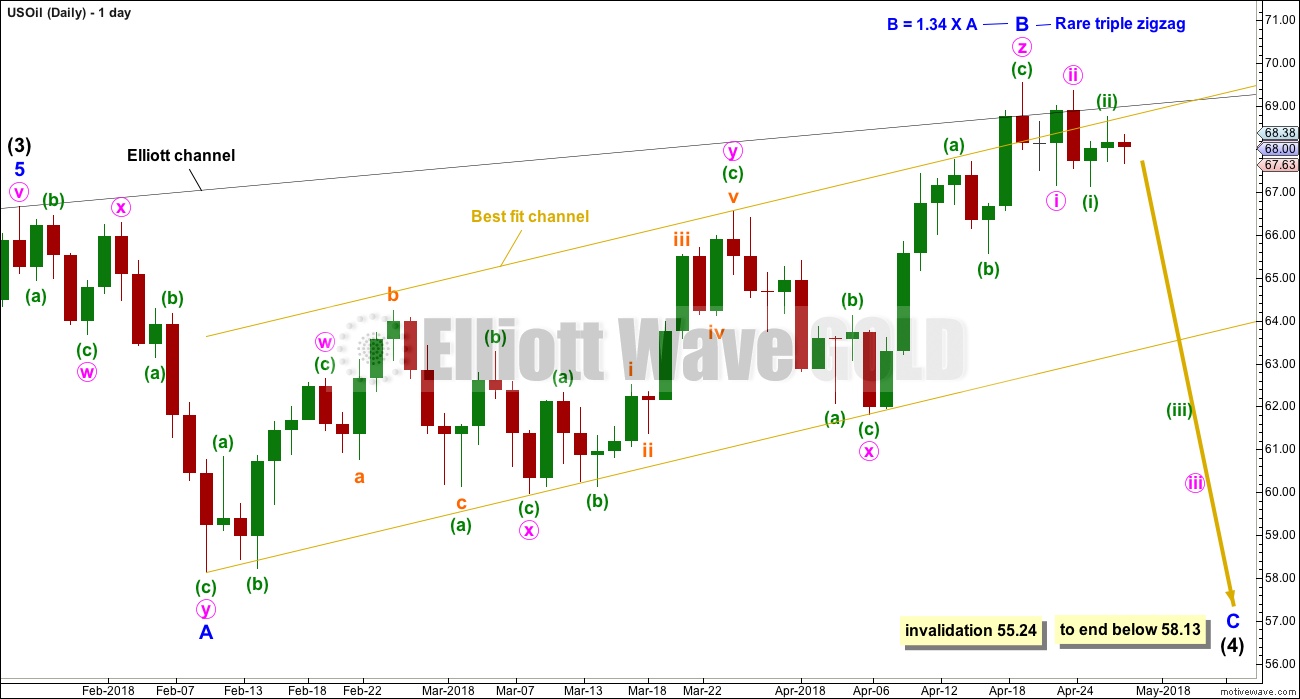
Minor wave B may have continued higher this week as a triple zigzag. If upwards movement is a completed corrective structure, this is how it fits best. However, I have only ever seen two or three triple zigzags before in my now 10 years of daily Elliott wave analysis on one to four markets. If this wave count is correct, this would be the third or fourth. These are in my experience very rare structures.
Intermediate wave (4) may still be any one of a flat, combination or triangle. Of these three options a flat would be the most common and so most likely. If intermediate wave (4) is a flat, then minor wave C within it should make a new low below the end of minor wave A at 58.13 to avoid a truncation and a very rare running flat.
Intermediate wave (4) may also be a combination labelled minor waves W-X-Y. However, this idea would require the first wave down (labelled minor wave A on the chart) to be seen as a single zigzag, not a double. This downwards wave does fit better as a double zigzag rather than a single. The double would be now joined by a three in the opposite direction labelled minor wave X. A flat correction would now be most likely to unfold sideways for minor wave Y.
Intermediate wave (4) may be a triangle with minor waves A and B complete. Minor wave C should end above the end of minor wave A at 58.13 for a triangle, and thereafter minor waves D and E should continue sideways in an ever decreasing range. A triangle may take several more weeks to unfold sideways.
DAILY CHART II
Click chart to enlarge.
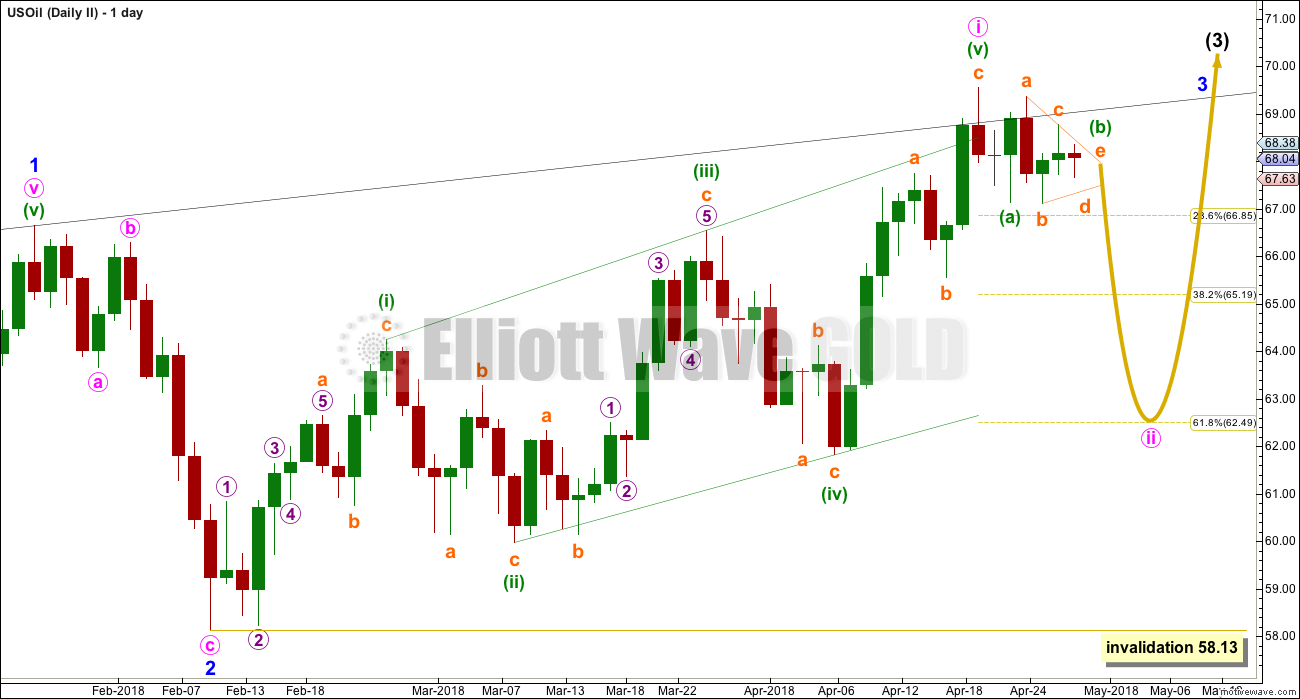
By moving the degree of labelling within intermediate wave (3) all down one degree, it is possible that it is incomplete and so far only minor waves 1 and 2 may be complete.
Minor wave 3 may have begun with a leading expanding diagonal for minute wave i. The subdivisions of this upwards movement are almost the same as the first daily chart, but now the problem of a very rare triple zigzag is resolved. Leading diagonals are not rare structures.
Second wave corrections following leading diagonals in first wave positions are commonly very deep; they may be deeper than the 0.618 Fibonacci ratio of the first wave diagonal. Minute wave ii may be expected to reach at least 62.49 and may well be deeper, if this wave count is correct.
Minute wave ii may be unfolding as a zigzag, and within it minuette wave (b) may be a running contracting triangle. This fits sideways movement best so far for this week.
Minute wave ii may not move beyond the start of minute wave i below 58.13.
When minute wave ii is complete, then this wave count would expect a third wave up to unfold at four degrees. The expectation would be for explosive upwards movement.
ALTERNATE WAVE COUNT
MONTHLY CHART
Click chart to enlarge.
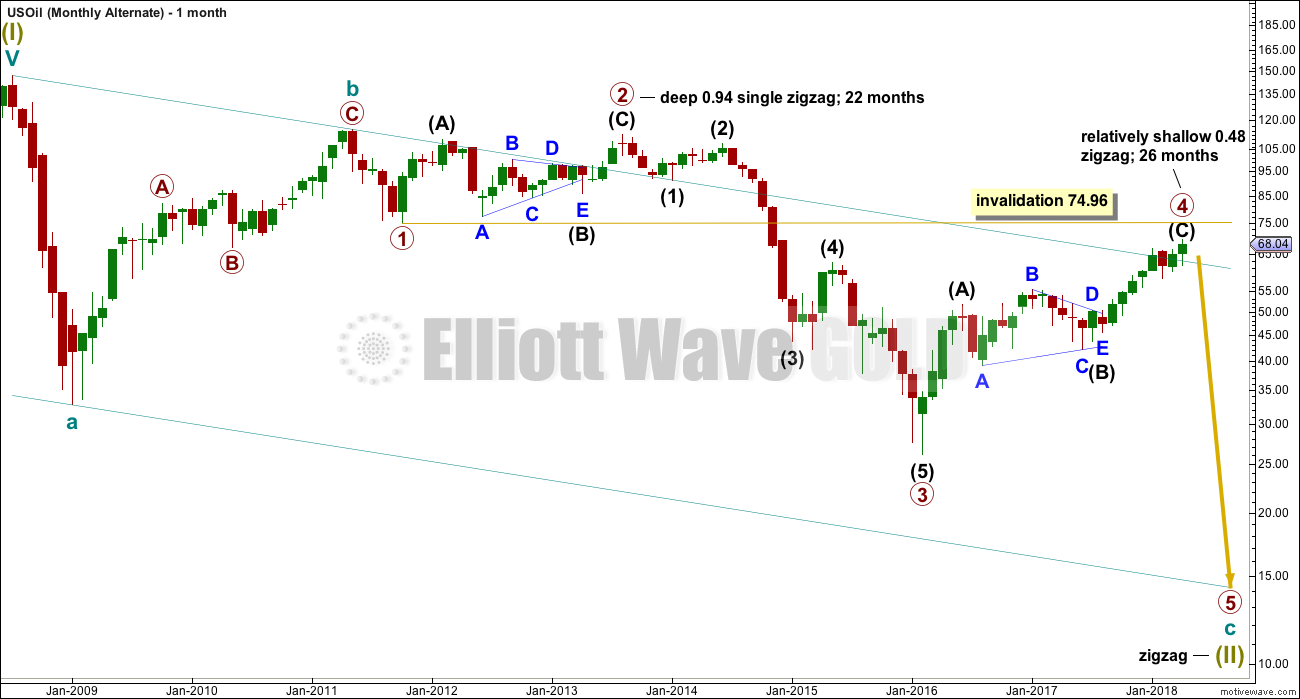
Within the bear market, cycle wave b is seen as ending in May 2011. Thereafter, a five wave structure downwards for cycle wave c begins.
Primary wave 1 is a short impulse lasting five months. Primary wave 2 is a very deep 0.94 zigzag lasting 22 months. Primary wave 3 is a complete impulse with no Fibonacci ratio to primary wave 1. It lasted 30 months.
There is alternation in depth with primary wave 2 very deep and primary wave 4 relatively shallow. There is inadequate alternation in structure, both are zigzags. So far primary wave 4 has lasted 26 months. At this stage, there isstill reasonable proportion between primary waves 2 and 4.
Primary wave 4 may not move into primary wave 1 price territory above 74.96.
The wider Elliott channel (teal) about this whole movement may offer support to primary wave 5.
WEEKLY CHART
Click chart to enlarge.
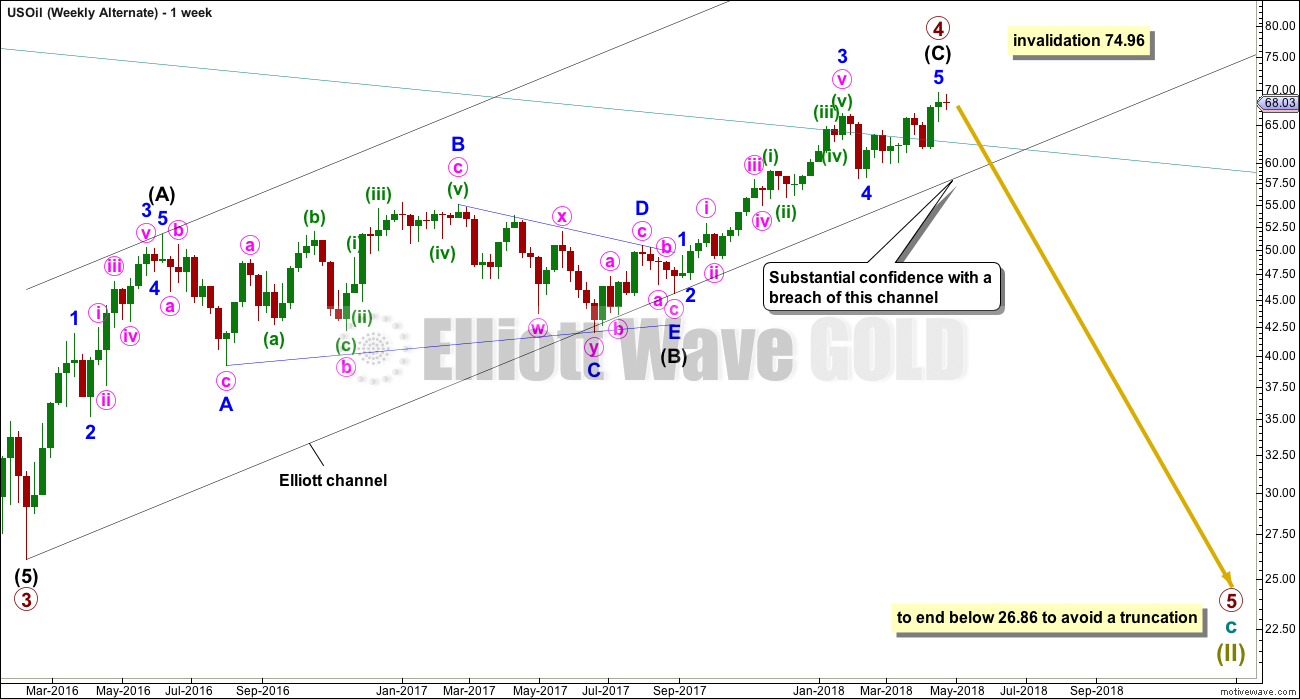
This wave count now expects a huge trend change for a new wave down for primary wave 5, which may last about a year or so. Primary wave 5 would be likely to make at least a slight new low below 26.86 to move below the end of primary wave 3 and avoid a truncation.
An Elliott channel is added to this possible zigzag for primary wave 4. A breach of the lower edge of this channel would provide a very strong indication that primary wave 4 should be over and primary wave 5 should be underway. Look out for some support on the way down, perhaps a short term bounce about the lower edge of the channel.
DAILY CHART
Click chart to enlarge.
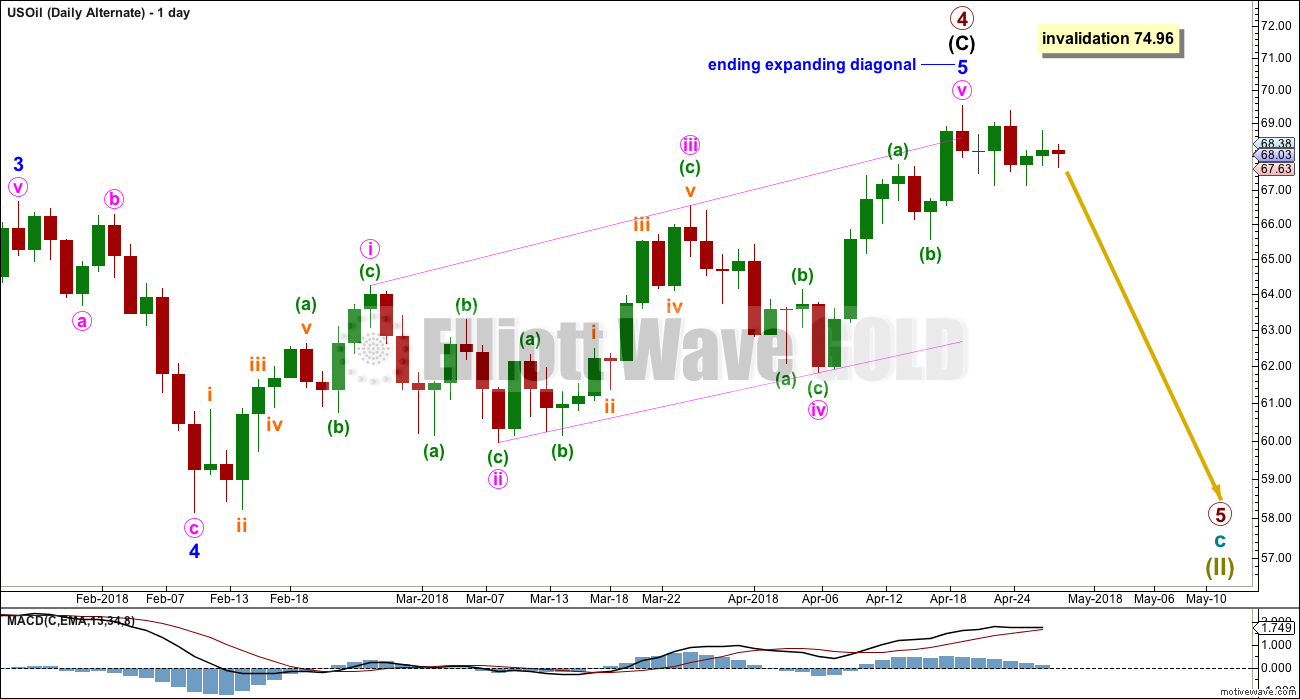
Minor wave 5 may now be a complete ending expanding diagonal, ending with an overshoot of the i-iii trend line.
A reversal would now be expected. A new low below 55.24 is required for confidence in this wave count. At that stage, the main wave count would be invalidated.
For US Oil, it is new trends that very often start out with time consuming and deep second wave corrections. There is an excellent example of this tendency on the alternate monthly chart above for primary wave 2.
This wave cound does not at this point have support from classic technical analysis on the monthly chart.
TECHNICAL ANALYSIS
MONTHLY CHART
Click chart to enlarge. Chart courtesy of StockCharts.com.
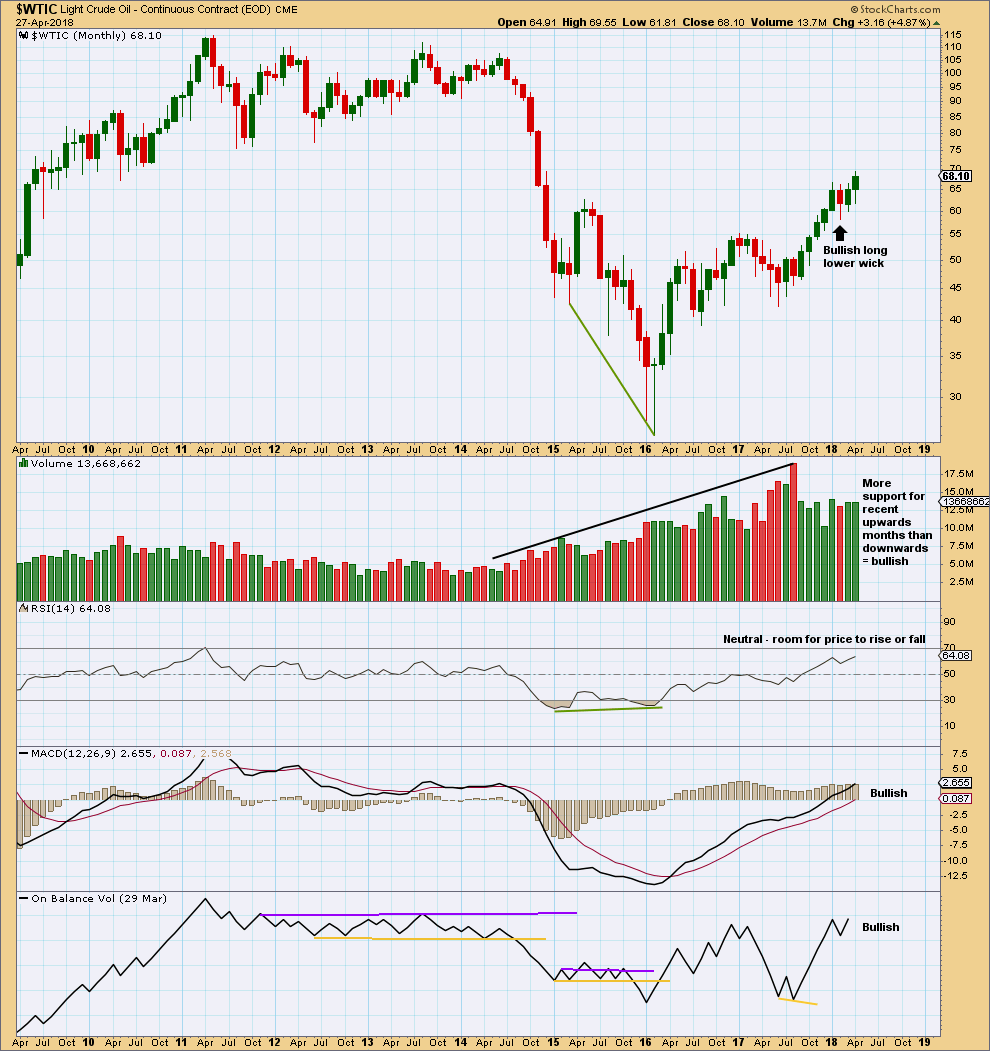
The strongest recent monthly volume is for the downwards month of August 2017. This is bearish.
For the last three months all now complete, the volume profile is bullish.
This chart is overwhelmingly bullish. It supports the main Elliott wave count.
Strong volume for the month of June 2017 may have been a selling climax. This is typical behaviour of commodities.
DAILY CHART
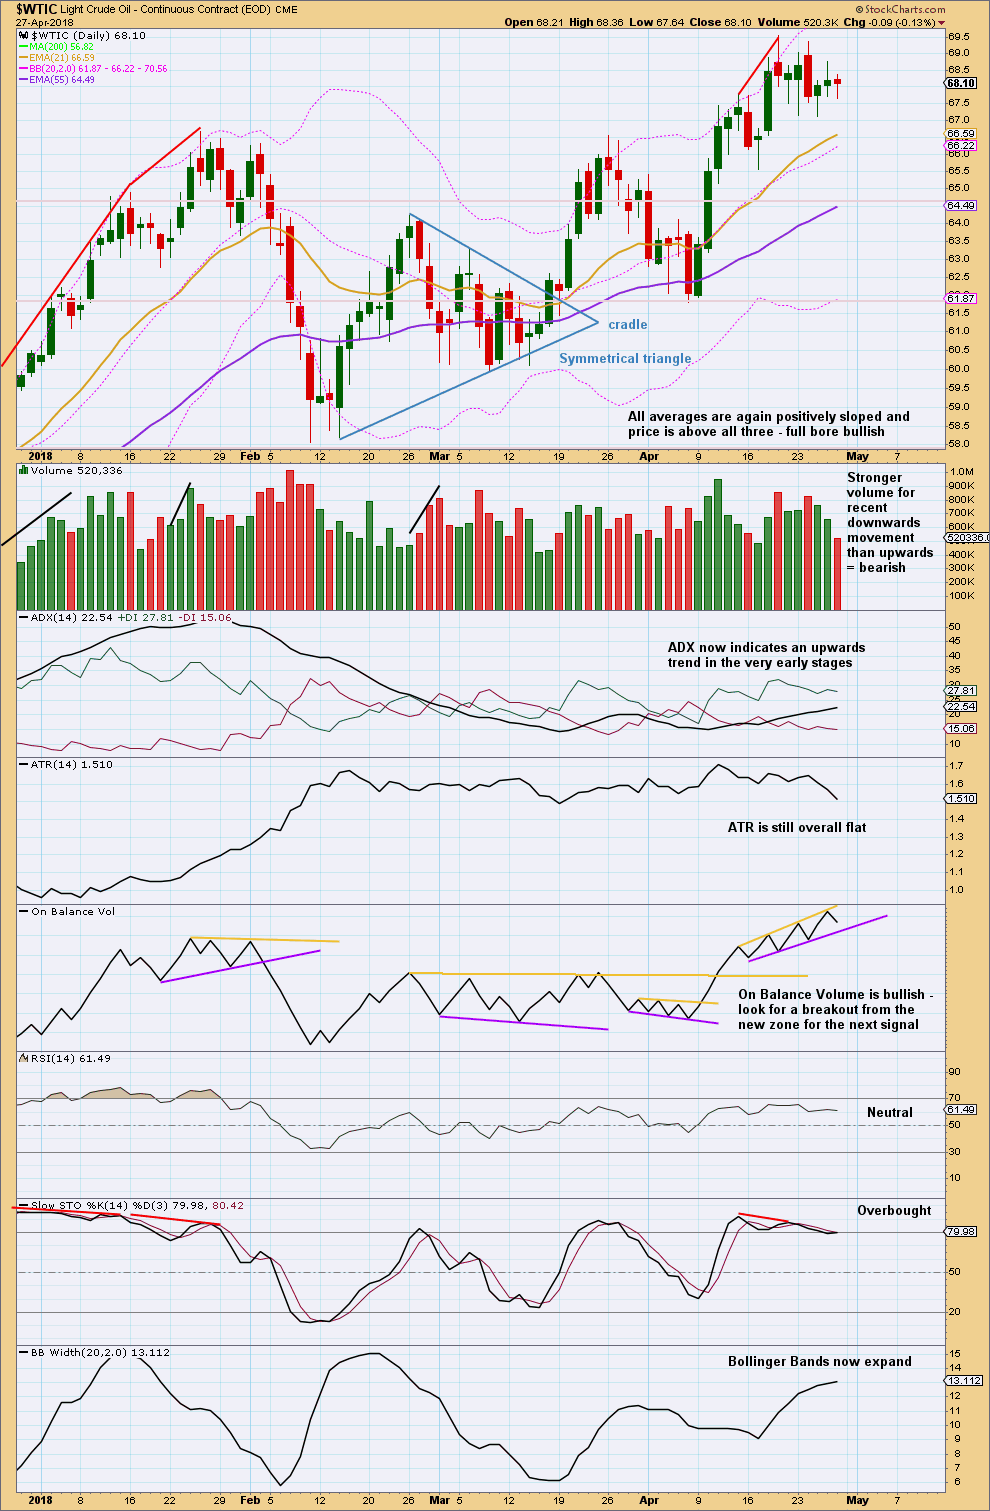
Click chart to enlarge. Chart courtesy of StockCharts.com.
The last seven sessions are completing a small consolidation. This may be a flag pattern that would expect an upwards breakout, which is bullish. But during the last seven sessions it is two downwards days that have strongest volume, suggesting a downwards breakout may be more likely than upwards. This offers a little support now to the Elliott wave counts.
If On Balance Volume breaks below support next week, that would offer more support to the Elliott wave counts.
Published @ 04:17 a.m. EST on 28th April, 2018.
Lara,
Thanks for the latest update on USOIL. I always eagerly await your analysis. The conflict between the bullish technical analysis and the short-term bearish counts is enough to give anyone pause here.
I have a question concerning the labeling of the structure of Minor A in the Main Daily count. I think you give very good arguments as to why Minute W of Minor A is best interpreted as a three-wave structure and, therefore, why Minor A is best seen a three-wave W-X-Y, not a simple A-B-C zigzag. However, in the other two counts the same structure as Minor A in the Main count is labelled an A-B-C. Shouldn’t these waves also be labeled W-X-Y to be consistent with arguments given for Main count? This change would not affect those counts in any other way.
You’re absolutely right, they should be relabelled. I’ve just fixed my charts. My apologies, that was rather lazy of me.
My only defence is that it does not affect those counts in any way.
The US surpassed Saudi in oil production. So we’re now swimming in oil (for the next few years anyhow at current production rates before population/demand possibly catches up excluding what alternative energy will be pulling out of demand) but because the Houti’s are supposedly threatening the Aramco fields (which needs $100 oil ironically for ipo), oil stays artificially inflated? Any thoughts?
My thoughts on fundamental analysis will always be that it does not matter to the wave count.
There are more aspects to the global situation regarding oil and oil price than the two issues you have noted. Some of these aspects will be presented in the media today, others may not be presented for some time.
My view (and I know this is very unpopular but it’s a core tenet of Elliott wave theory) is that it is social mood as expressed in price action which drives / creates the news. If price goes up, the news will find a fundamental justification for it. The same if price goes down.
So my view is that it does not matter. And I pay no attention to it.
Plinker, you’re correct that the Saudis are doing everything they can to get the price of oil up before the Aramco IPO. There will likely be a large pullback in price soon after the IPO. The pullback could be Primary wave 4 for the main count or Primary wave 5 of the alternate. Price will let us know.
I’m attempting to incorporate the idea of Elliot Wave into my toolbelt of information. I thank you Dreamer for that correlation to the Primary 4.
Lara, I welcome that viewpoint and have entertained a similar thought process which led me here. I am led to believe everything is “cyclic”, history does not necessarily repeat itself but rhymes. That lead me to Kondratiev wave and eventually Elliot. I watched several analysis’ from different places and ended up here. Technical.
To go a step further, if one were to believe (in my mind so far) it would be possible for the “markets” to be following the “elliot wave” in principal but the news/human factor is what keeps us unsure of the way the structure will unfold. I am not trading futures at this time and am following to learn. Thanks again.
Corrective structures are always hard to trade. So many options. One of the most valuable tools with EW is that it can help to identify impulses and corrective moves. So as they say, you know when to hold em and you know when to fold em… Good to have you here. Keep posting all your thoughts and questions.😃