
An upwards week was expected from last analysis. The week began with a move lower, which hit support, and then bounced strongly from there to complete a long legged doji candlestick.
Summary: At the daily chart level, weakness in the last two upwards days suggests a pullback for the short term. Support is about 16.00 to 16.20.
Price remains range bound at the weekly chart level. Volume suggests an upwards breakout is more likely. On Balance Volume is very bullish. After a short term pullback, expect an upwards swing to likely break above resistance.
The trend is up. Use pullbacks as an opportunity to join the trend.
Always trade with stops, and invest only 1-5% of equity on any one trade.
Last monthly charts can be viewed here.
New updates to this analysis are in bold.
ELLIOTT WAVE COUNTS
MAIN WAVE COUNT
WEEKLY CHART
Click chart to enlarge.
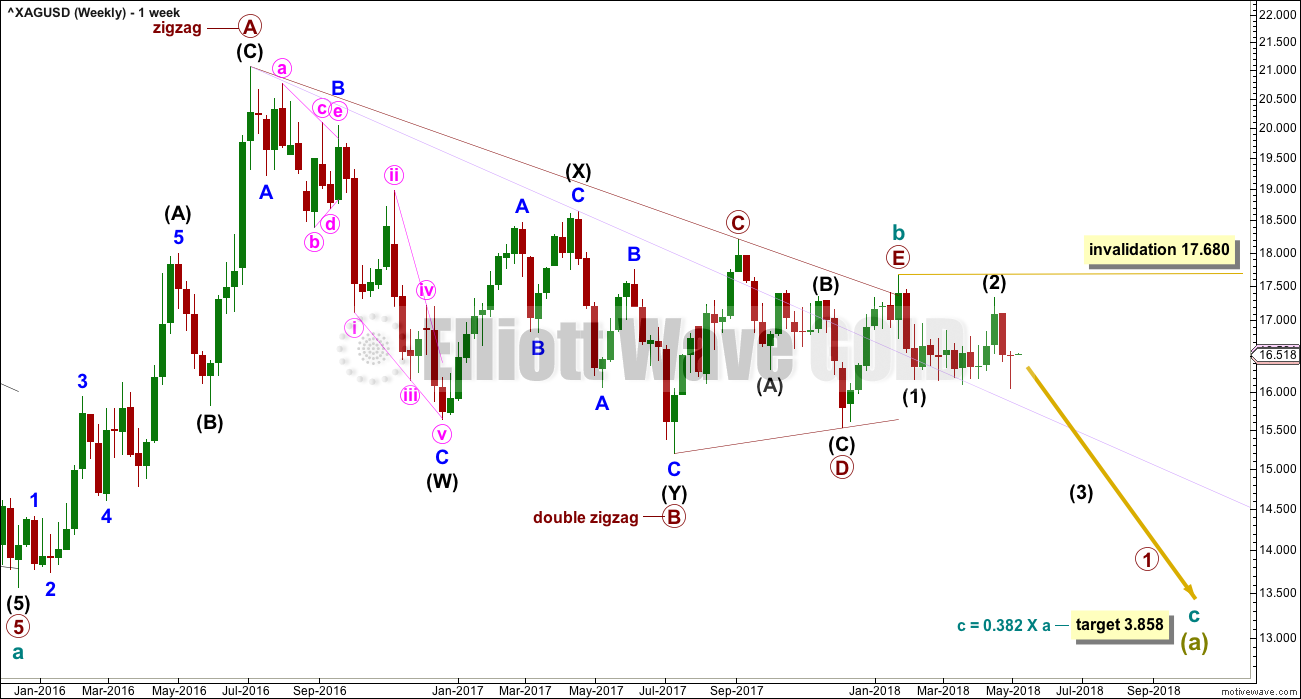
The main wave count expects that the bear market, which began from the April 2011 high, is incomplete.
Cycle wave a is seen as a five wave impulse for this main wave count. There are multiple corrective structures possible still for cycle wave b.
This first weekly chart sees cycle wave b as a now possibly complete regular contracting triangle.
Primary wave E of the triangle may have ended with an overshoot of the A-C trend line. If this wave count is correct, then price should have reversed already. Within the new downwards trend, no second wave correction may move beyond the start of the first wave above 17.680.
DAILY CHART
Click chart to enlarge.
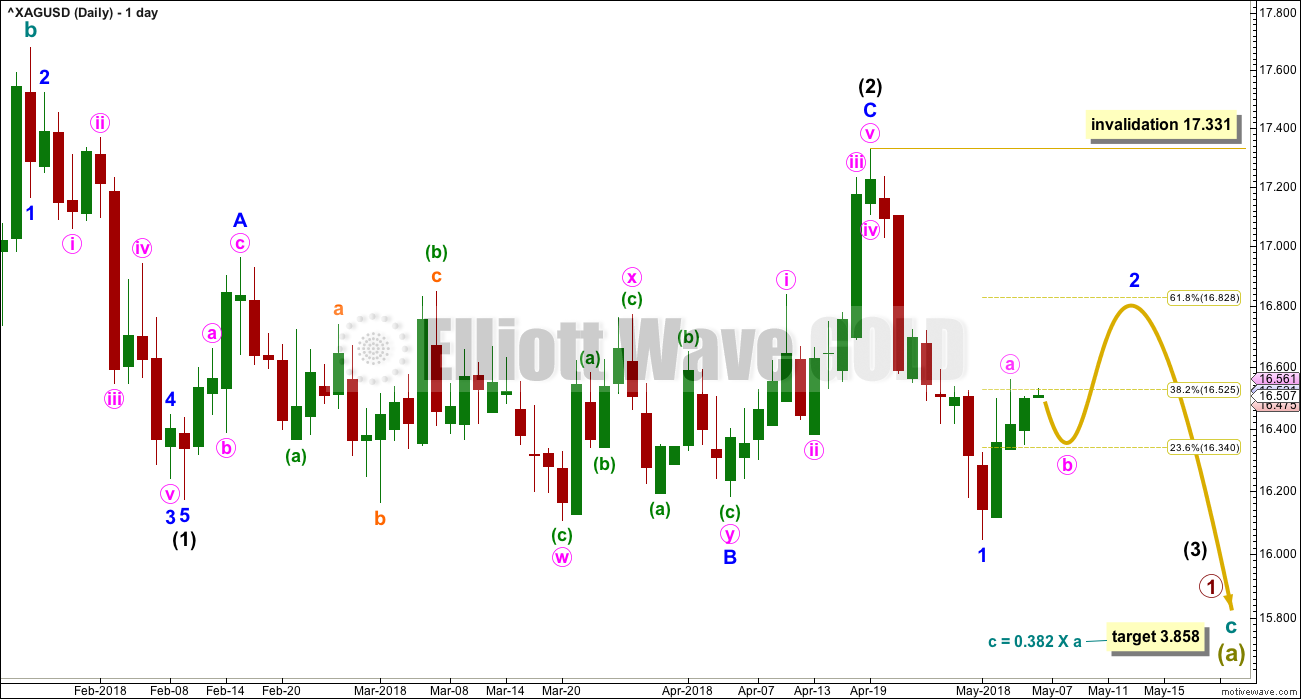
Intermediate wave (1) down subdivides well as a five wave structure.
Intermediate wave (2) may now be complete as a flat correction.
Minor wave B is a double zigzag. All subdivisions fit. However, the purpose of a second zigzag in a double is to deepen the correction when the first zigzag does not move price deep enough. Here, the second zigzag has failed to deepen the correction. This is not technically a truncation, but the effect is the same. This structure makes no sense because it has not achieved its purpose. This must necessarily reduce the probability of this wave count.
At this stage, this first wave count still has the lowest probability of the three wave counts published for Silver.
Within intermediate wave (3), minor wave 2 may not move beyond the start of its minor wave 1 above 17.331.
SECOND WAVE COUNT
WEEKLY CHART
Click chart to enlarge.
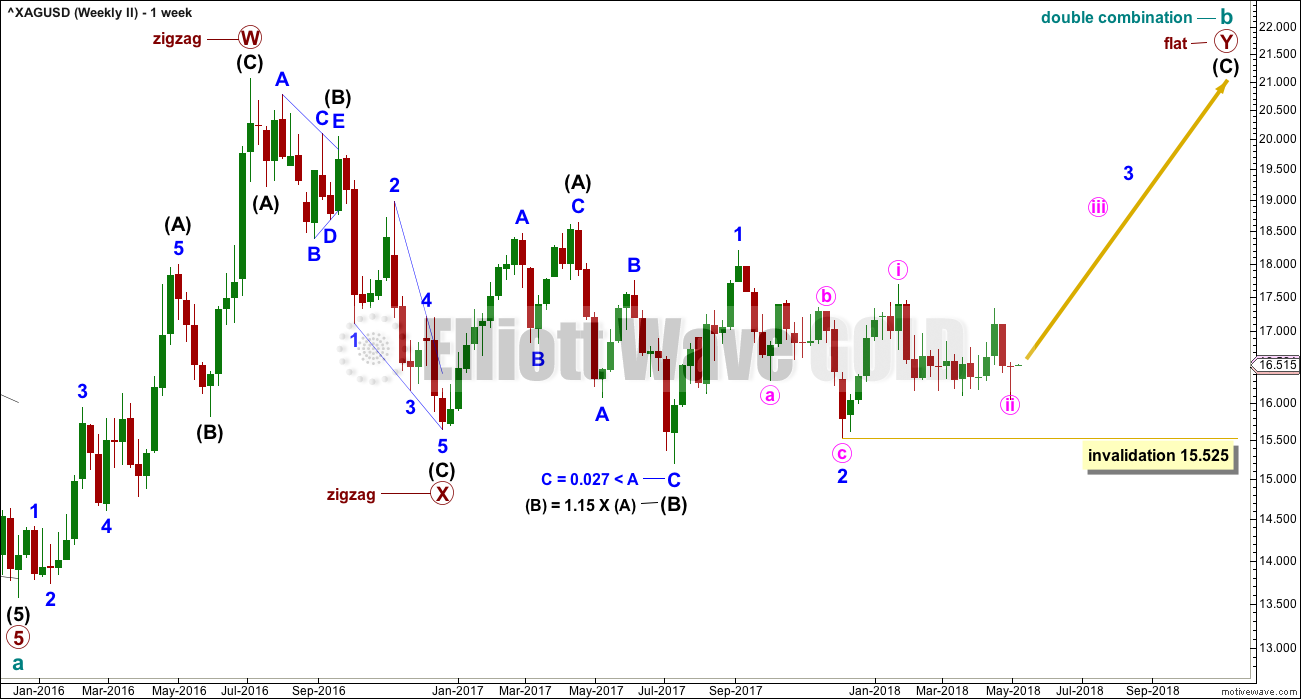
Cycle wave b may be completing as a double combination: zigzag – X – flat. The second structure, a flat correction for primary wave Y, may be underway.
Within a flat correction, intermediate wave (B) must retrace a minimum 0.9 length of intermediate wave (A) at 15.938. Intermediate wave (B) has met this minimum requirement; the rule for a flat correction is met. Intermediate wave (B) is longer than 1.05 times the length of intermediate wave (A) indicating this may be an expanded flat. Expanded flat corrections are the most common type. Normally their C waves are 1.618 or 2.618 the length of their A waves.
The purpose of combinations is to take up time and move price sideways. To achieve this purpose the second structure in the double normally ends about the same level as the first.
While the combination wave count at the weekly chart level does not currently work for Gold, it does still work for Silver. They do not have to complete the same structures for cycle wave b, and fairly often their structures are different.
Intermediate wave (C) for this wave count is starting out slowly, with deep time consuming second wave corrections. This may indicate very strong upwards movement ahead, with a time consuming and strong impulse to complete.
If minute wave ii continues lower, it may not move beyond the start of minute wave i below 15.525.
DAILY CHART
Click chart to enlarge.
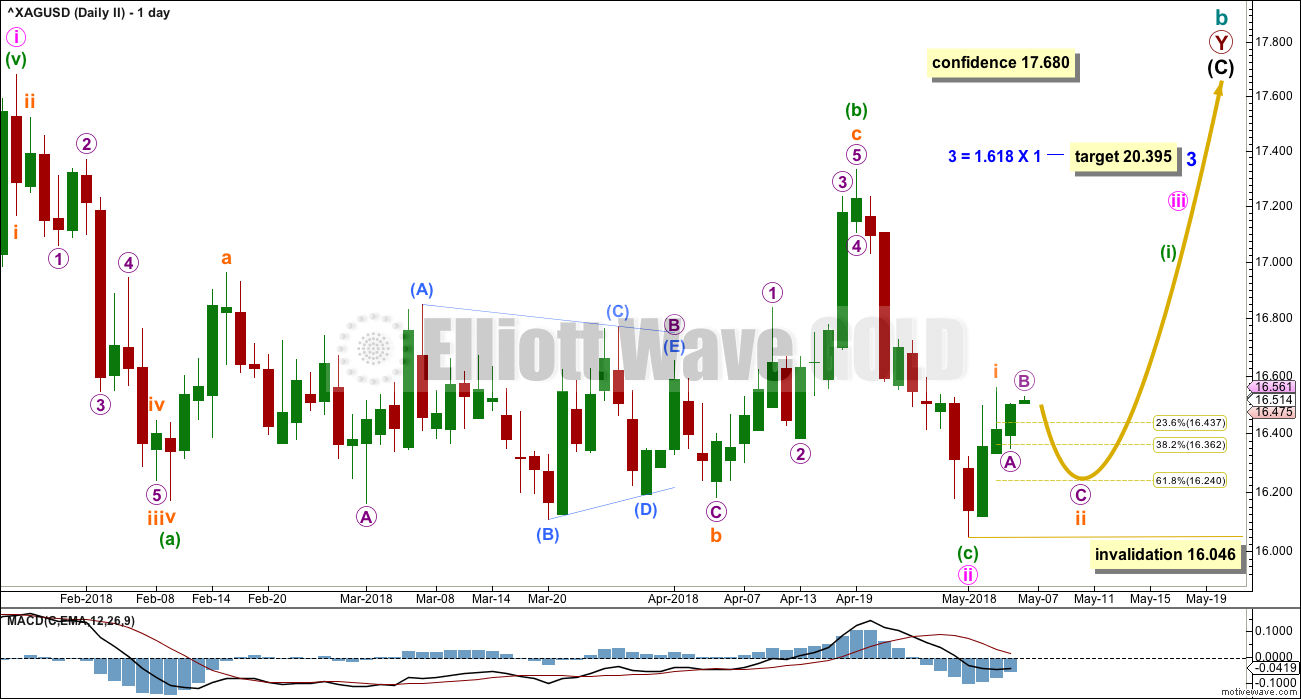
Minute wave ii again looks likely to be over. Minute wave iii may only subdivide as an impulse.
If minute wave ii continues any further, it may not move beyond the start of minute wave i below 15.525.
This wave count now expects an increase in upwards momentum as a third wave at two degrees begins.
ALTERNATE WAVE COUNT
WEEKLY CHART
Click chart to enlarge.
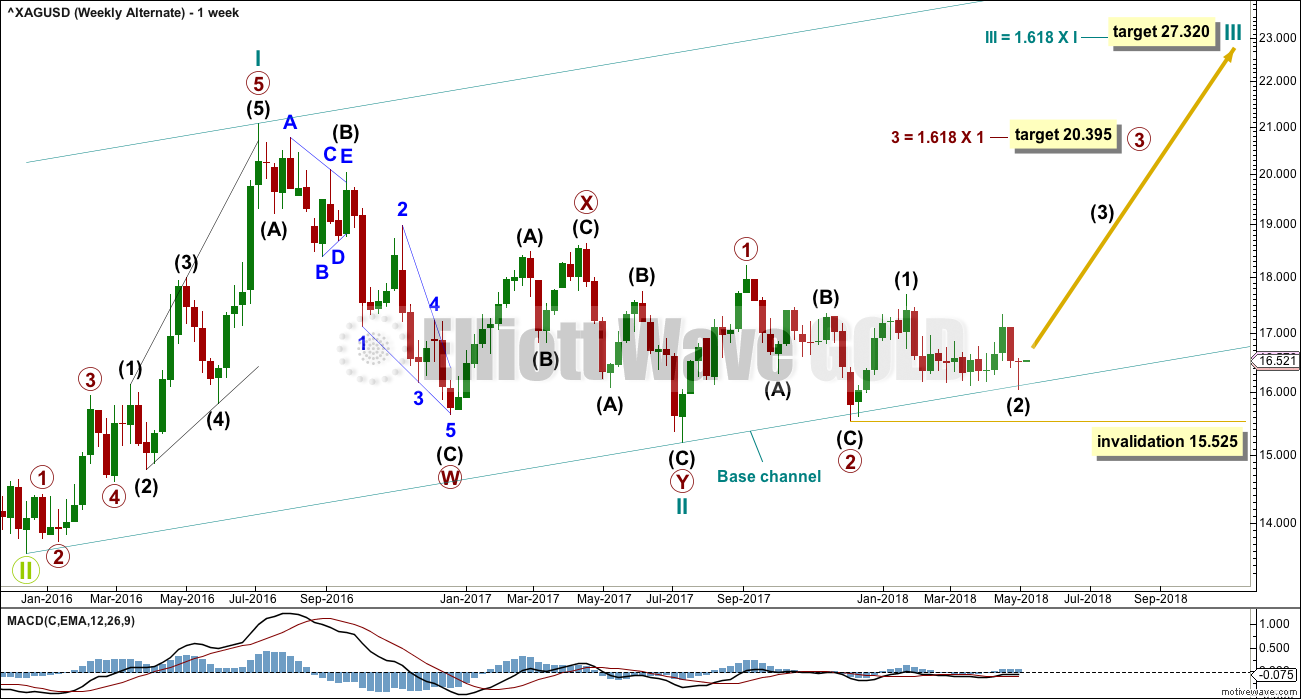
This alternate wave count looks at the possibility that the bear market may be over for Silver and a new bull market may have begun.
A series of three overlapping first and second waves may now be complete for cycle waves I and II, primary waves 1 and 2, and intermediate waves (1) and (2).
A third wave now at three large degrees may be beginning.
Targets calculated for third waves assume the most common Fibonacci ratios to their respective first waves. As price approaches each target, if the structure is incomplete or price keeps rising through the target, then the next Fibonacci ratio in the sequence would be used to calculate a new target.
Within primary wave 3, intermediate wave (2) may not move beyond the start of intermediate wave (1) below 15.525.
The large base channel about cycle waves I and II nicely shows where primary wave 2 found support. It also last week nicely showed where intermediate wave (2) found support. A lower degree second wave correction should find support (in a bull market) about a base channel drawn about a first and second wave one or more degrees higher. If this base channel is breached at the daily chart level with one full daily candlestick below and not touching it, then the probability of this alternate wave count would be reduced.
DAILY CHART
Click chart to enlarge.
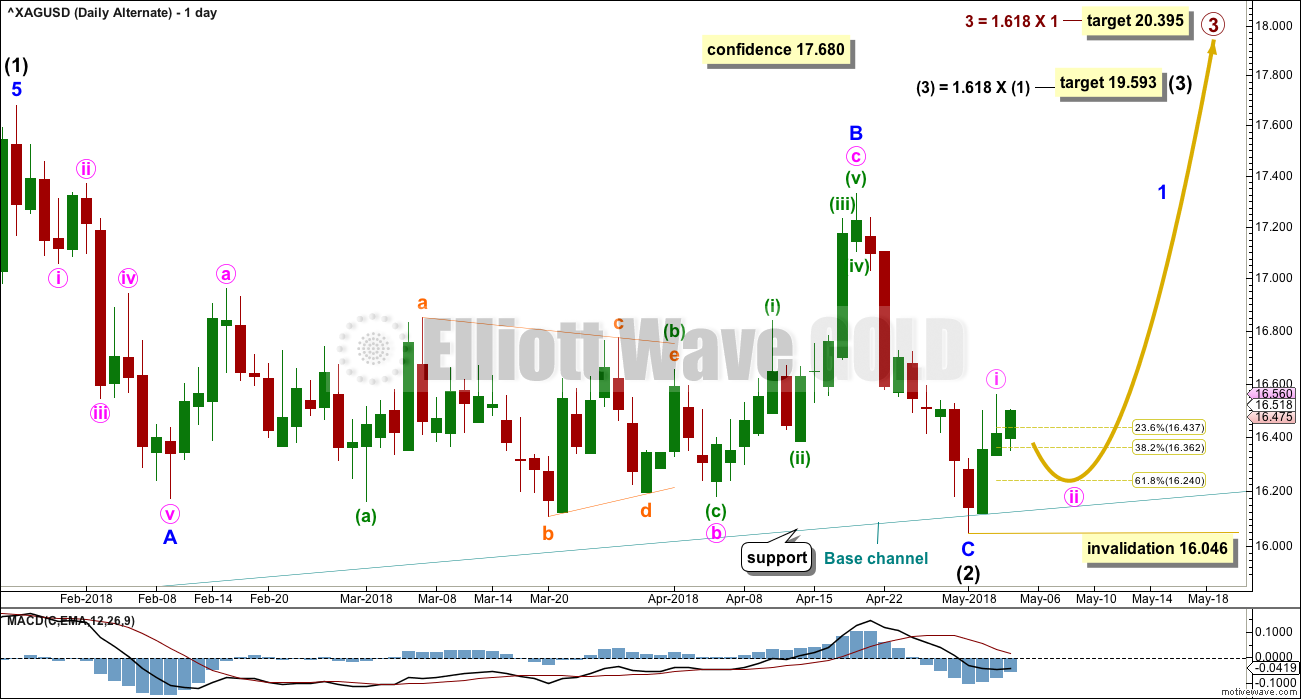
Intermediate wave (2) should again be over.
Intermediate wave (3) may only subdivide as an impulse. Minor wave 1 may be incomplete.
Minute wave ii may not move beyond the start of minute wave i below 16.046. Minute wave ii may end about the 0.618 Fibonacci ratio of minute wave i.
TECHNICAL ANALYSIS
WEEKLY CHART
Click chart to enlarge. Chart courtesy of StockCharts.com.
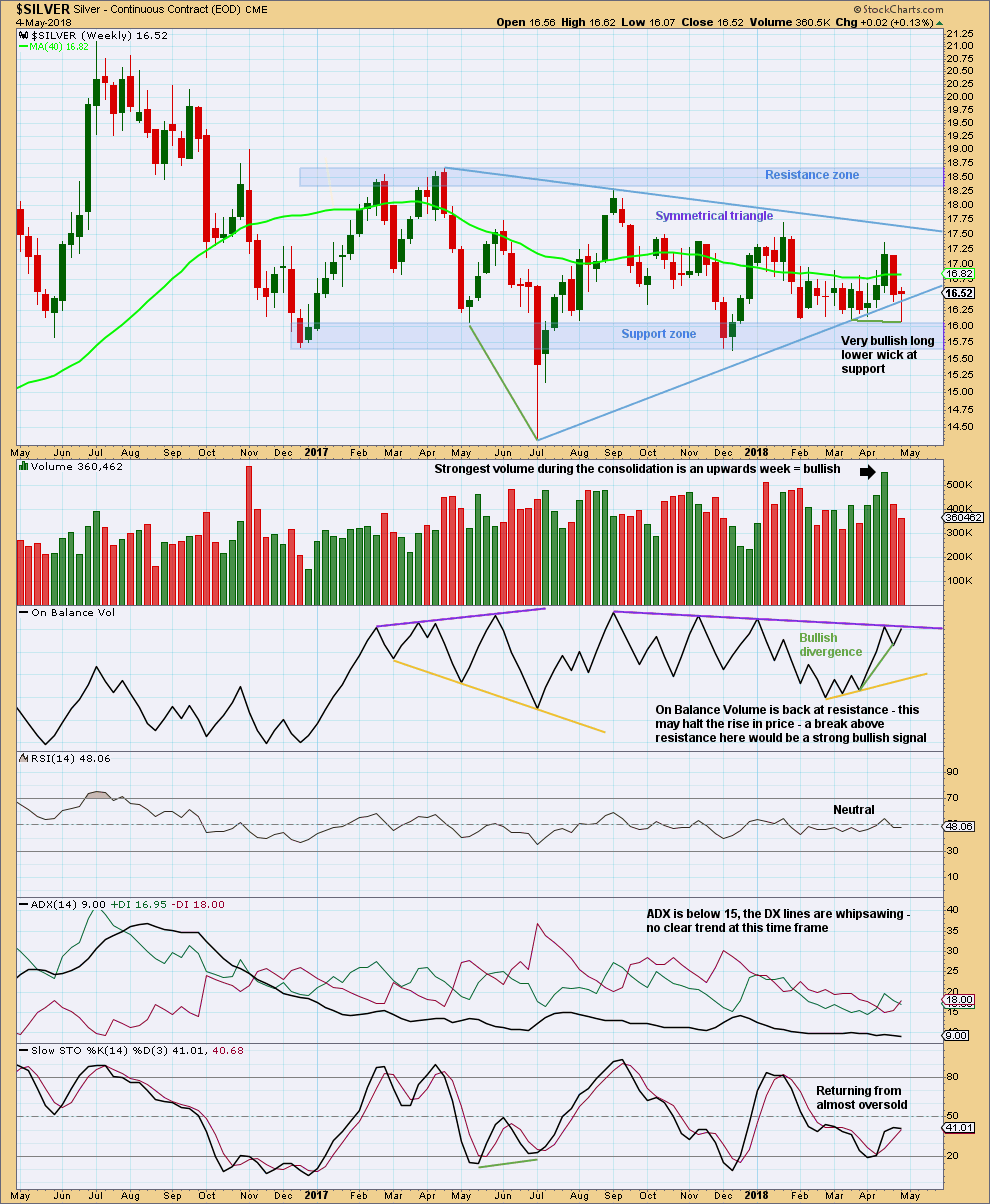
Price remains within the support and resistance zone.
Because this last weekly candlestick has such a long lower wick, finding support right at the upper edge of the support zone, it looks fairly likely that a low is in place at least short term.
Price this week made a new low very slightly below the low six weeks ago, but On Balance Volume has a corresponding low much higher. This bullish divergence is strong and supports the second and third Elliott wave counts.
DAILY CHART
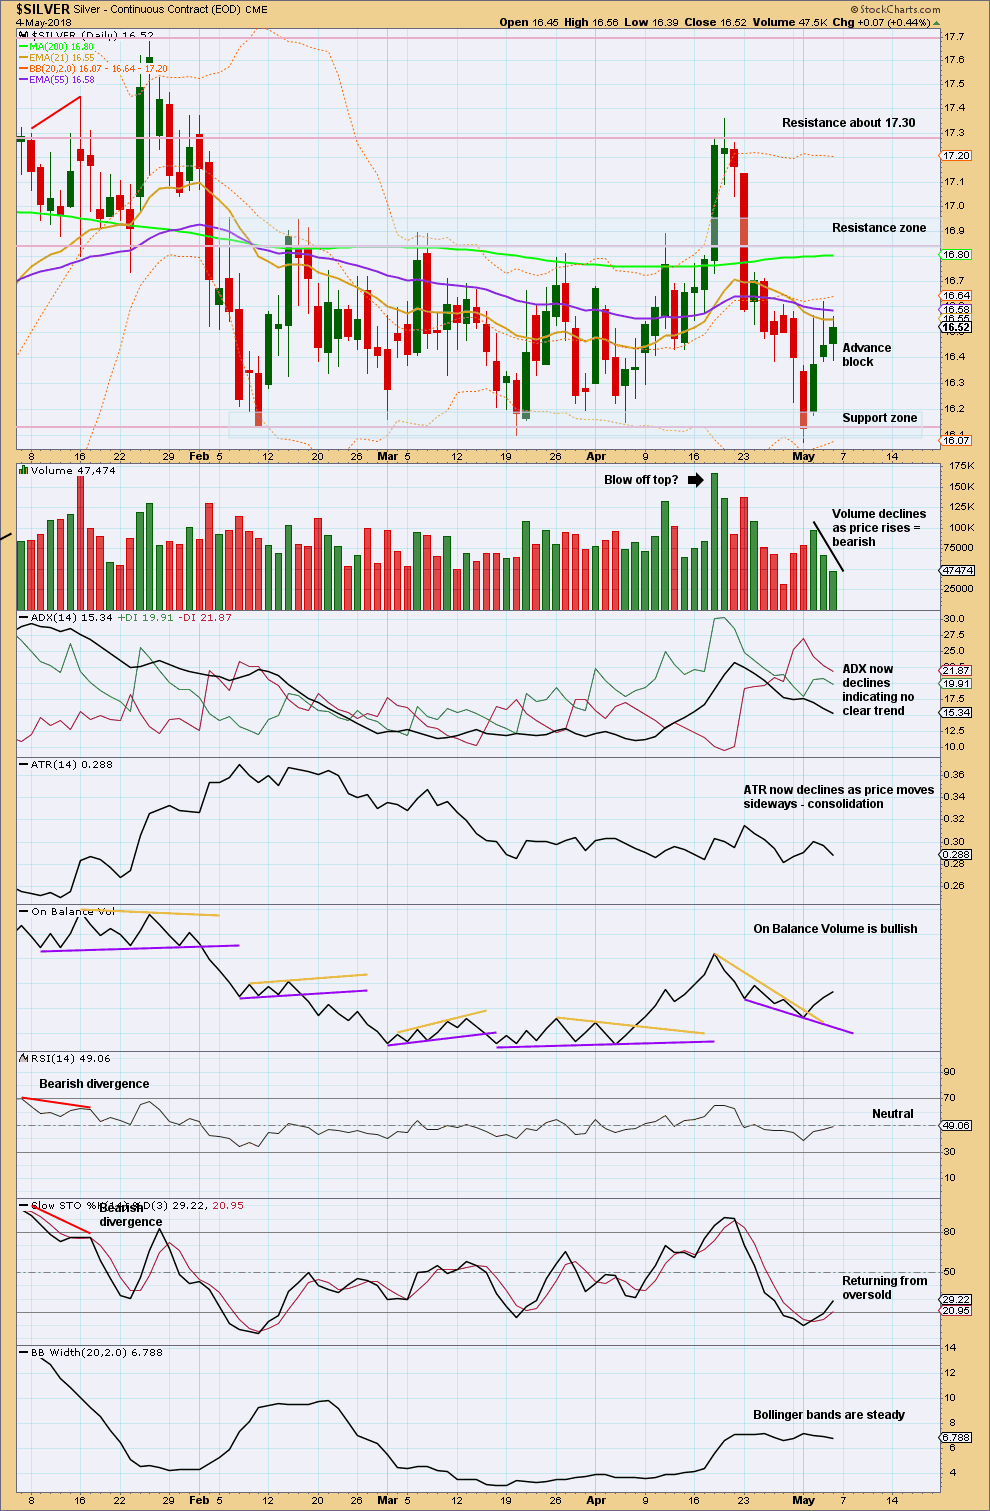
Click chart to enlarge. Chart courtesy of StockCharts.com.
The Advance Block candlestick pattern is reasonable, but not as clear as it could be. The third candlestick has a larger real body than the second. It still does suggest some weakness, particularly in conjunction with sharply declining volume and Stochastics bouncing up from oversold.
Published @ 09:28 p.m. EST on 6th May, 2018.