
Last week’s analysis expected an upwards trend in place, and suggested pullbacks are an opportunity to join the trend.
Summary: This pullback may find support at the lilac trend line on the weekly and daily charts. If it does not end there, then the target would be at 63.77.
The mid term target is now at 97.92. A longer term target is at 106.25.
Always practice good risk management as the most important aspect of trading. Always trade with stops and invest only 1-5% of equity on any one trade. Failure to manage risk is the most common mistake new traders make.
New updates to this analysis are in bold.
MAIN WAVE COUNT
MONTHLY CHART
Click chart to enlarge.
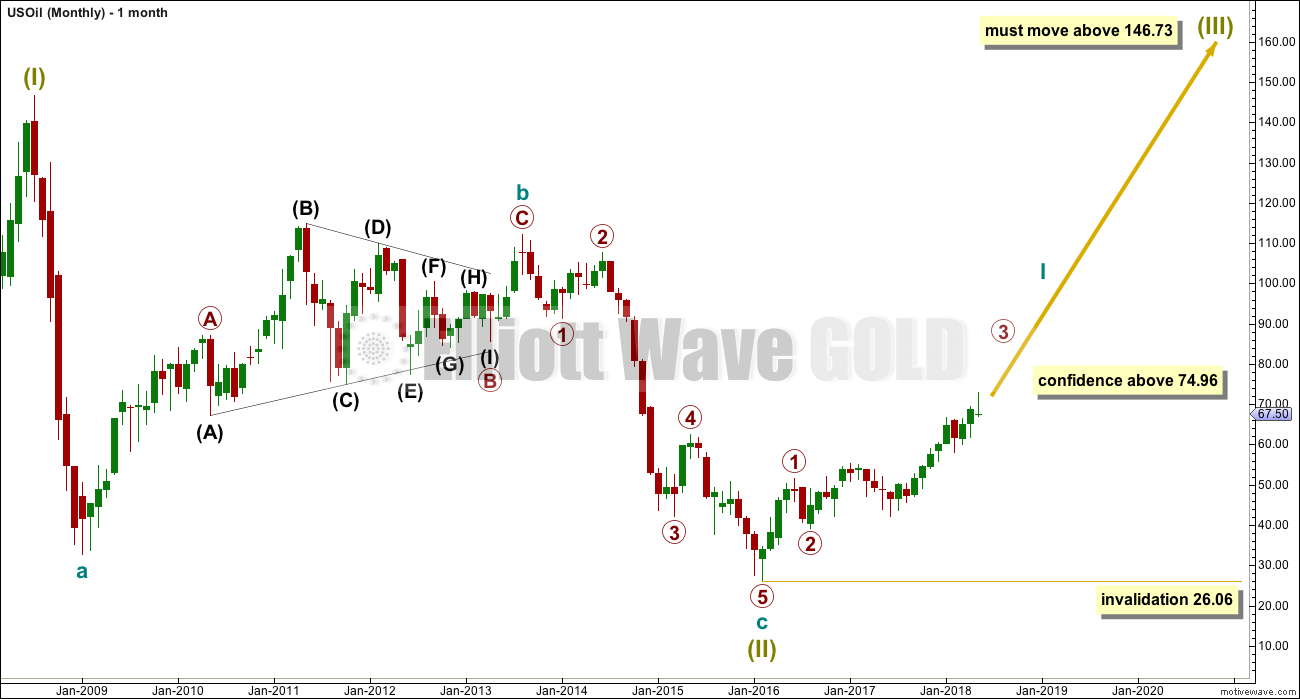
It is possible that the bear market for Oil is over and a new bull market is in the very early stages.
A huge zigzag down to the last low may be complete and is labelled here Super Cycle wave (II).
Cycle wave b must be seen as complete in August 2013 for this wave count to work. It cannot be seen as complete at the prior major swing high in May 2011.
Cycle wave b is seen as a zigzag, and within it primary wave B is seen as a running contracting triangle. These are fairly common structures, although nine wave triangles are uncommon. All subdivisions fit.
Primary wave C moves beyond the end of primary wave A, so it avoids a truncation. But it does not have to move above the price territory of primary wave B to avoid a truncation, which is an important distinction.
If cycle wave b begins there, then cycle wave c may be seen as a complete five wave impulse.
Super Cycle wave (III) must move beyond the end of Super Cycle wave (I). It must move far enough above that point to allow room for a subsequent Super Cycle wave (IV) to unfold and remain above Super Cycle wave (I) price territory.
Cycle wave I may be incomplete. It may be ready to move through the middle and end of its third wave at primary degree, which may be the strongest upwards portion of cycle wave I; a strong increase in momentum and range may be ahead.
When cycle wave I is complete, then cycle wave II may be a deep correction that may not move beyond the start of cycle wave I below 26.06.
Data from FXCM for USOil does not go back to the beginning of Super Cycle wave (I). Without an accurate known length of Super Cycle wave (I) a target cannot be calculated for Super Cycle wave (III) to end using Fibonacci ratios. The target for Super Cycle wave (III) may be calculated when cycle waves I, II, III and IV within it are complete. That cannot be done for many years.
WEEKLY CHART
Click chart to enlarge.
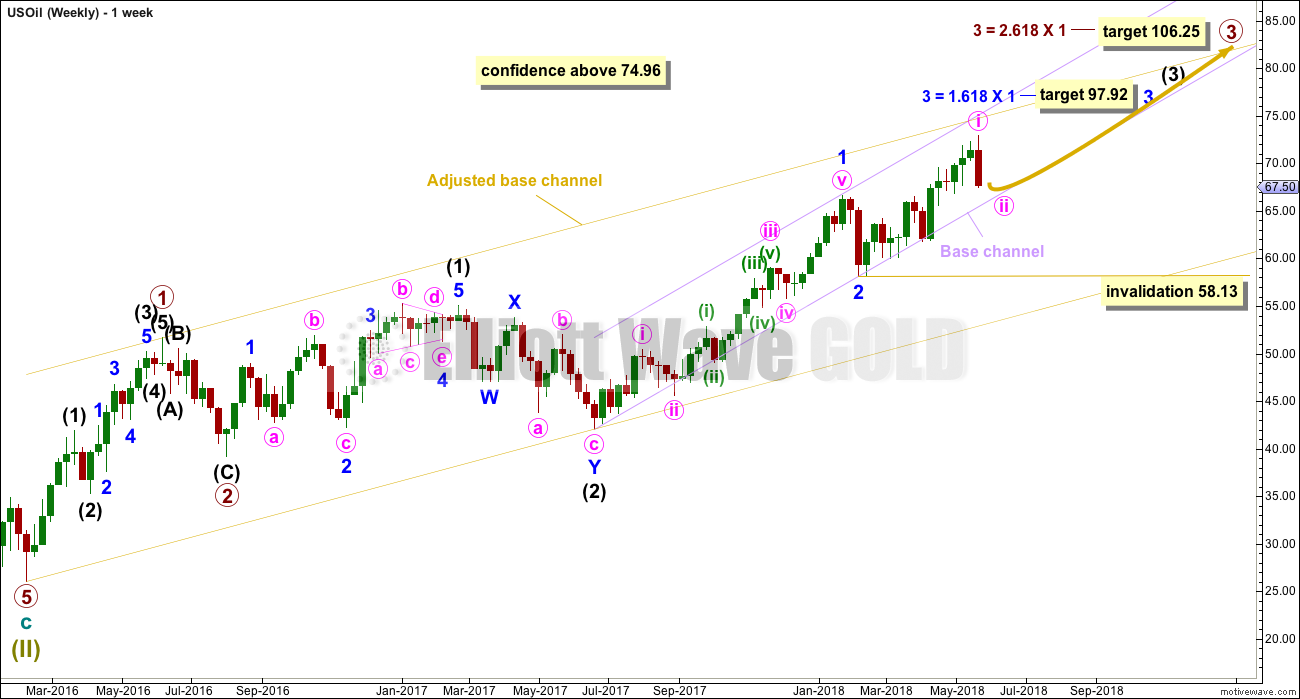
If a new bull market is in the very early stages for Oil, then it may have begun with two overlapping first and second waves at primary then at intermediate degree.
Primary wave 3 may only subdivide as an impulse, and within it intermediate wave (3) may be incomplete.
Within intermediate wave (3), only minor waves 1 and 2 may be complete. Minor wave 3 may have just begun. The most common Fibonacci ratio is used to calculate a target for it to end. Minor wave 3 may only subdivide as an impulse, and within it minute wave ii may not move beyond the start of minute wave i below 58.13.
A target is calculated for primary wave 3 to end, which fits with the lower target for minor wave 3 to end.
A base channel is added in lilac to minor waves 1 and 2. Along the way up, lower degree second wave corrections may find support about the lower edge of this channel. Base channels most often work in this way but not always.
Commodities typically exhibit swift and strong fifth waves within their impulses, and this tendency is particularly common for third wave impulses. Intermediate wave (5) may be a swift strong upwards wave when it arrives.
DAILY CHART
Click chart to enlarge.
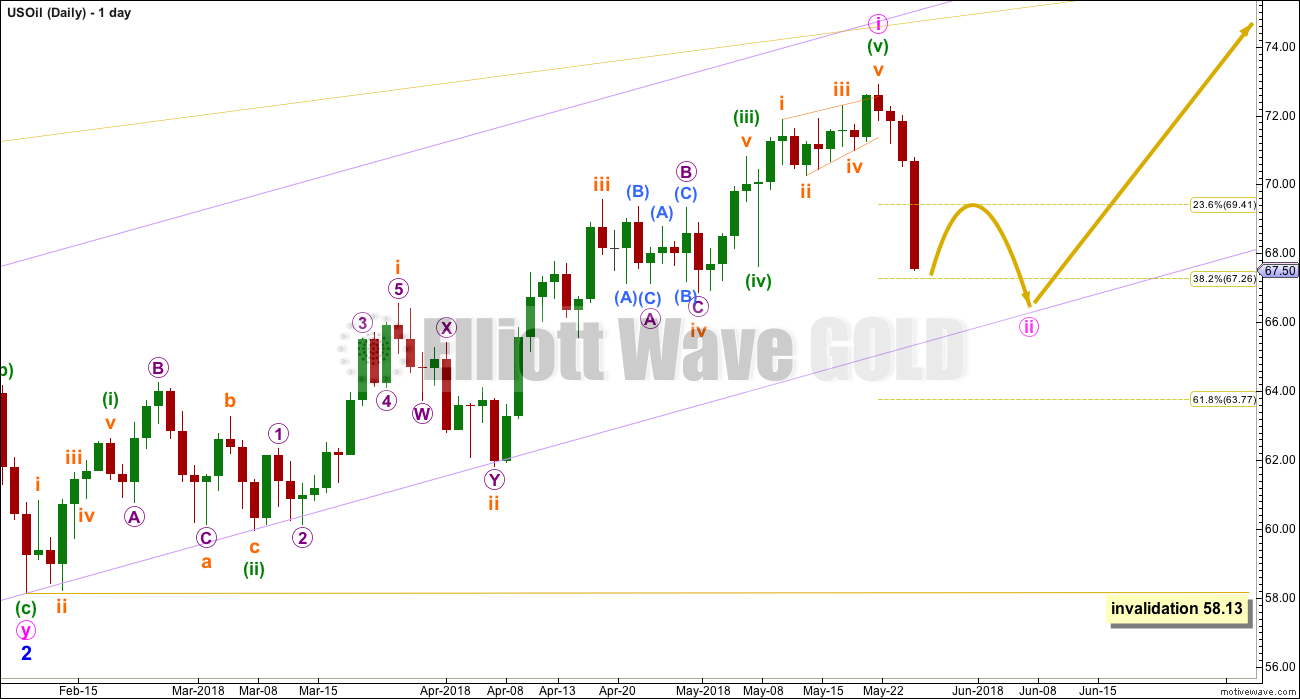
It is possible to see another impulse complete at the last high. This may be minute wave i.
Strong downwards movement for Friday’s session strongly suggests that this wave count is more likely. The first daily chart from last week’s analysis is discarded based upon a very low probability.
If minute wave ii ends about the lower edge of the lilac base channel, which is copied over from the weekly chart, then it may end just below the 0.382 Fibonacci ratio of minute wave i. At this stage, the strong upwards pull of the middle of a third wave at three degrees may force minute wave ii to be more shallow than second waves often are.
If minute wave ii breaks below the lower edge of the lilac base channel, then the next target for it to end would be about the 0.618 Fibonacci ratio of minute wave i at 63.77.
ALTERNATE WAVE COUNT
MONTHLY CHART
Click chart to enlarge.
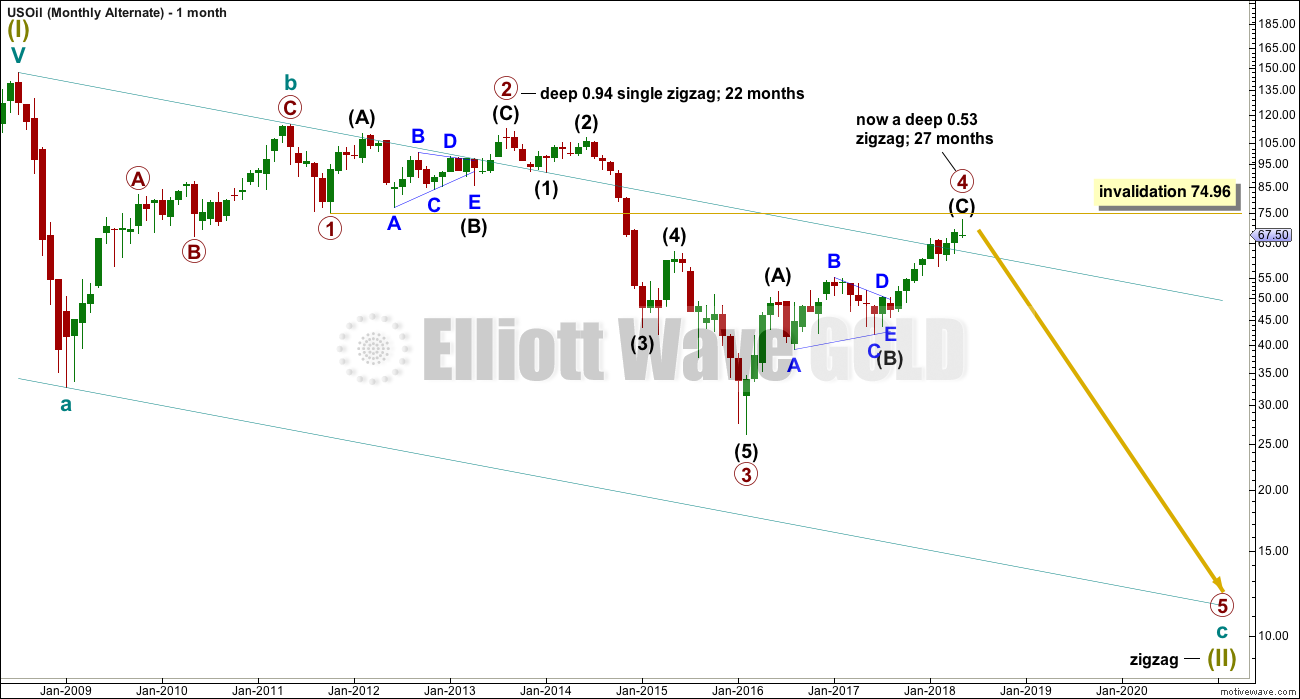
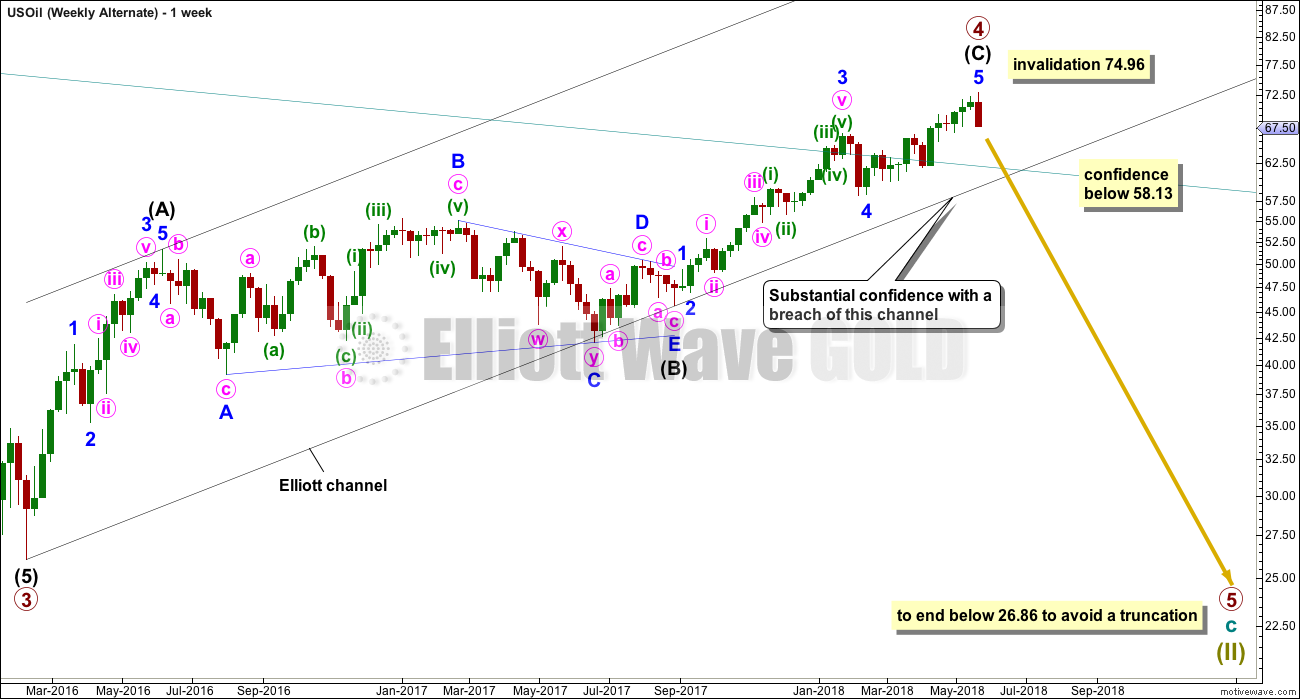
Within the bear market, cycle wave b is seen as ending in May 2011. Thereafter, a five wave structure downwards for cycle wave c begins.
Primary wave 1 is a short impulse lasting five months. Primary wave 2 is a very deep 0.94 zigzag lasting 22 months. Primary wave 3 is a complete impulse with no Fibonacci ratio to primary wave 1. It lasted 30 months.
There is now little alternation in depth between primary waves 2 and 4. Primary wave 2 is very deep, but primary wave 4 is also now deep. There is inadequate alternation in structure, both are zigzags. The lack of alternation in this wave count must reduce its probability. So far primary wave 4 has lasted 27 months. At this stage, there is still reasonable proportion between primary waves 2 and 4.
Primary wave 4 may not move into primary wave 1 price territory above 74.96.
The wider Elliott channel (teal) about this whole movement may offer support to primary wave 5.
WEEKLY CHART
Click chart to enlarge.
This wave count now expects a huge trend change for a new wave down for primary wave 5, which may last about a year or so. Primary wave 5 would be likely to make at least a slight new low below 26.86 to move below the end of primary wave 3 and avoid a truncation.
An Elliott channel is added to this possible zigzag for primary wave 4. A breach of the lower edge of this channel would provide a very strong indication that primary wave 4 should be over and primary wave 5 should be underway. Look out for some support on the way down, perhaps a short term bounce about the lower edge of the channel.
A new low now below 58.13 would invalidate the main wave count and in turn offer some confidence to this alternate.
DAILY CHART
Click chart to enlarge.
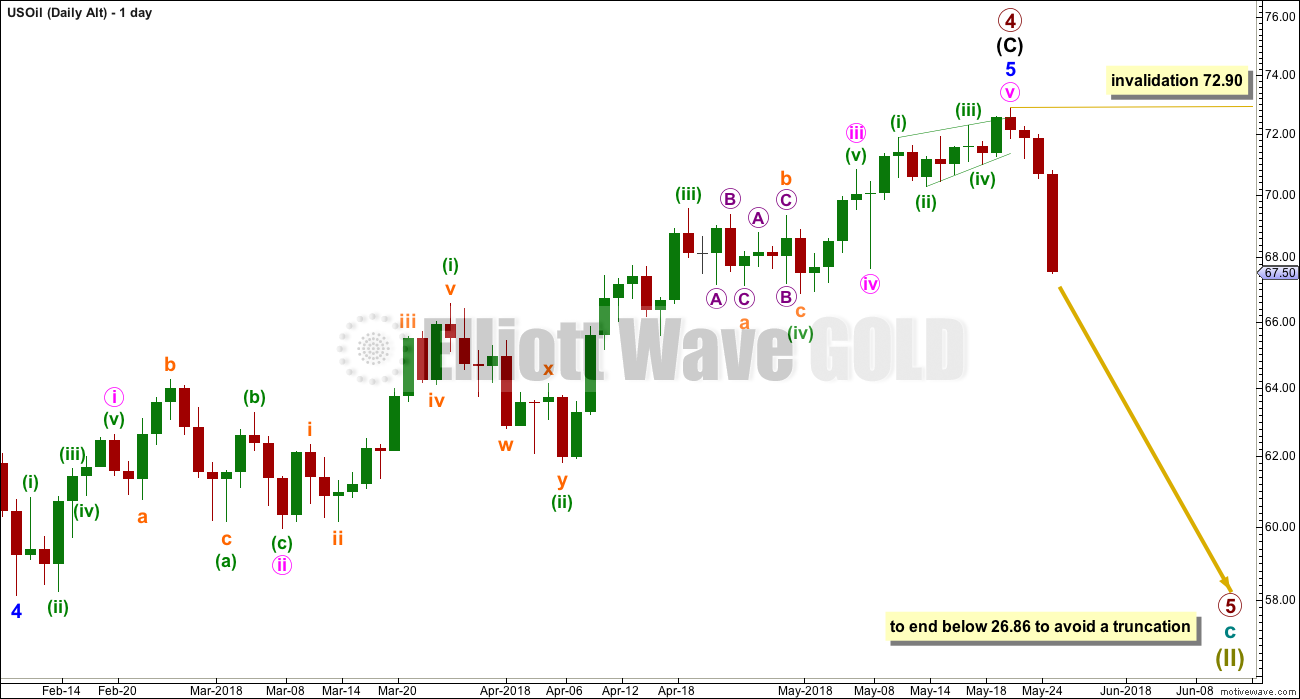
The subdivisions of the last upwards wave are now seen in the same way for both wave counts. For this alternate, it may have been a complete impulse for minor wave 5.
This wave count now expects a new wave down at primary degree. That should begin with a five down on the daily chart. Within the new wave down, no second wave correction may move beyond the start of its first wave above 72.90.
TECHNICAL ANALYSIS
MONTHLY CHART
Click chart to enlarge. Chart courtesy of StockCharts.com.
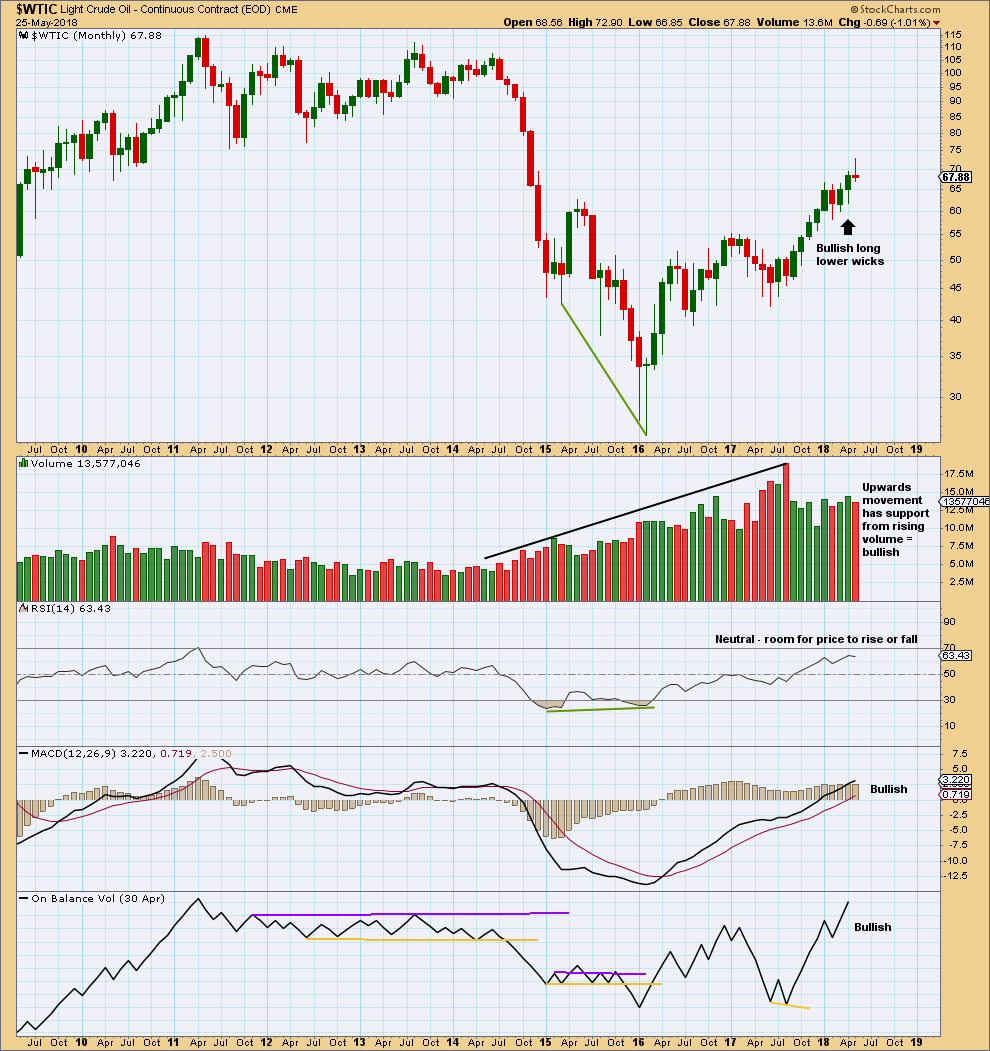
For the last four months all now complete, the volume profile is bullish. There are now three completed monthly candlesticks with long lower wicks.
This chart is overwhelmingly bullish. It supports the main Elliott wave count.
Strong volume for the month of June 2017 may have been a selling climax. This is typical behaviour of commodities.
The strongest recent volume is a downwards month for August 2017. This is the only bearish indication on this chart.
DAILY CHART
Click chart to enlarge. Chart courtesy of StockCharts.com.
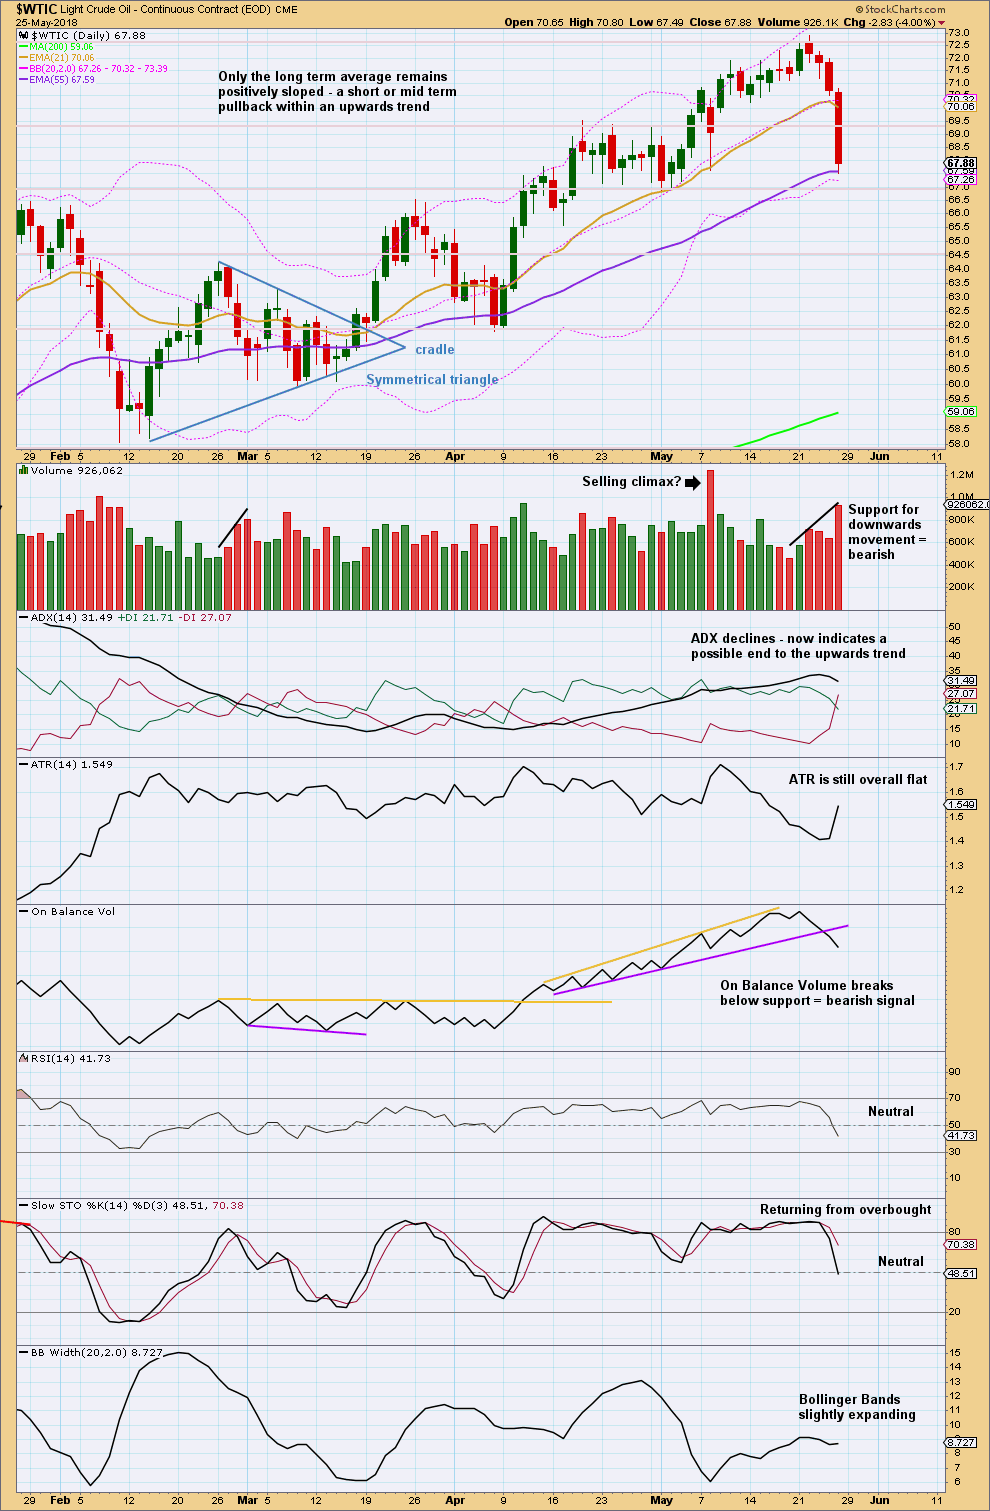
So far this pullback is finding support about the Fibonacci 55 day moving average. But it does not look complete yet: Volume and On Balance Volume are bearish, and the last candlestick is very bearish. Do not expect this pullback to move in a straight line; it may be choppy and overlapping.
Only when a long lower wick on a daily candlestick develops (or a cluster of them), or Stochastics reaches oversold and then exhibits some divergence with price, may this pullback be over.
Next support is about 66.85, and below that about 64.50.
Published @ 07:00 p.m. EST on 26th May, 2018.
Lara, do you have a Grand Supercycle chart/count for oil?
I found this long term chart. When you look at the “commodity cycle” chart from J Kennedy that I posted on the gold thread, it looks like oil also follows it pretty darn good all the way back into the 1800’s. 10 years Bull, then 20 years Bear.
If that’s the case, then one would think that oil would possibly be in for much more sideways type action than going straight for new highs. If price stops before your bear count invalidates, there could be other options like a flat or triangle.
Fundamentally, unless there is a major war, etc there seems to be enough oil supply for the coming years when you consider the rise of electric vehicles.
I guess my main reason for this post is I’m wondering what your thoughts are on the 10/20 years commodity cycle. Your long term gold counts seem to align better with the cycle than your long term oil counts. Thanks
The data I’m using from FXCM for US Oil only goes back to 1986, so I don’t have enough data to do a Grand Super Cycle analysis. So no, unfortunately I don’t have one.
The bearish case for Oil could of course still be correct. Price hasn’t made a new high above 74.96 yet.
Or for the bullish case, cycle I could end more quickly than expected and then cycle II could be a time consuming and deep correction.
Either of those ideas could fit with a bear market continuing for some time for Oil.
OK. Thanks