
As expected, downwards movement continues towards the Elliott wave target.
Summary: The short term target is at 1,226 for a multi day to multi week consolidation.
The mid term target is 1,216 – 1,211. Downwards movement may be limited to no lower than 1,123.08.
Always trade with stops to protect your account. Risk only 1-5% of equity on any one trade.
New updates to this analysis are in bold.
Grand SuperCycle analysis is here.
Last historic analysis with several monthly and weekly charts is here, video is here.
At this time, three wave counts remain for cycle wave b: a triangle, a flat and a combination. All three wave counts expect downwards movement to continue from here. While this direction does not diverge between them, only one wave count shall be published daily.
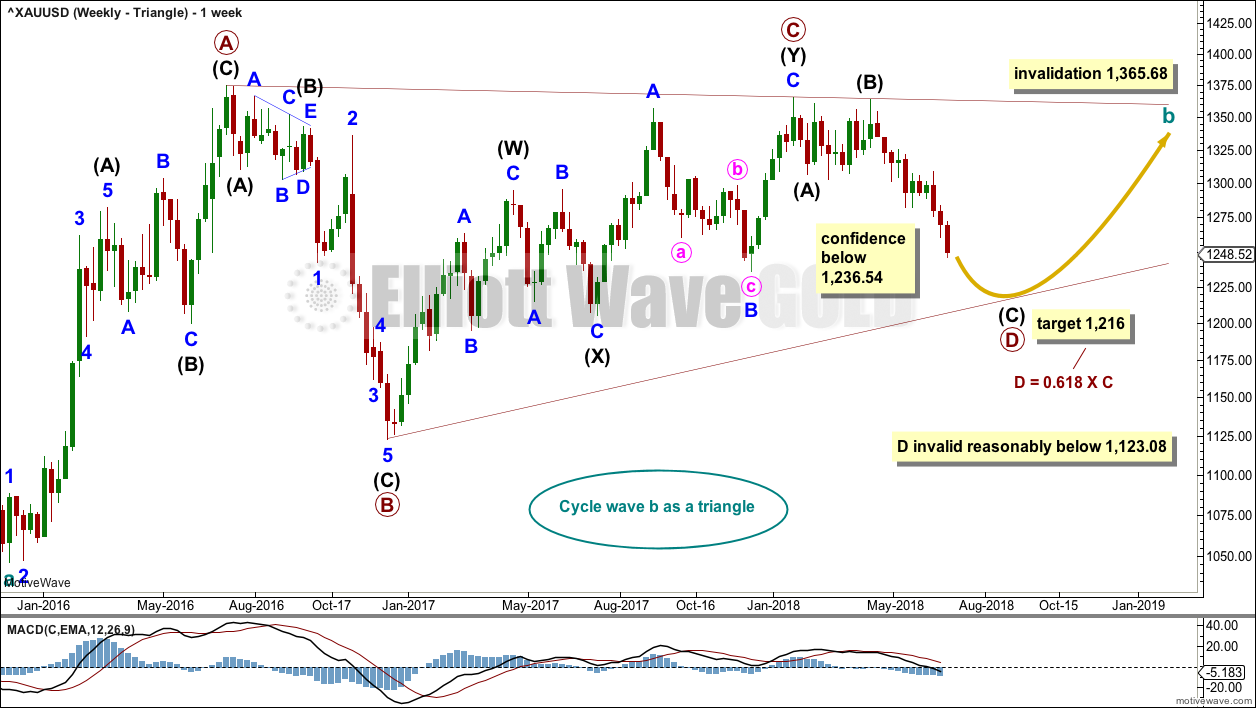
WEEKLY CHART – TRIANGLE
Click chart to enlarge.
The triangle so far has the best fit and look. If price shows a combination or flat may be more likely, then those ideas may be published on a daily basis. The flat and combination ideas expect movement reasonably below 1,123.08, or perhaps a new low below 1,046.27.
Cycle wave b may be an incomplete triangle. The triangle may be a contracting or barrier triangle, with a contracting triangle looking much more likely because the A-C trend line does not have a strong slope. A contracting triangle could see the B-D trend line have a stronger slope, so that the triangle trend lines converge at a reasonable rate. A barrier triangle would have a B-D trend line that would be essentially flat, and the triangle trend lines would barely converge.
Within a contracting triangle, primary wave D may not move beyond the end of primary wave B below 1,123.08. Within a barrier triangle, primary wave D may end about the same level as primary wave B at 1,123.08, so that the B-D trend line is essentially flat. Only a new low reasonably below 1,123.08 would invalidate the triangle.
Within both a contracting and barrier triangle, primary wave E may not move beyond the end of primary wave C above 1,365.68.
Four of the five sub-waves of a triangle must be zigzags, with only one sub-wave allowed to be a multiple zigzag. Primary wave C is the most common sub-wave to subdivide as a multiple, and this is how primary wave C for this example fits best.
Primary wave D must be a single structure, most likely a zigzag.
One triangle sub-wave tends to be close to 0.618 the length of its predecessor; this gives a target for primary wave D.
There are no problems in terms of subdivisions or rare structures for this wave count. It has an excellent fit and so far a typical look.
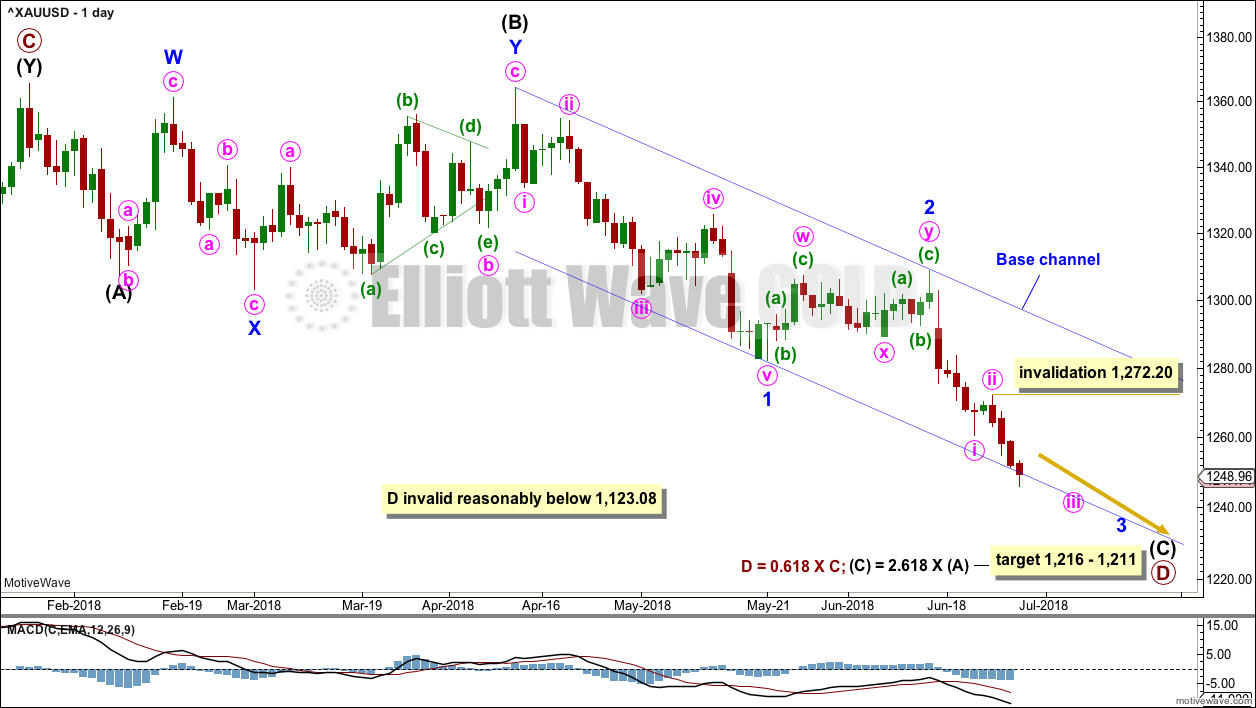
DAILY CHART – TRIANGLE
Click chart to enlarge.
Primary wave D may be unfolding lower as a single zigzag, and within it intermediate waves (A) and (B) may be complete.
The target is widened to a $5 zone calculated at two degrees. This should have a reasonable probability.
Within intermediate wave (C), it looks likely that minor wave 2 may now be over. Within minor wave 3, no second wave correction may move beyond the start of its first wave above 1,308.89.
This wave count now expects to see an increase in downwards momentum as a third wave unfolds.
Add a base channel about minor waves 1 and 2. Along the way down, bounces for lower degree second wave corrections may be expected to find resistance at the upper edge of the base channel. The middle to end of minor wave 3 may have the power to break below support at the lower edge of the base channel.
Gold, typical of commodities, often exhibits very swift and strong fifth waves. This tendency is particularly prevalent for its fifth waves to end third wave impulses. Look out for a possible selling climax to end one or both of minute wave iii and minor wave 3.
Within minute wave iii, no second wave correction may move beyond the start of its first wave above 1,272.20.
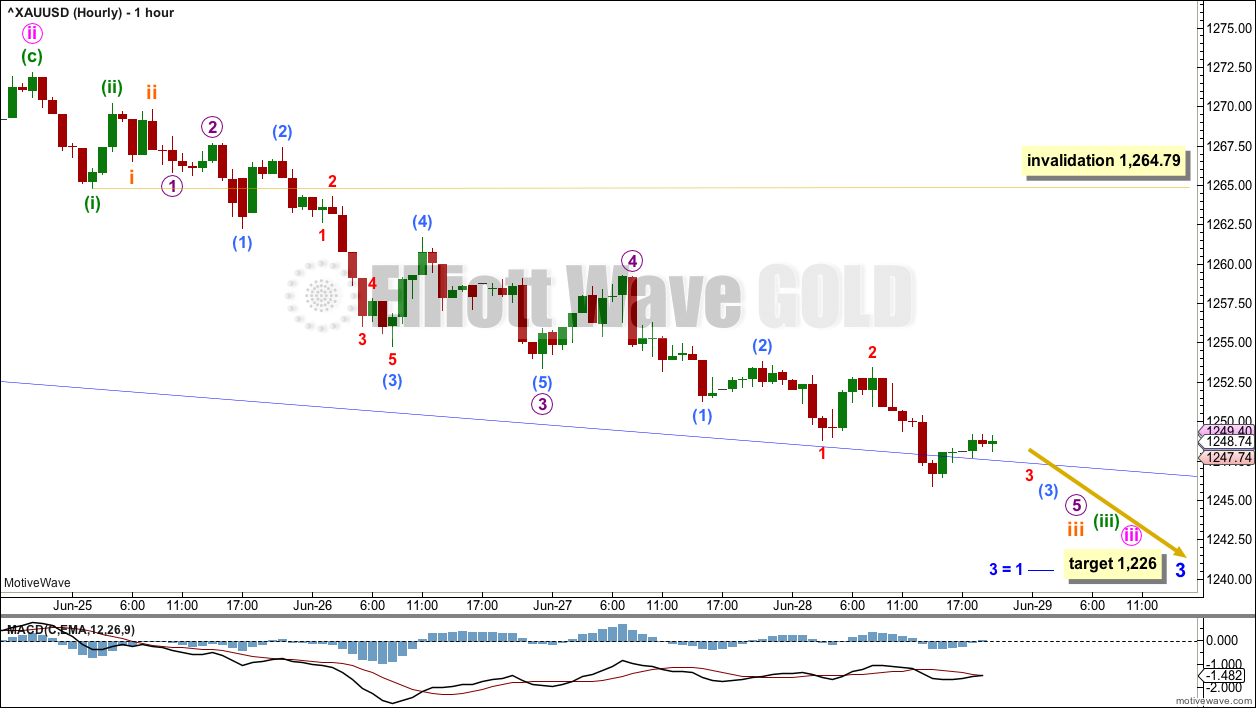
HOURLY CHART
Click chart to enlarge.
The base channel on the daily chart is copied over to this hourly chart.
Minor wave 3 may only subdivide as an impulse. The target for minor wave 3 to end is equality in length with minor wave 1, because minor wave 2 was shallow. This target fits with the lower target for intermediate wave (C) to end.
Within minor wave 3, minute waves i and ii may now be complete. Minute wave ii may have been a very shallow zigzag. The strong downwards pull of a third wave may have forced it to be more shallow than expected.
Price may now be moving towards the end of several third waves. There will be the possibility for price to move very strongly lower as each of these third waves end; any of the fifth waves to end these impulses may be strong and sharp.
Within minute wave iii, the upcoming correction for minuette wave (iv) may not move into minuette wave (i) price territory above 1,264.79.
The amount of overlapping in the last three days of downwards movement suggests that the structure is incomplete. It looks like it still needs more downwards movement to resolve this.
TECHNICAL ANALYSIS
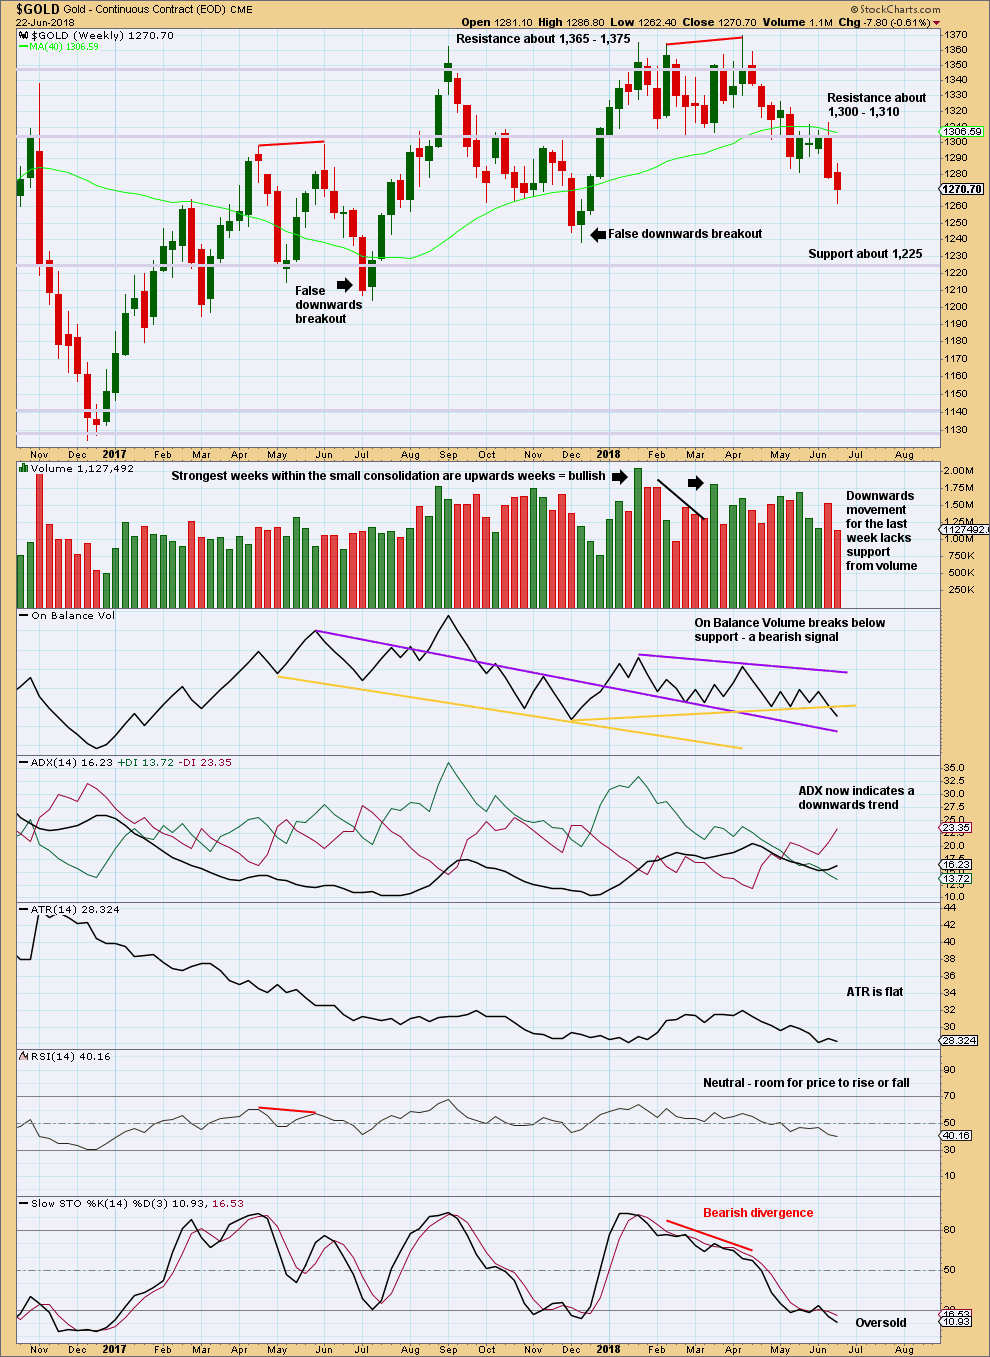
WEEKLY CHART
Click chart to enlarge. Chart courtesy of StockCharts.com.
On Balance Volume gave a reasonable bearish signal last week. The yellow support line, which is breached, has reasonable technical significance: it is reasonably long held, has been tested at least three times before, and has a shallow slope. This supports the new Elliott wave count, which expects more downwards movement from price here.
Stochastics may remain oversold for several weeks when Gold has a strong bear trend. There is a good example of this on the left hand side of the chart. Only would Stochastics indicate an end to the trend when it has been oversold and then exhibits bullish divergence with price. That is not the case here.
DAILY CHART
Click chart to enlarge. Chart courtesy of StockCharts.com.
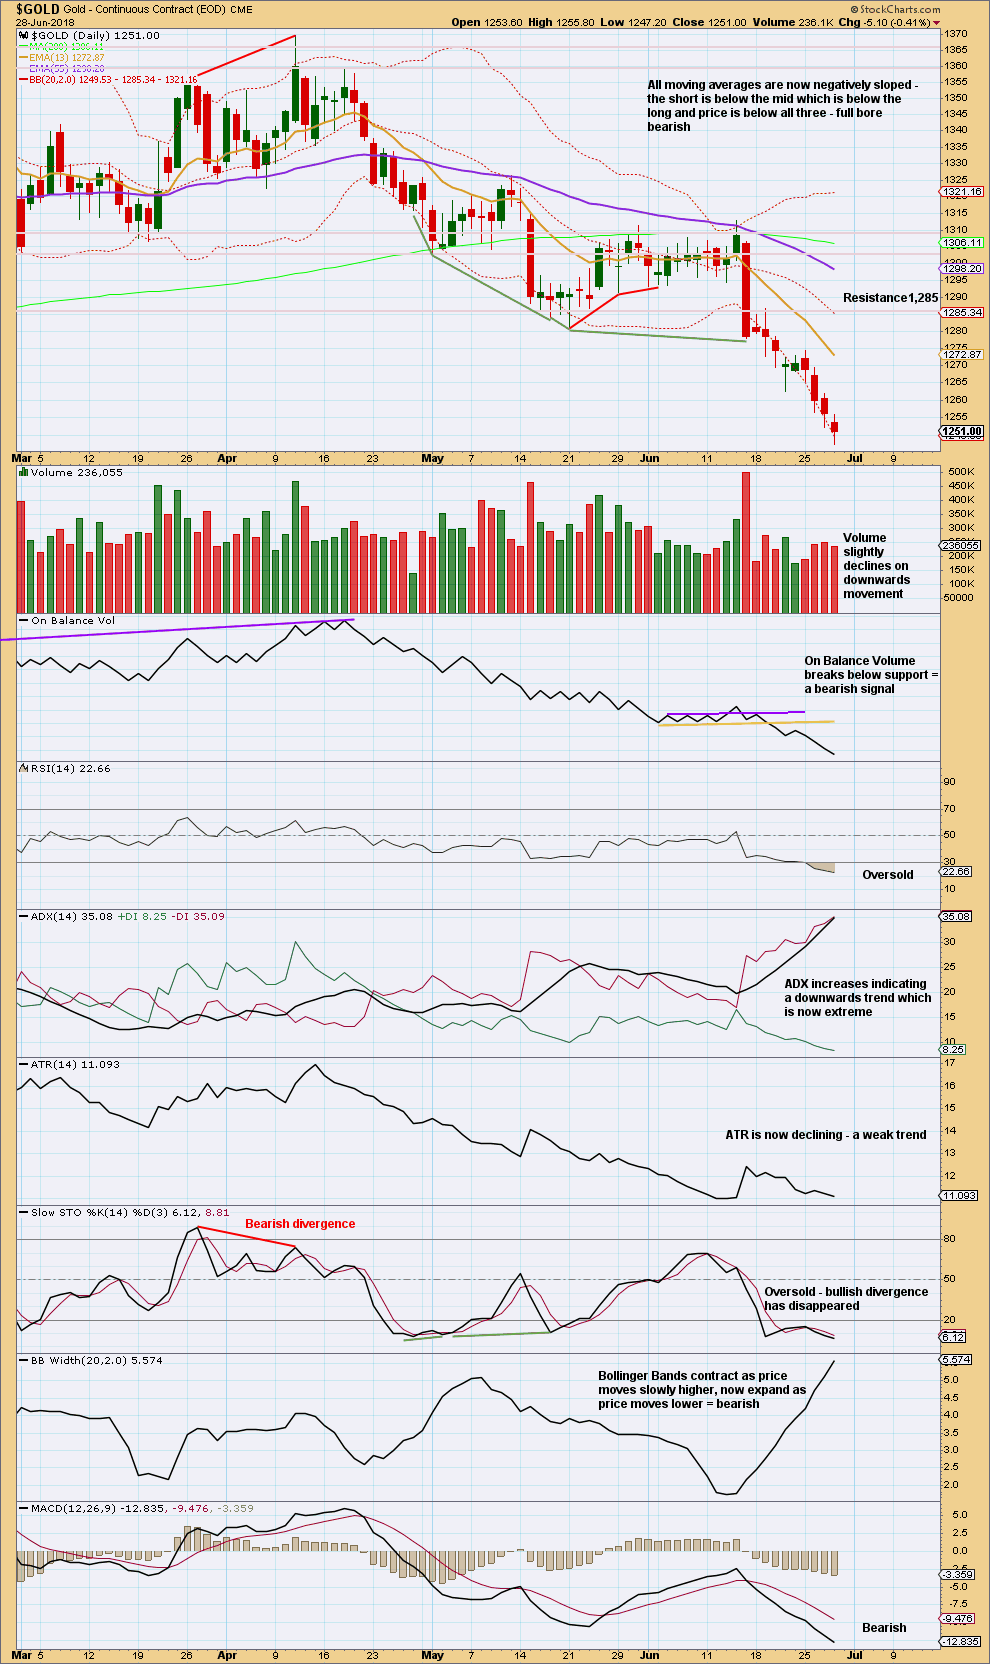
With a bearish signal from On Balance Volume at the weekly chart level, it now looks like the downwards breakout this time may be true and not false.
On Balance Volume at the daily chart level remains bearish and supports the Elliott wave count.
RSI has reached into oversold. It may remain oversold for a very few days before a consolidation may develop to resolve it.
ADX is now extreme as it rises to above 35. It may remain extreme for a reasonable period of time when Gold has a strong trend.
The only reasonable cause for concern here for bears is low and declining ATR: bears are less able to push price lower each day the real body of each candlestick is smaller. This could continue and could mean the end of this downwards trend is close, or it could simply reverse after support is broken and then candlesticks may see lengthening real bodies.
GDX WEEKLY CHART
Click chart to enlarge. Chart courtesy of StockCharts.com.
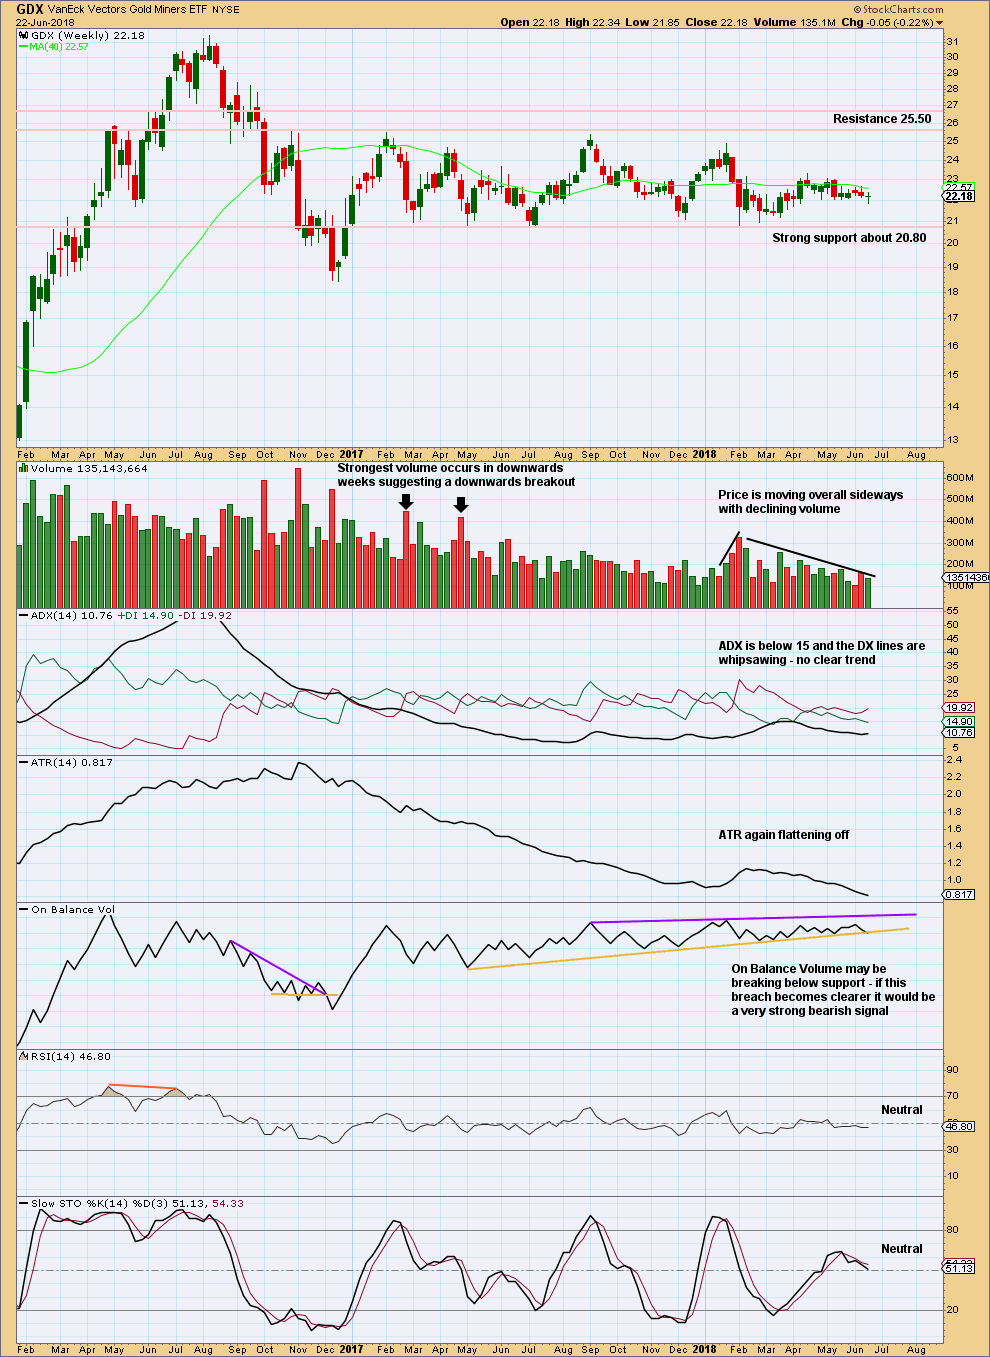
Support about 20.80 has been tested about eight times and so far has held. The more often a support area is tested and holds, the more technical significance it has.
In the first instance, expect this area to continue to provide support. Only a strong downwards day, closing below support and preferably with some increase in volume, would constitute a downwards breakout from the consolidation that GDX has been in for a year now.
Resistance is about 25.50. Only a strong upwards day, closing above resistance and with support from volume, would constitute an upwards breakout.
A downwards week last week completes a small green doji. Overall, this is neutral.
The yellow support line on On Balance Volume has a reasonable slope, but it is very long held and has been tested multiple times. This line has very strong technical significance. If it is clearly breached this week, that would provide a very strong bearish signal for GDX.
GDX DAILY CHART
Click chart to enlarge. Chart courtesy of StockCharts.com.
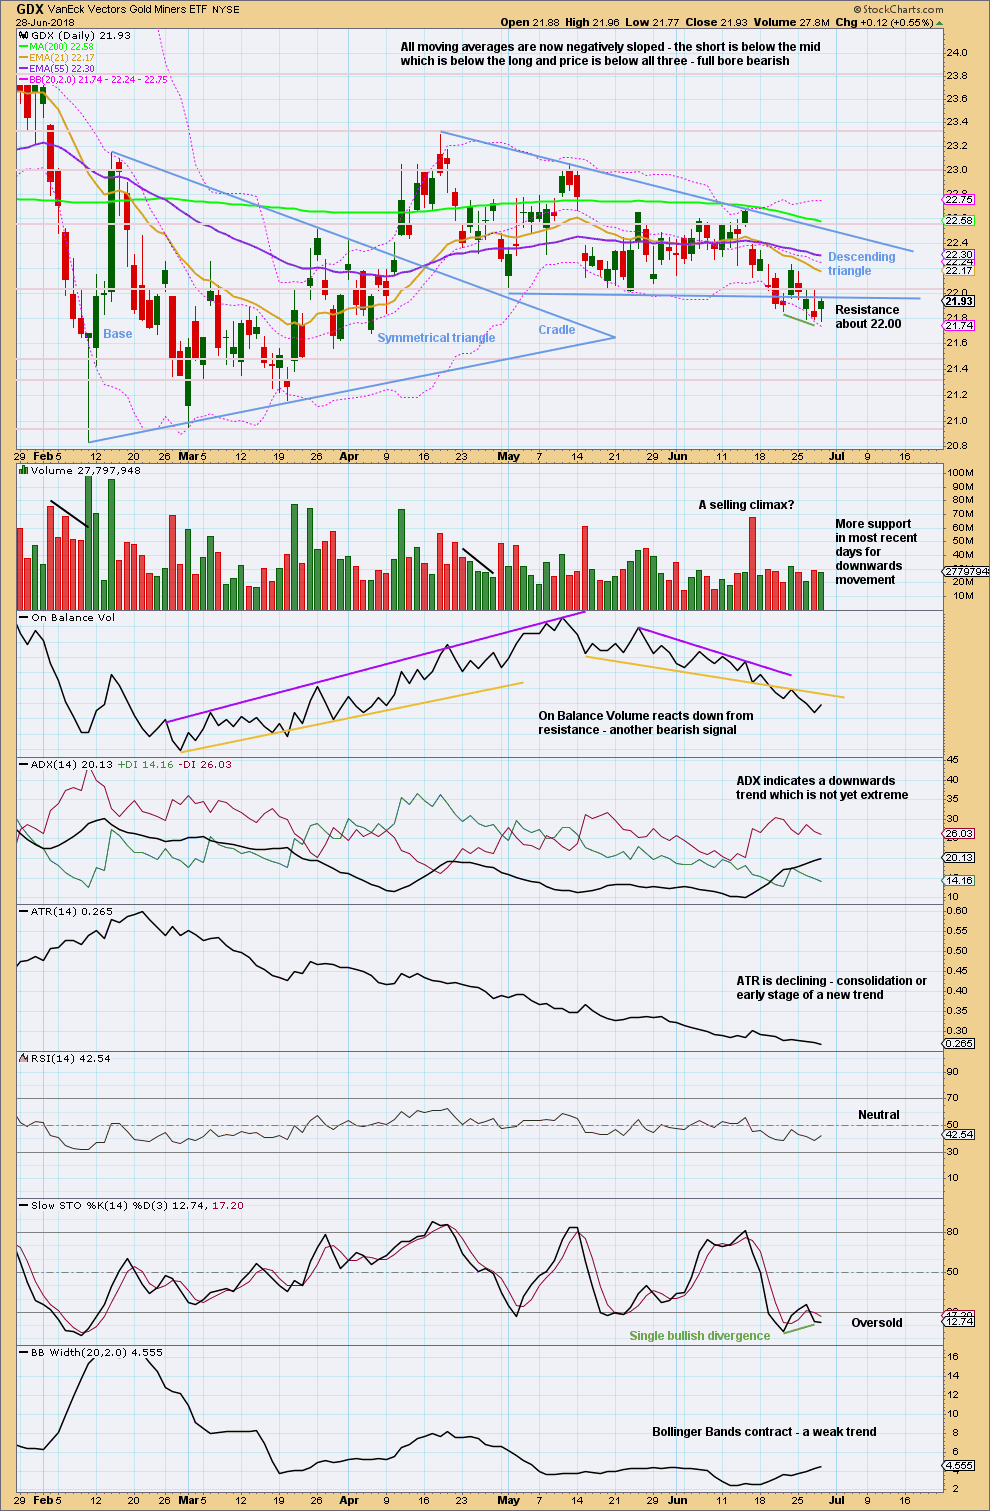
On Balance Volume is bearish at the daily chart level.
GDX appears to have more room for downwards movement than Gold. The trend is not yet nearing extreme. Look for support about 20.80.
GDX has seen a downwards breakout from the descending triangle and today looks like a throwback to test resistance.
A target calculated using the width of the base of the triangle would be about 20.74.
Published @ 09:05 p.m. EST.
It looks like Gold may have found a short term low, this green candlestick may be the fourth wave counterpart to minute ii.
It doesn’t have a great fit on the hourly chart, but going down to the five and one minute chart it can fit.
Gold and silver prices in one hour period forming inv HnS with double bottom head. Current consolidation may end with break above the current high at NL.
Then again current count may take prices to new lows as dictated by the EW.
Break out from inv HnS and BT at NL.
Hope this holds for longs.