
The Elliott wave target remains the same.
Summary: The short term target is at 1,227 for a multi day to multi week consolidation.
The mid term target is 1,216 – 1,211. Downwards movement may be limited to no lower than 1,123.08.
Always trade with stops to protect your account. Risk only 1-5% of equity on any one trade.
New updates to this analysis are in bold.
Grand SuperCycle analysis is here.
Last historic analysis with monthly charts and several weekly alternates is here, video is here.
There are six weekly charts published in the last historic analysis. All but two expect more downwards movement at this time; the two bullish wave counts would be invalidated below 1,236.54, which may happen within the next 24 hours. Because the remaining four bearish wave counts all expect the same movement next only one shall be published on a daily basis. Members should keep the other wave counts in mind. They will be published on a daily basis if they begin to diverge from the triangle wave count.
MAIN ELLIOTT WAVE COUNT
WEEKLY CHART – TRIANGLE
Click chart to enlarge.
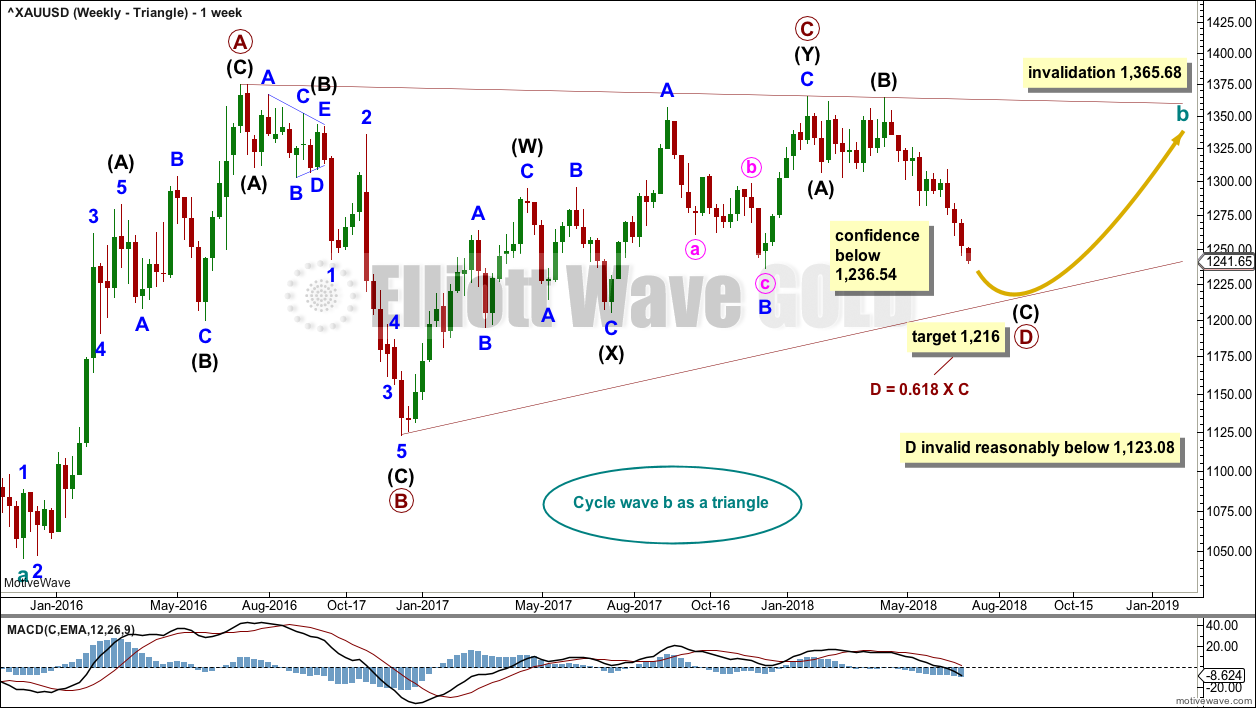
The triangle so far has the best fit and look. If price shows a combination or flat may be more likely, then those ideas may be published on a daily basis. The flat and combination ideas expect movement reasonably below 1,123.08, or perhaps a new low below 1,046.27.
Cycle wave b may be an incomplete triangle. The triangle may be a contracting or barrier triangle, with a contracting triangle looking much more likely because the A-C trend line does not have a strong slope. A contracting triangle could see the B-D trend line have a stronger slope, so that the triangle trend lines converge at a reasonable rate. A barrier triangle would have a B-D trend line that would be essentially flat, and the triangle trend lines would barely converge.
Within a contracting triangle, primary wave D may not move beyond the end of primary wave B below 1,123.08. Within a barrier triangle, primary wave D may end about the same level as primary wave B at 1,123.08, so that the B-D trend line is essentially flat. Only a new low reasonably below 1,123.08 would invalidate the triangle.
Within both a contracting and barrier triangle, primary wave E may not move beyond the end of primary wave C above 1,365.68.
Four of the five sub-waves of a triangle must be zigzags, with only one sub-wave allowed to be a multiple zigzag. Primary wave C is the most common sub-wave to subdivide as a multiple, and this is how primary wave C for this example fits best.
Primary wave D must be a single structure, most likely a zigzag.
One triangle sub-wave tends to be close to 0.618 the length of its predecessor; this gives a target for primary wave D.
There are no problems in terms of subdivisions or rare structures for this wave count. It has an excellent fit and so far a typical look.
DAILY CHART – TRIANGLE
Click chart to enlarge.
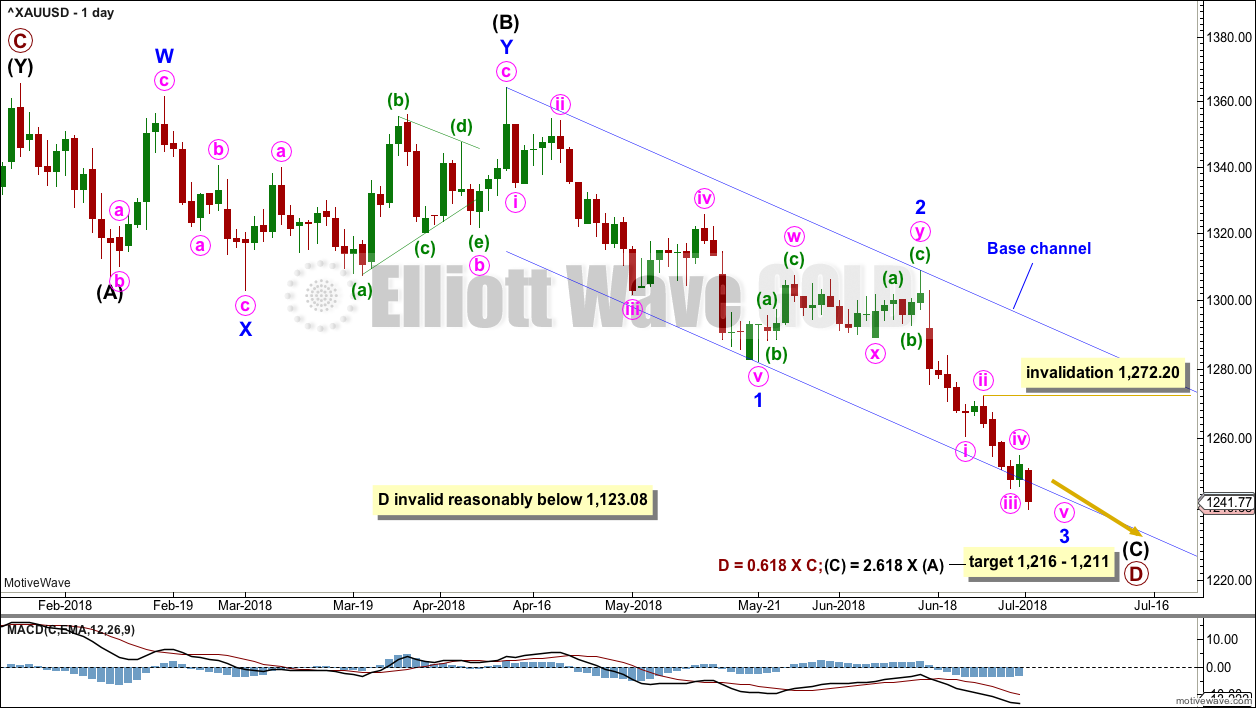
Primary wave D may be unfolding lower as a single zigzag, and within it intermediate waves (A) and (B) may be complete.
The target is widened to a $5 zone calculated at two degrees. This should have a reasonable probability.
Within intermediate wave (C), it looks likely that minor wave 2 may now be over. Within minor wave 3, no second wave correction may move beyond the start of its first wave above 1,308.89.
This wave count now expects to see an increase in downwards momentum as a third wave unfolds, and so far MACD shows that minor wave 3 is developing stronger momentum.
Add a base channel about minor waves 1 and 2. Along the way down, bounces for lower degree second wave corrections may be expected to find resistance at the upper edge of the base channel. The middle to end of minor wave 3 may have the power to break below support at the lower edge of the base channel. This has happened today. The lower edge of the base channel may now provide resistance.
Gold, typical of commodities, often exhibits very swift and strong fifth waves. This tendency is particularly prevalent for its fifth waves to end third wave impulses. Look out for a possible selling climax to end minor wave 3.
Within minute wave iii, no second wave correction may move beyond the start of its first wave above 1,272.20.
HOURLY CHART
Click chart to enlarge.
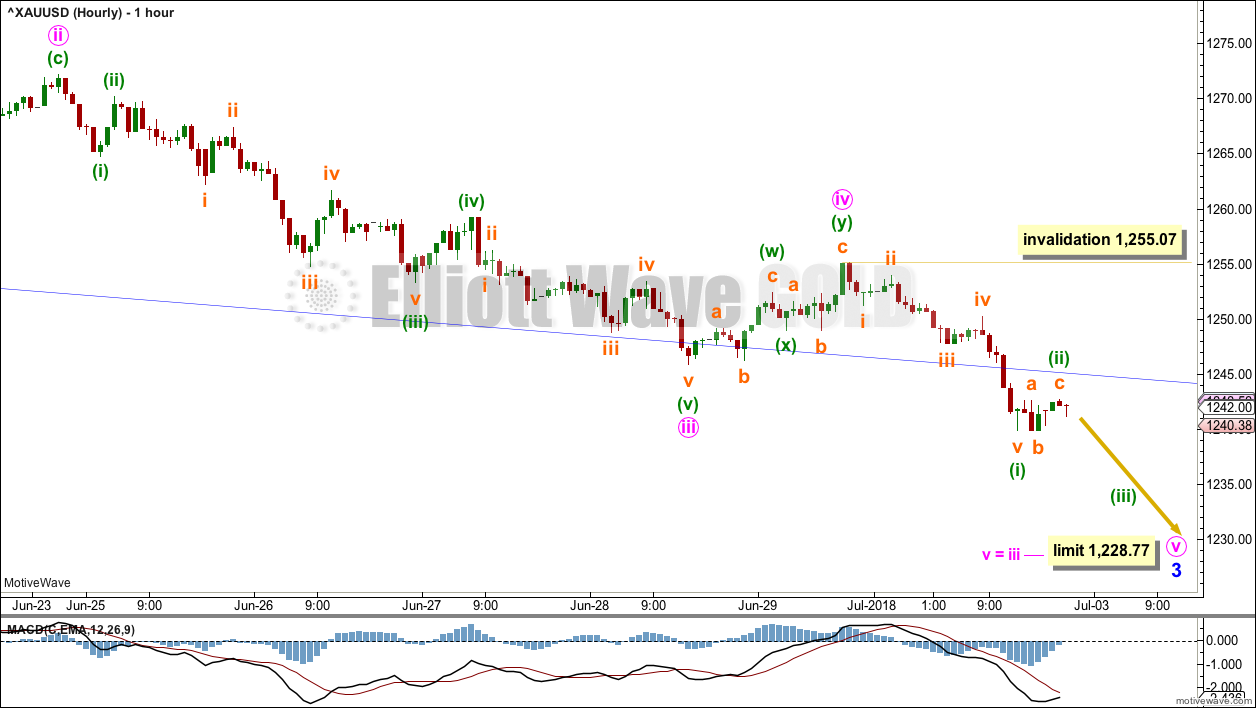
The base channel on the daily chart is copied over to this hourly chart.
Minor wave 3 may only subdivide as an impulse.
Within minor wave 3, minute waves i, ii and now iii may be complete. If minute wave iii is over at the last low, then it would be shorter than minute wave i by 22.07. This limits minute wave v to no longer than equality in length than minute wave iii at 1,228.77, so that minute wave iii is not the shortest actionary wave.
Within minute wave v, the correction of minuette wave (ii) may not move beyond the start of minuette wave (i) above 1,255.07.
Price may now be moving towards the end of minor wave 3. There will be the possibility for price to move very strongly lower as minor wave 3 comes to an end; fifth waves to end third wave impulses may be strong and sharp.
ALTERNATE HOURLY CHART
Click chart to enlarge.
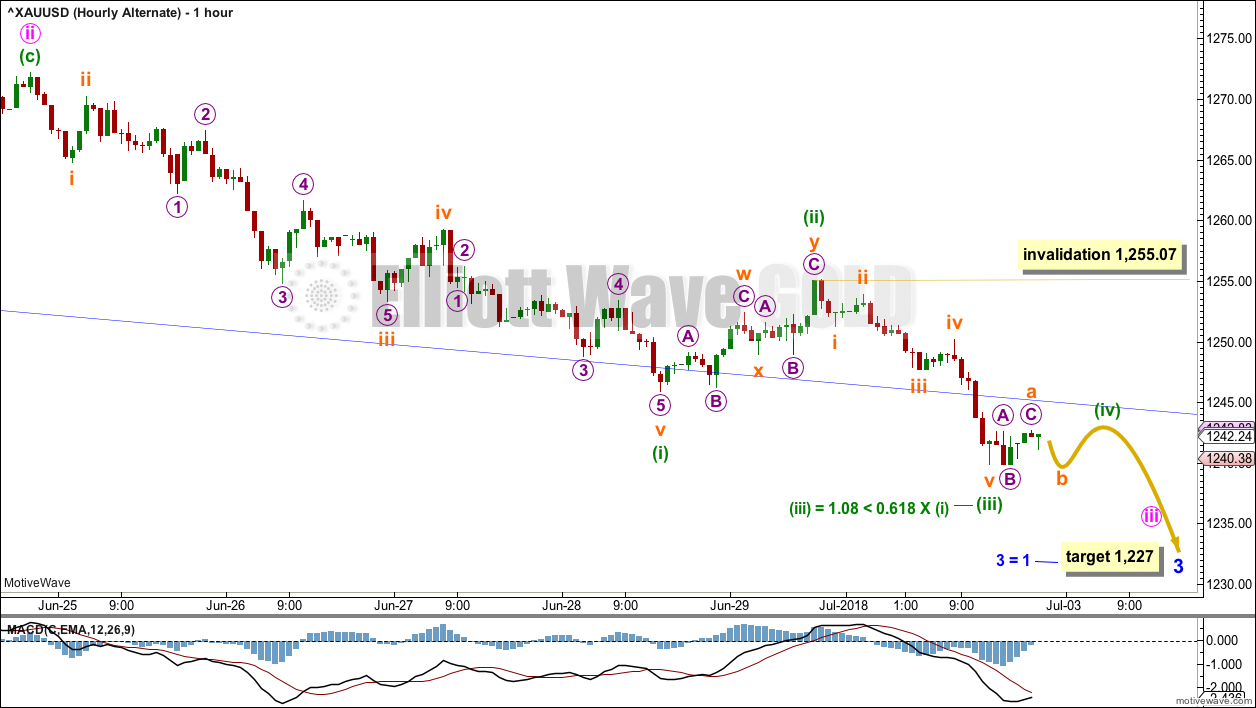
By moving the degree of labelling within minute wave iii all down one degree, it is possible that it is not complete.
Minute wave iii may only subdivide as an impulse. Within it, only minuette waves (i) and (ii) may be complete.
Minuette wave (iii) may only subdivide as an impulse. It may now be complete; if it is over at today’s low, then it would be shorter than minuette wave (i). It is also possible that the degree of labelling within minuette wave (iii) may be moved down one degree and only subminuette wave i may be over at today’s low; if that is the case, then subminuette wave ii may not move beyond the start of subminuette wave i above 1,255.07.
TECHNICAL ANALYSIS
WEEKLY CHART
Click chart to enlarge. Chart courtesy of StockCharts.com.
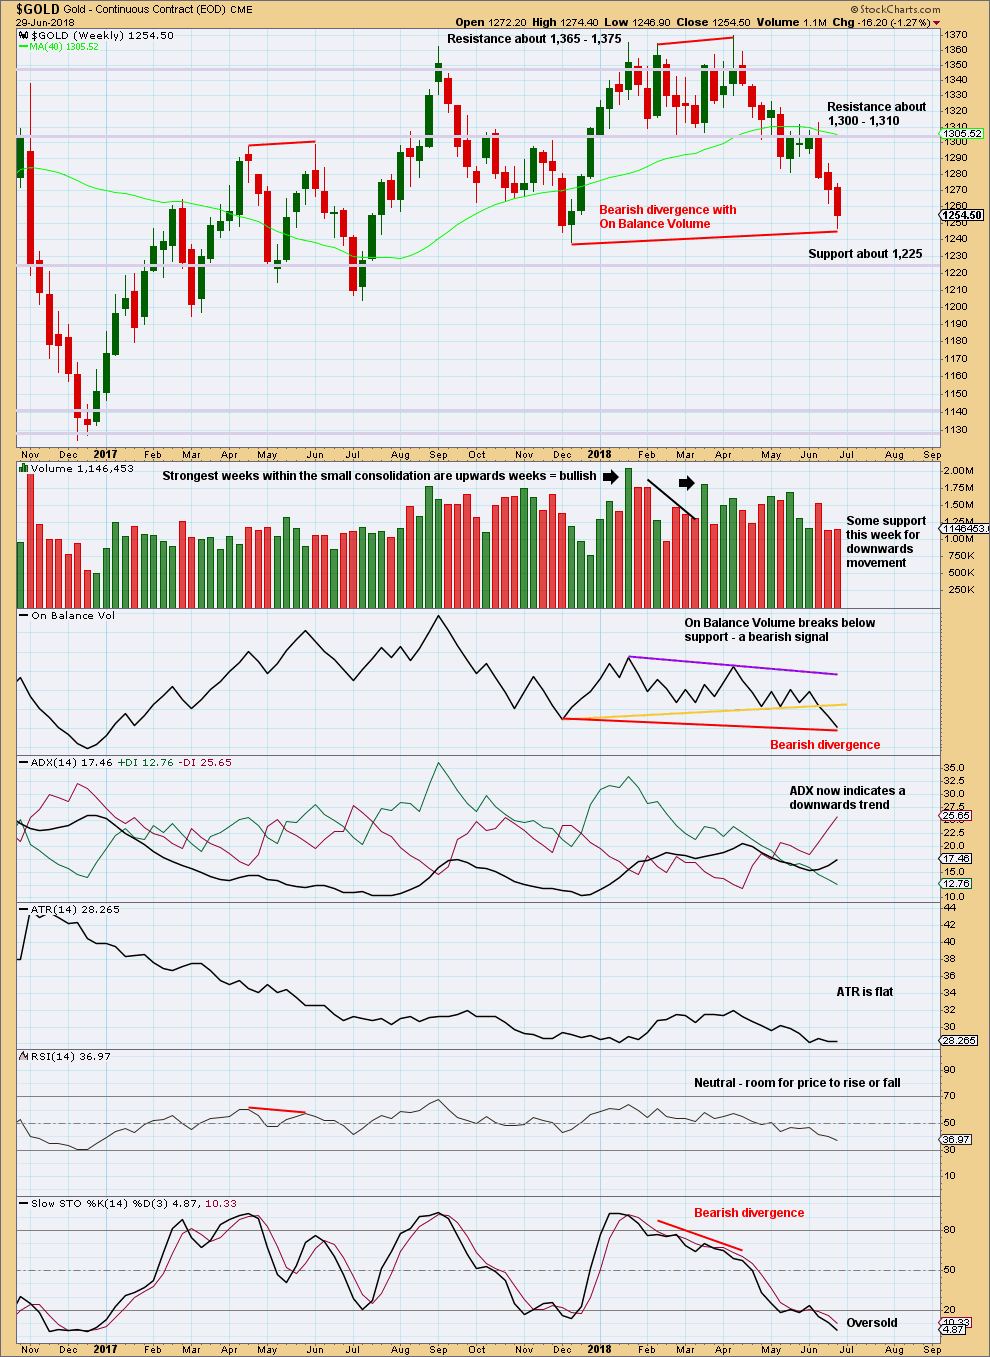
On Balance Volume has made a new swing low last week below the prior swing low, but price has not. On Balance Volume should be read as a leading indicator, so this is bearish and indicates price may likely follow through with a new swing low below 1,238.30.
The long lower wick on the last weekly candlestick is a little bullish, but it is not long enough to expect a low is likely to be in place here.
DAILY CHART
Click chart to enlarge. Chart courtesy of StockCharts.com.
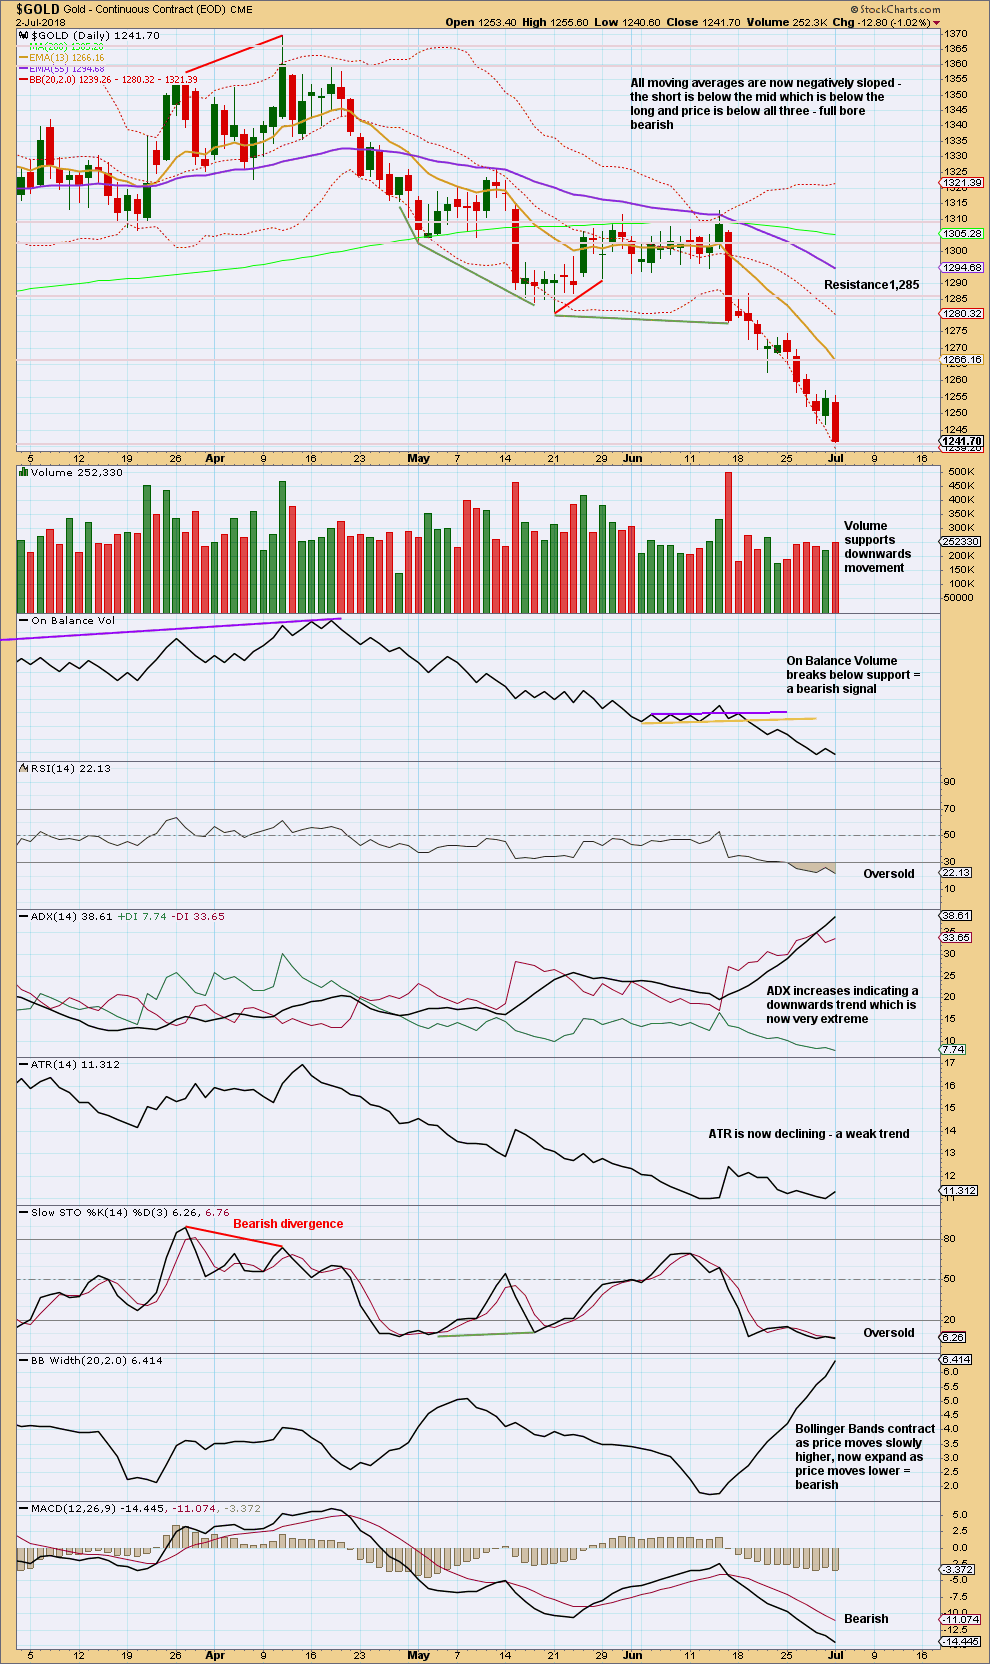
The candlestick reversal pattern noted for Friday’s candlestick has not been followed by any trend change, so it is considered to have failed.
This trend is now very extreme, and there is no clear bullish divergence after Stochastics or RSI has reached oversold. If clear bullish divergence develops, then a low may be in place. But until that happens, there is room for price to fall further. There is good support here about 1,235. Next strong support is about 1,207.
With Monday’s candlestick having a reasonably sized real body and closing close to lows, it looks like downwards movement shall continue here.
GDX WEEKLY CHART
Click chart to enlarge. Chart courtesy of StockCharts.com.
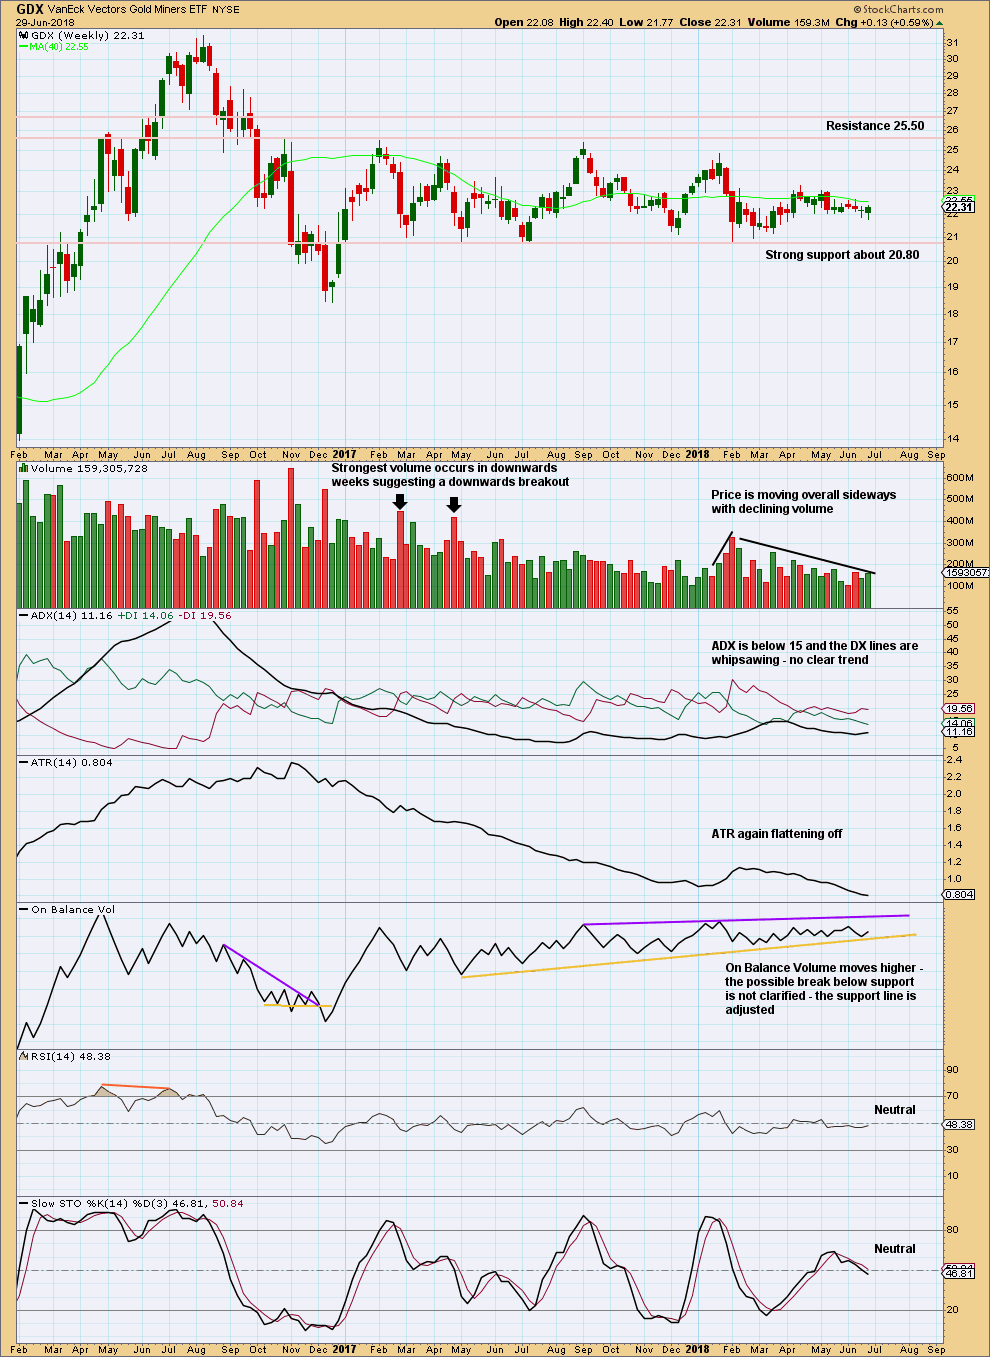
Support about 20.80 has been tested about eight times and so far has held. The more often a support area is tested and holds, the more technical significance it has.
In the first instance, expect this area to continue to provide support. Only a strong downwards day, closing below support and preferably with some increase in volume, would constitute a downwards breakout from the consolidation that GDX has been in for a year now.
Resistance is about 25.50. Only a strong upwards day, closing above resistance and with support from volume, would constitute an upwards breakout.
An upwards week last week has some support from volume and a long lower wick. It looks likely that GDX may move higher next week.
GDX DAILY CHART
Click chart to enlarge. Chart courtesy of StockCharts.com.
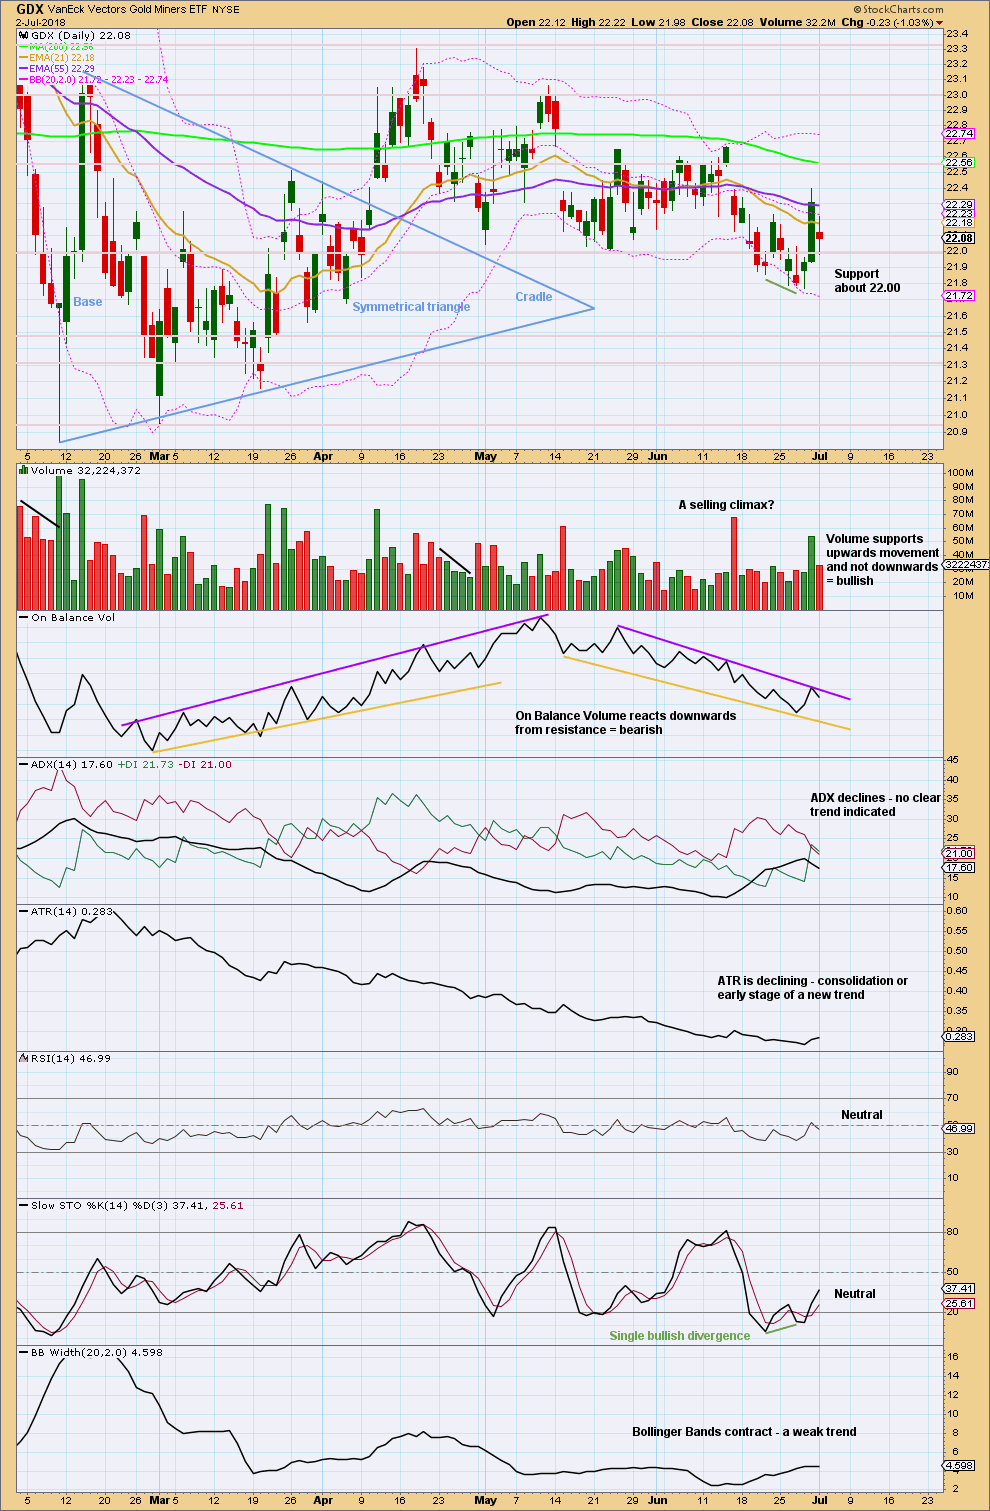
With a series of lower swing lows and lower swing highs since the 18th of April, GDX may be in a weak downwards trend. ADX is fluctuating though as there are strong bounces within this downwards movement. The trend is unclear.
With both RSI and Stochastics again neutral, there is again room for price to fall.
Published @ 09:55 p.m. EST.
hourly chart updated:
I’m going to label minor 3 complete and this bounce the start of minor 4.
this wave count would now expect a multi week correction, about 2-3 weeks, of consolidation before the resumption of downwards movement.
Hourly count invalidated.
Hi Papudi. Not too sure if Gold price has done enough on the upside. Imo a break below 1251 should set the cat amongst the pigeons to open up 1243 and below yet again lol. ADX is up, DMI is in negative territory. I would still favor some more downside to follow with a possible stop at 1259. Perhaps just a minor upward price correction to get back above the weekly lower band. Lets see what happens. Good luck!
Dollars need to die to fuel gold/silver rally….
Investors hate gold and silver. Down to only 7% bulls. Bounce due soon based on these #’s
Hi Lara, would you give a trend line like this one a chance to bounce up?
Weekly charts should be viewed on a semi-log scale. On a semi-log scale that line has been breached. It’s the same as the lower edge of the teal base channel on the weekly second alternate (published at the end of last week in the historic analysis).
So the line has been breached.
In the first instance then yes, we would expect support and a bounce, but now the line’s breached we can know it didn’t happen there.
Also, there are three things that determine how technically significant a trend line is:
1. The number of times it’s been tested. The more tests, the more significance.
2. How long it’s held. The longer it’s held, the more significance.
3. The slope. The more shallow the slope, the more significance. Horizontal lines have the strongest significance.
This line is long held, but only tested twice (the minimum) and has a fairly strong slope, so it did not hold good technical significance.
hmmm ok thanks.