

S&P 500
For Friday more upwards movement was expected, which is exactly what has happened.
Summary: Expect the upwards trend to continue overall. On Balance Volume makes another new all time high on the daily chart, and the short term volume profile is bullish. However, the AD line has ended the week with some weakness
The next short term target is about 2,878; a consolidation lasting about one to two weeks may be expected at about this target. Following that, another consolidation lasting about two weeks may be expected about 2,915.
The invalidation point may now be moved up to the last swing low at 2,691.99.
The mid to longer term target is at 2,922 (Elliott wave) or 3,045 (classic analysis). Another multi week to multi month correction is expected at one of these targets.
The final target for this bull market to end remains at 3,616.
Pullbacks are an opportunity to join the trend.
Always practice good risk management. Always trade with stops and invest only 1-5% of equity on any one trade.
The biggest picture, Grand Super Cycle analysis, is here.
Last historic analysis with monthly charts is here, video is here.
ELLIOTT WAVE COUNT
WEEKLY CHART
Click chart to enlarge.
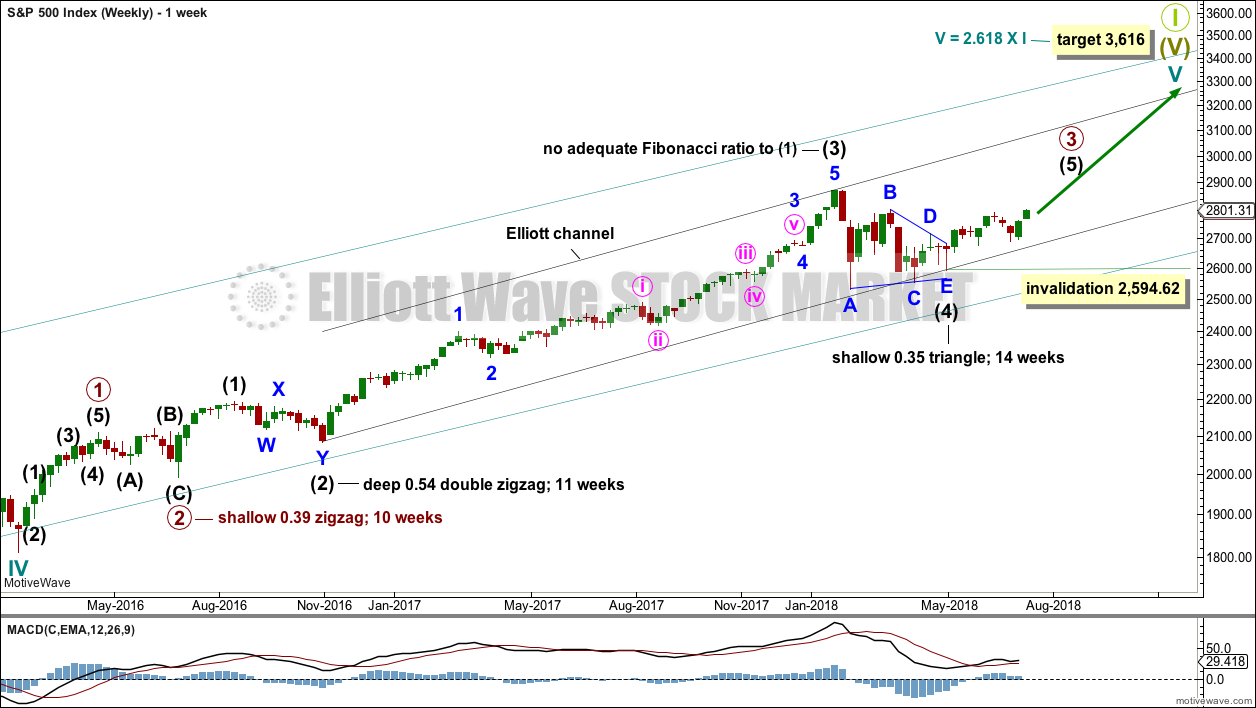
Cycle wave V must complete as a five structure, which should look clear at the weekly chart level and also now at the monthly chart level. It may only be an impulse or ending diagonal. At this stage, it is clear it is an impulse.
Within cycle wave V, the third waves at all degrees may only subdivide as impulses.
Intermediate wave (4) has breached an Elliott channel drawn using Elliott’s first technique. The channel is redrawn using Elliott’s second technique: the first trend line from the ends of intermediate waves (2) to (4), then a parallel copy on the end of intermediate wave (3). Intermediate wave (5) may end either midway within the channel, or about the upper edge.
Intermediate wave (4) may now be a complete regular contracting triangle lasting fourteen weeks, one longer than a Fibonacci thirteen. There is perfect alternation and excellent proportion between intermediate waves (2) and (4).
Within intermediate wave (5), no second wave correction may move beyond the start of its first wave below 2,594.62.
At this stage, the expectation is for the final target to me met in October 2019.
A multi week to multi month consolidation for primary wave 4 is expected on the way up to the final target.
DAILY CHART
Click chart to enlarge.
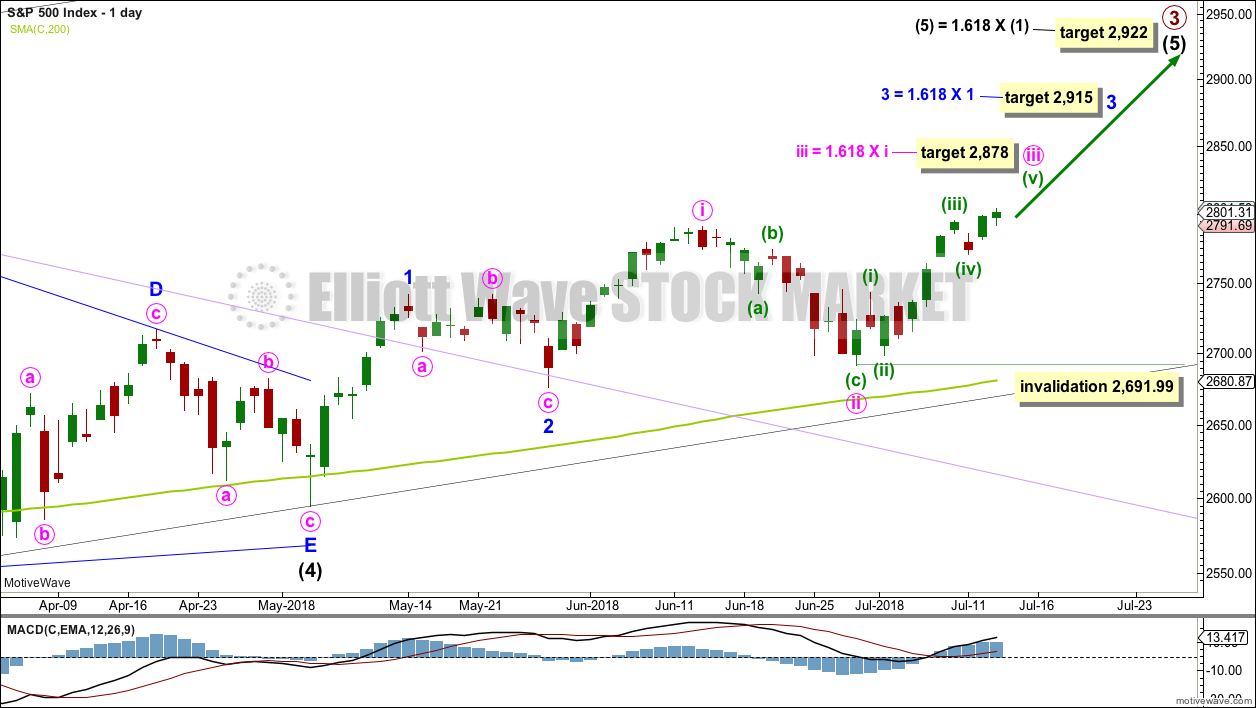
It is possible that intermediate wave (4) is a complete regular contracting triangle, the most common type of triangle. Minor wave E may have found support just below the 200 day moving average and ending reasonably short of the A-C trend line. This is the most common look for E waves of triangles.
Intermediate wave (3) exhibits no Fibonacci ratio to intermediate wave (1). It is more likely then that intermediate wave (5) may exhibit a Fibonacci ratio to either of intermediate waves (1) or (3). The most common Fibonacci ratio would be equality in length with intermediate wave (1), but in this instance that would expect a truncation. The next common Fibonacci ratio is used to calculate a target for intermediate wave (5) to end.
Price has clearly broken out above the upper triangle B-D trend line. This indicates that it should now be over if the triangle is correctly labelled.
A trend line in lilac is added to this chart. It is the same line as the upper edge of the symmetrical triangle on the daily technical analysis chart. Price found support about this line.
A target is now calculated for minute wave iii to end, which expects to see the most common Fibonacci ratio to minute wave i. Minute wave iii may last a few weeks. When it is complete, then minute wave iv may last about one to two weeks in order for it to exhibit reasonable proportion to minute wave ii. Minute wave iv must remain above minute wave i price territory.
Minute wave iii may have passed its middle strongest portion a few days ago. Although the structure could possibly be seen as complete at today’s high, it has not moved far enough above the end of minute wave i yet to allow room for minute wave iv to unfold and remain above minute wave i price territory. For that to happen it looks like minuette wave (v) may be a relatively long extension, so that minute wave iii moves higher.
A target is calculated for minor wave 3 to end, which expects to see the most common Fibonacci ratio to minor wave 1. Minor wave 3 may last several weeks in total and should look like an impulse at the daily chart level. When it is complete, then minor wave 4 may last about one to two weeks in order for it to exhibit reasonable proportion to minor wave 2. Minor wave 4 must remain above minor wave 1 price territory.
The last bullish fifth wave of minor wave 5 to end intermediate wave (3) (this can be seen on the weekly chart now) exhibited commodity like behaviour. It was strong and sustained. It is possible that the upcoming wave of minor wave 5 to end intermediate wave (5) to end primary wave 3 may exhibit similar behaviour, so we should be on the lookout for this possibility.
ALTERNATE DAILY CHART
Click chart to enlarge.
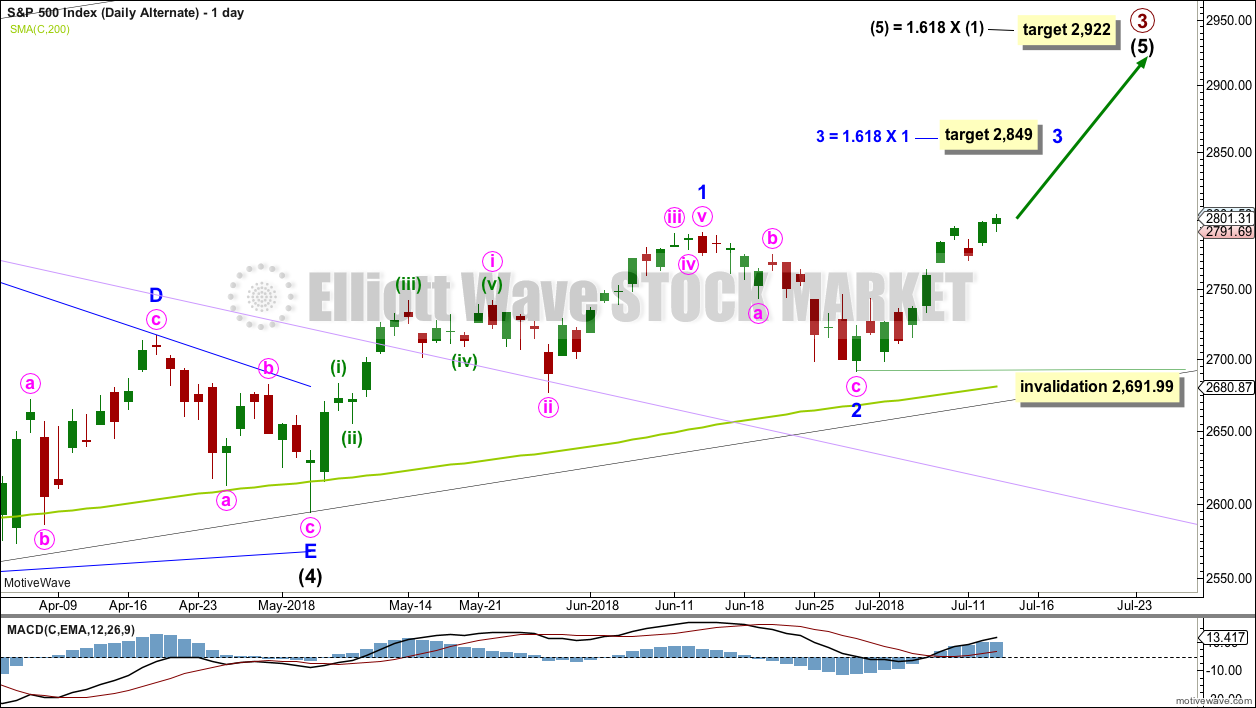
It is possible that minor wave 1 may have been over at the last high. Minor wave 3 may be in its very early stages.
At the daily chart level, this wave count does not have as good a look as the main wave count. Minor wave 1 has a three wave look, but it should look like a five. However, this market does not always have fives that look perfectly like fives, so this possibility should still be considered.
TECHNICAL ANALYSIS
WEEKLY CHART
Click chart to enlarge. Chart courtesy of StockCharts.com.
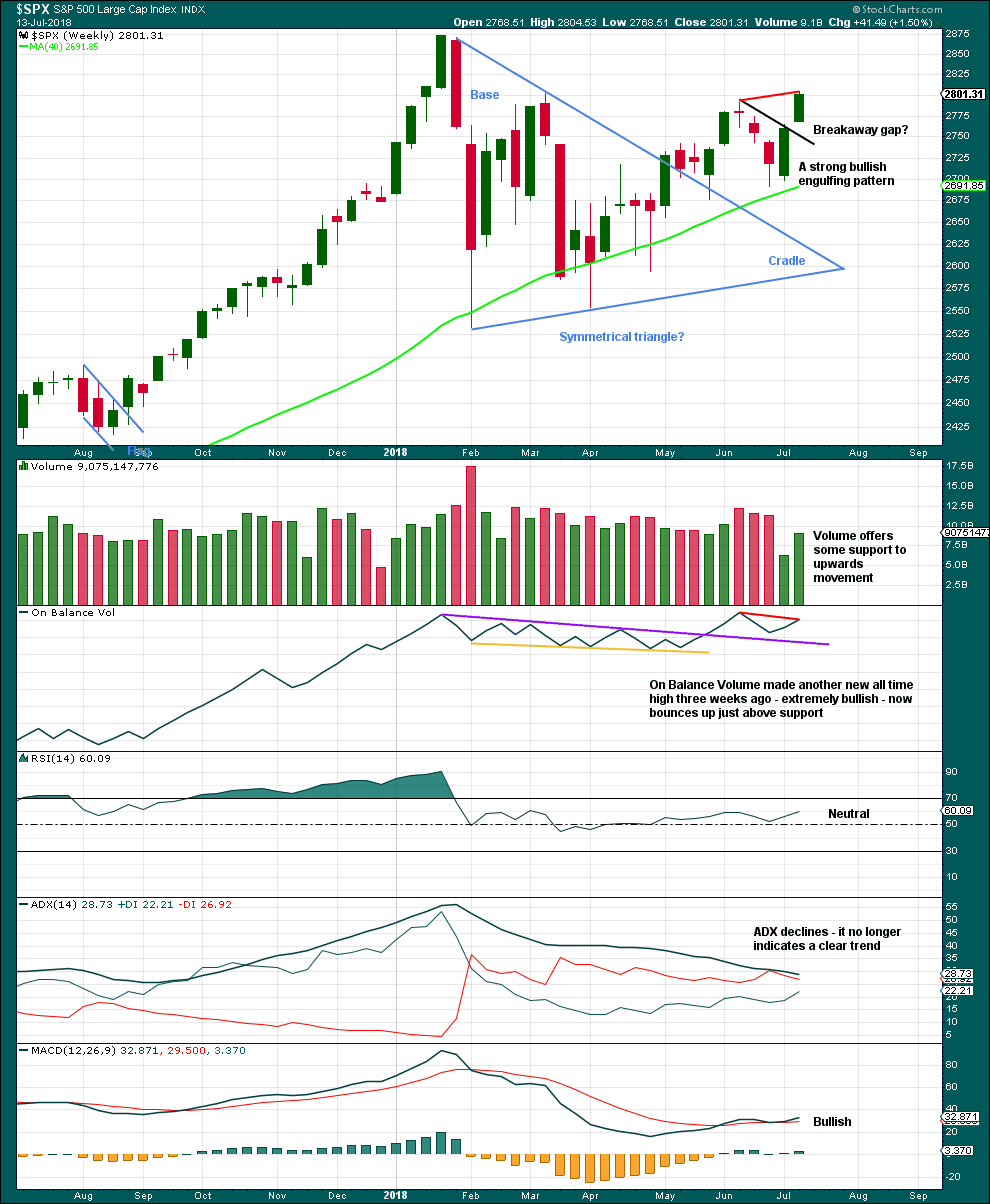
Because last week moved price higher but had lighter volume due to the 4th of July holiday, this may affect On Balance Volume. The short term bearish divergence between price and On Balance Volume noted on the chart may not be very significant for this reason.
What may be more significant is another strong upwards week and a gap that may be a breakaway gap. This gap may offer support; breakaway gaps remain open.
DAILY CHART
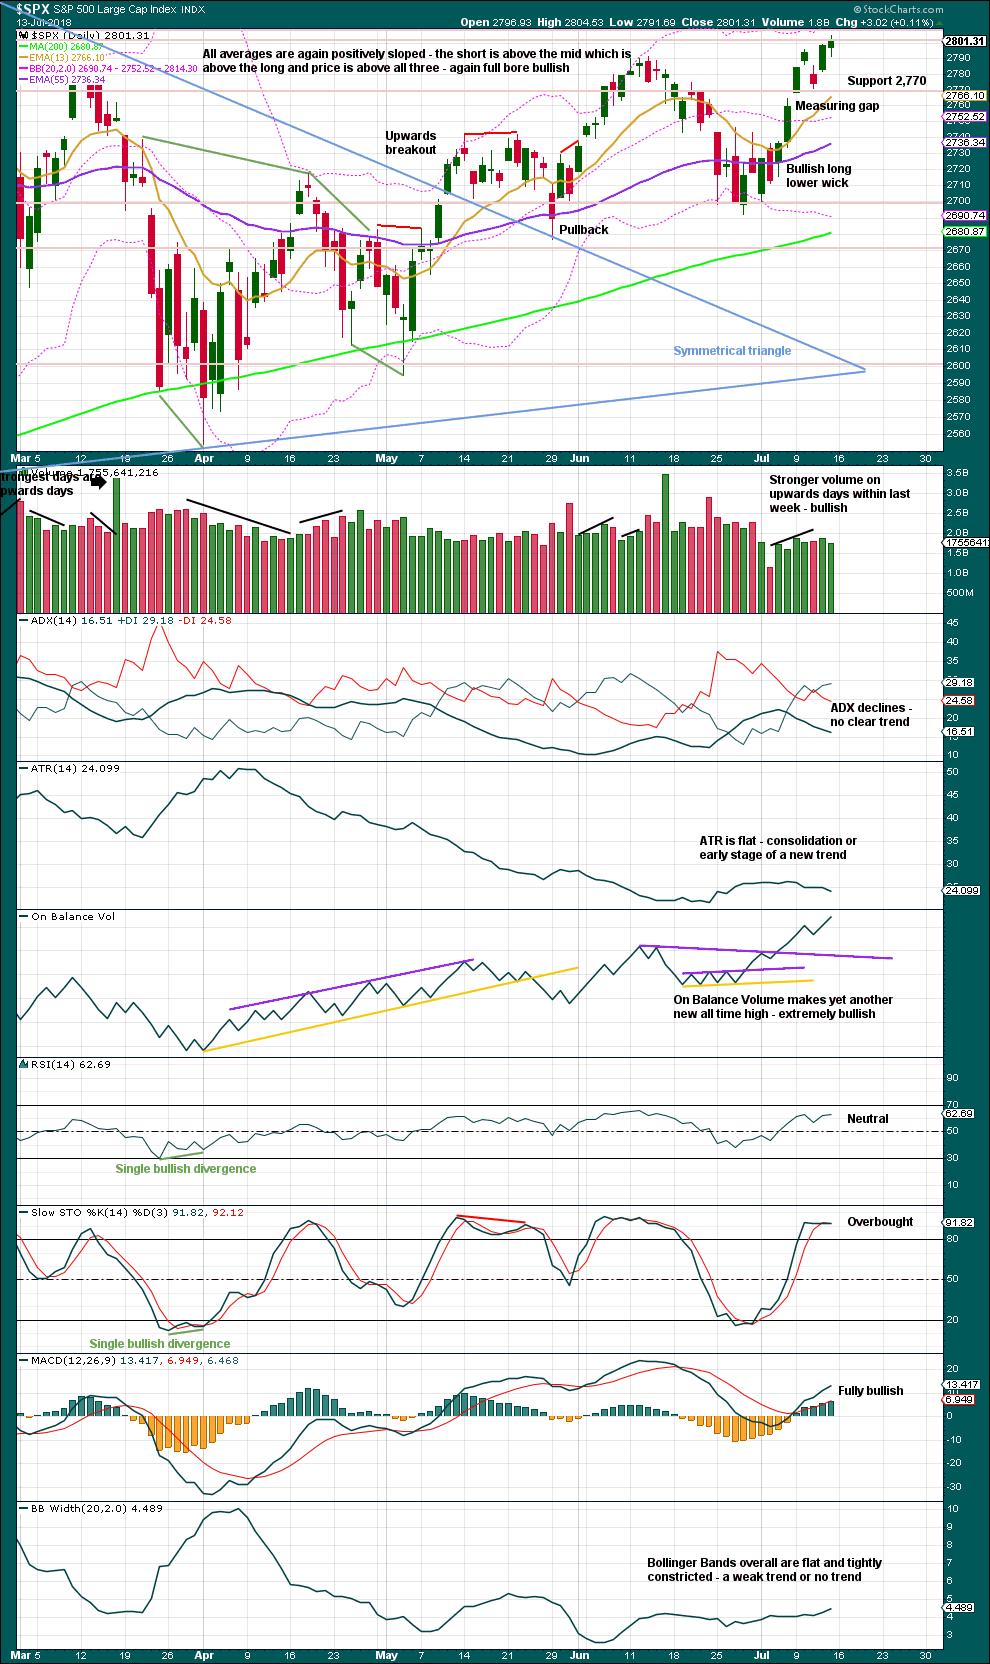
Click chart to enlarge. Chart courtesy of StockCharts.com.
The symmetrical triangle may now be complete. The base distance is 340.18. Added to the breakout point of 2,704.54 this gives a target at 3,044.72. This is above the Elliott wave target at 2,922, so the Elliott wave target may be inadequate.
Since the low on the 2nd of April, 2018, price has made a series of higher highs and higher lows. This is the definition of an upwards trend. But trends do not move in perfectly straight lines; there are pullbacks and bounces along the way. A higher high at the end of this week adds some confidence to this trend.
The measuring gap gives a short term target at 2,838. The gap has offered support. It remains open, and the target remains valid.
On Balance Volume remains extremely bullish.
A feature of this market for some years now is rising price on light and declining volume. Slightly lighter volume for Friday is not concerning in current market conditions.
Stochastics may remain overbought for long periods of time when this market has a strong bullish trend. Only when it reaches overbought and then exhibits clear divergence with price, then it may be useful as an indicator of a possible high in place. That is not the case yet.
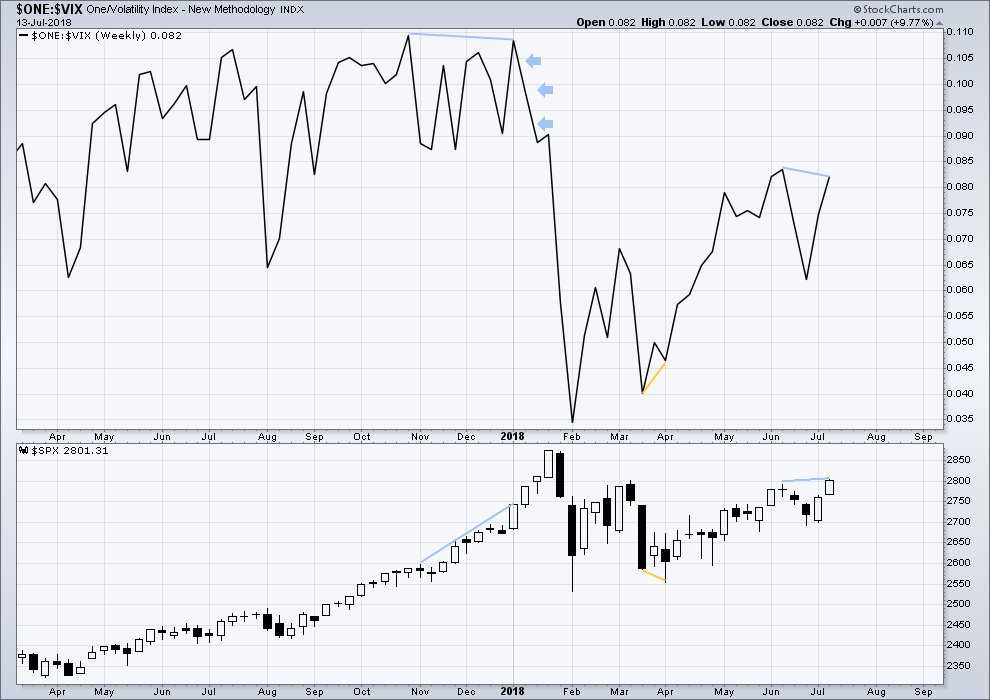
VOLATILITY – INVERTED VIX CHART
WEEKLY CHART
Click chart to enlarge. Chart courtesy of StockCharts.com. So that colour blind members are included, bearish signals
will be noted with blue and bullish signals with yellow.
To keep an eye on the all time high for inverted VIX a weekly chart is required at this time.
Notice how inverted VIX has very strong bearish signals four weeks in a row just before the start of the last large fall in price. At the weekly chart level, this indicator may be useful again in timing the end of primary wave 3.
There is now short term bearish divergence between price and inverted VIX. This divergence is seen on both weekly and daily time frames. It is not very strong.
DAILY CHART
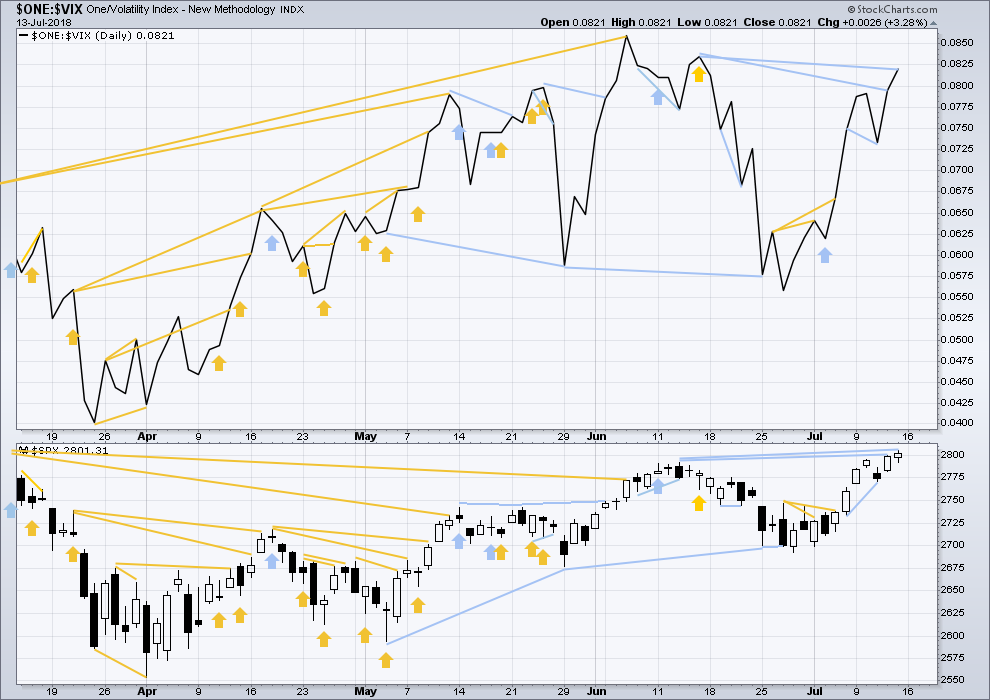
Click chart to enlarge. Chart courtesy of StockCharts.com. So that colour blind members are included, bearish signals
will be noted with blue and bullish signals with yellow.
Normally, volatility should decline as price moves higher and increase as price moves lower. This means that normally inverted VIX should move in the same direction as price.
There is still new mid term bearish divergence today between inverted VIX and price: price has made new highs above the prior swing highs of the 13th of June, but inverted VIX has not yet made corresponding new highs above its prior equivalent swing high of the 15th of June.
BREADTH – AD LINE
WEEKLY CHART
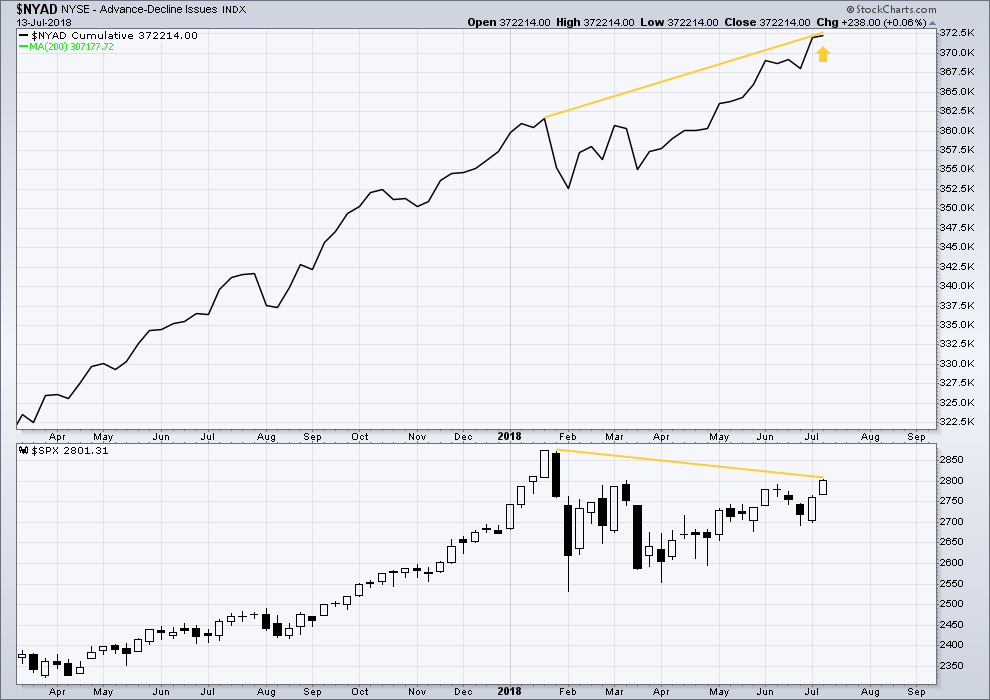
Click chart to enlarge. Chart courtesy of StockCharts.com.
When primary wave 3 comes to an end, it may be valuable to watch the AD line at the weekly time frame as well as the daily.
At this stage, there is very strong bullish divergence between price and the AD line at the weekly time frame. With the AD line making new all time highs, expect price to follow through with new all time highs in coming weeks.
DAILY CHART
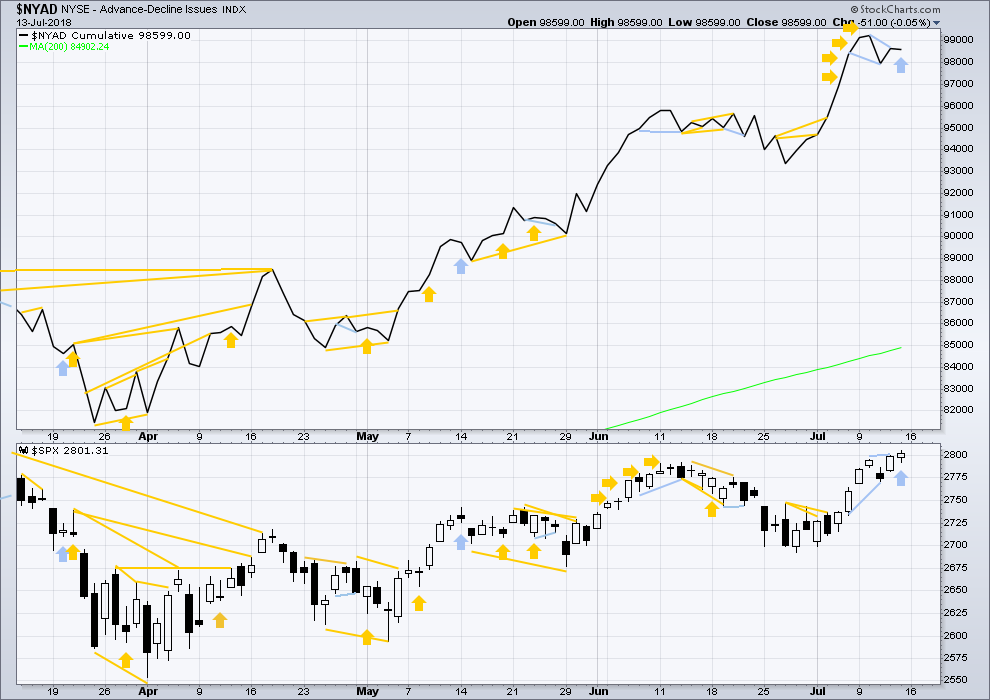
Click chart to enlarge. Chart courtesy of StockCharts.com.
There is normally 4-6 months divergence between price and market breadth prior to a full fledged bear market. This has been so for all major bear markets within the last 90 odd years. With no longer term divergence yet at this point, any decline in price should be expected to be a pullback within an ongoing bull market and not necessarily the start of a bear market. New all time highs from the AD line means that any bear market may now be an absolute minimum of 4 months away. It may of course be a lot longer than that. My next expectation for the end of this bull market may now be October 2019.
Both mid and small caps now have made new all time highs on the 10th of July. Only large caps are lagging, as they tend to do in the latter stages of a bull market.
Breadth should be read as a leading indicator.
For Friday price moved higher but the AD line is essentially flat. This is weak bearish divergence.
Overall, recent new all time highs from the AD line remain extremely bullish for the longer term trend.
Price may reasonably be expected to follow through in coming weeks.
DOW THEORY
The following lows need to be exceeded for Dow Theory to confirm the end of the bull market and a change to a bear market:
DJIA: 23,360.29.
DJT: 9,806.79.
S&P500: 2,532.69.
Nasdaq: 6,630.67.
Only Nasdaq at this stage is making new all time highs. DJIA and DJT need to make new all time highs for the ongoing bull market to be confirmed.
GOLD
A little more downwards movement for Friday was not expected. Price still remains well within the allowable range for this small consolidation, for which there are still multiple Elliott wave structures.
Summary: A multi day to multi week consolidation is likely still unfolding. It may be a sideways consolidation to last one to two weeks, remaining below 1,282.20. At this stage, it may be about two thirds complete.
Minor wave 4 may now be a triangle, combination or flat. All three possibilities expect next week to begin with some upwards movement. Resistance may be about 1,265 and support now may be about 1,237.
When the consolidation is complete, then a final wave down to a final low is expected. The mid term target is 1,216 – 1,211. Downwards movement may be limited to no lower than 1,123.08.
Always trade with stops to protect your account. Risk only 1-5% of equity on any one trade.
At the end of this week, it may be a good idea to note that neither Gold nor Silver have made new swing lows below the prior major swing lows of December 2017. This week both markets moved lower and came even closer to those lows, but both have failed by a small margin. This must be interpreted as bullish, until proven otherwise.
Grand SuperCycle analysis is here.
Last historic analysis with monthly charts and several weekly alternates is here, video is here.
There are six weekly charts published in the last historic analysis. All but two expect more downwards movement at this time; the two bullish wave counts would be invalidated below 1,236.54. Because the remaining four bearish wave counts all expect the same movement next only one shall be published on a daily basis. Members should keep the other wave counts in mind. They will be published on a daily basis if they begin to diverge from the triangle wave count.
MAIN ELLIOTT WAVE COUNT
WEEKLY CHART – TRIANGLE
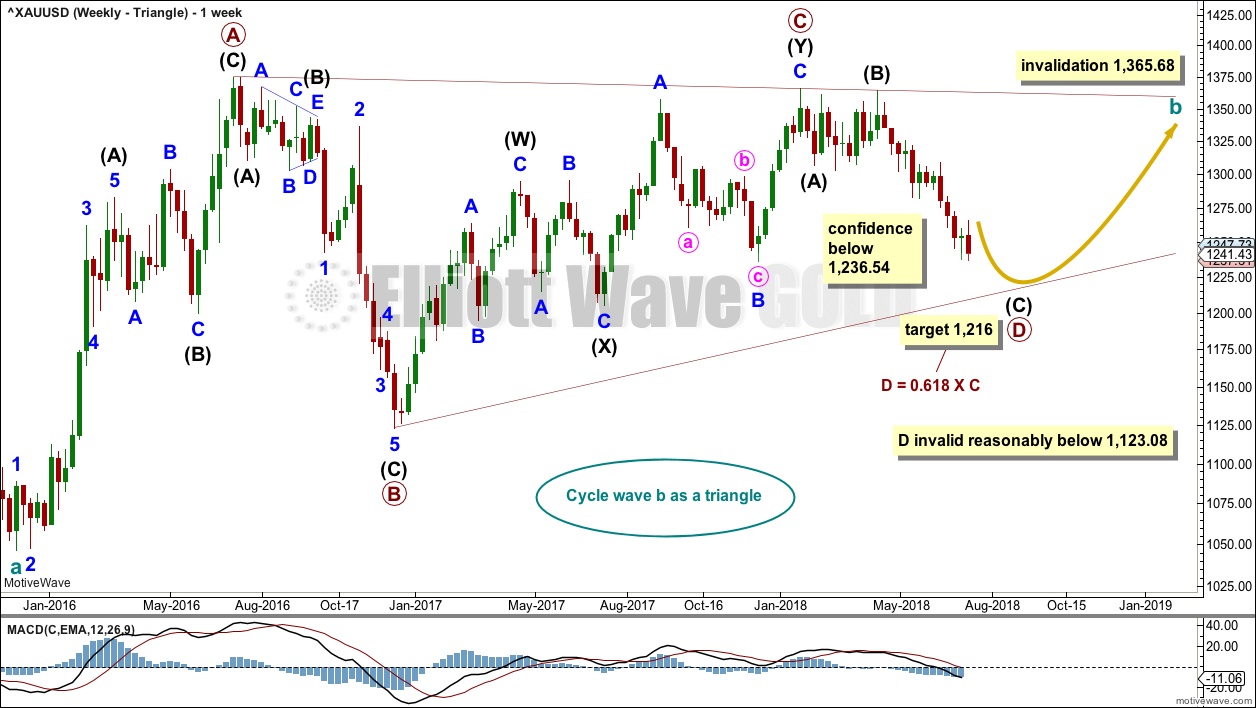
Click chart to enlarge.
The triangle so far has the best fit and look. If price shows a combination or flat may be more likely, then those ideas may be published on a daily basis. The flat and combination ideas expect movement reasonably below 1,123.08, or perhaps a new low below 1,046.27.
Cycle wave b may be an incomplete triangle. The triangle may be a contracting or barrier triangle, with a contracting triangle looking much more likely because the A-C trend line does not have a strong slope. A contracting triangle could see the B-D trend line have a stronger slope, so that the triangle trend lines converge at a reasonable rate. A barrier triangle would have a B-D trend line that would be essentially flat, and the triangle trend lines would barely converge.
Within a contracting triangle, primary wave D may not move beyond the end of primary wave B below 1,123.08. Within a barrier triangle, primary wave D may end about the same level as primary wave B at 1,123.08, so that the B-D trend line is essentially flat. Only a new low reasonably below 1,123.08 would invalidate the triangle.
Within both a contracting and barrier triangle, primary wave E may not move beyond the end of primary wave C above 1,365.68.
Four of the five sub-waves of a triangle must be zigzags, with only one sub-wave allowed to be a multiple zigzag. Primary wave C is the most common sub-wave to subdivide as a multiple, and this is how primary wave C for this example fits best.
Primary wave D must be a single structure, most likely a zigzag.
One triangle sub-wave tends to be close to 0.618 the length of its predecessor; this gives a target for primary wave D.
There are no problems in terms of subdivisions or rare structures for this wave count. It has an excellent fit and so far a typical look.
DAILY CHART – TRIANGLE
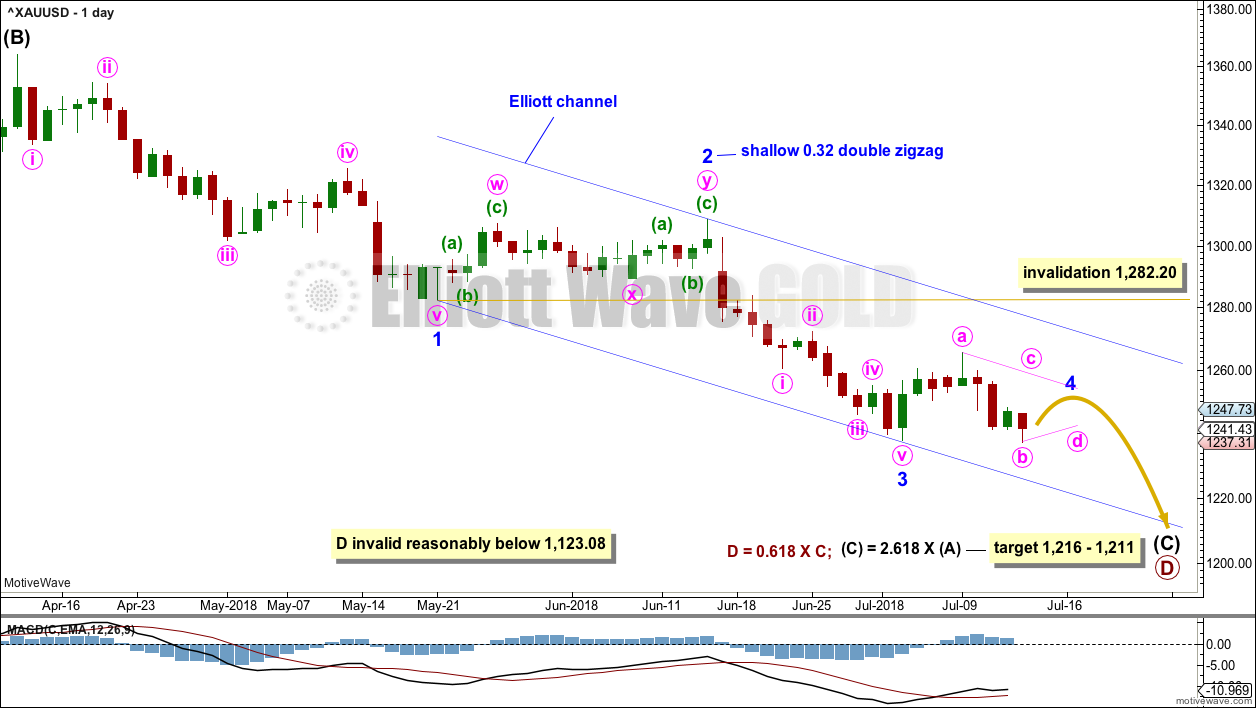
Click chart to enlarge.
Primary wave D may be unfolding lower as a single zigzag, and within it intermediate waves (A) and (B) may be complete.
The target is widened to a $5 zone calculated at two degrees. This should have a reasonable probability.
Within intermediate wave (C), it looks likely that all of minor waves 1, 2 and 3 may now be over. Minor wave 4 may now be about two thirds complete if it is a flat or combination, or it may be only about halfway complete if it is a triangle.
Minor wave 2 fits as a double zigzag, and was shallow. Given the guideline of alternation, minor wave 4 may most likely be a flat, combination or triangle; it may be very shallow, but it may also be deep in order to exhibit alternation with minor wave 2.
Minor wave 2 lasted 18 days, and it shows up on the weekly chart. Fourth waves for Gold are often quicker than second waves; minor wave 4 may last about one or two weeks. To label it over at the last high, labelled minute wave a, would see it too brief and would exhibit poor alternation with minor wave 2.
Minor wave 4 may not move into minor wave 1 price territory above 1,282.20.
Adjust the channel to fit as an Elliott channel drawn using Elliott’s first technique. If it is long lasting enough, then minor wave 4 may find resistance about the upper edge of this channel.
TECHNICAL ANALYSIS
WEEKLY CHART
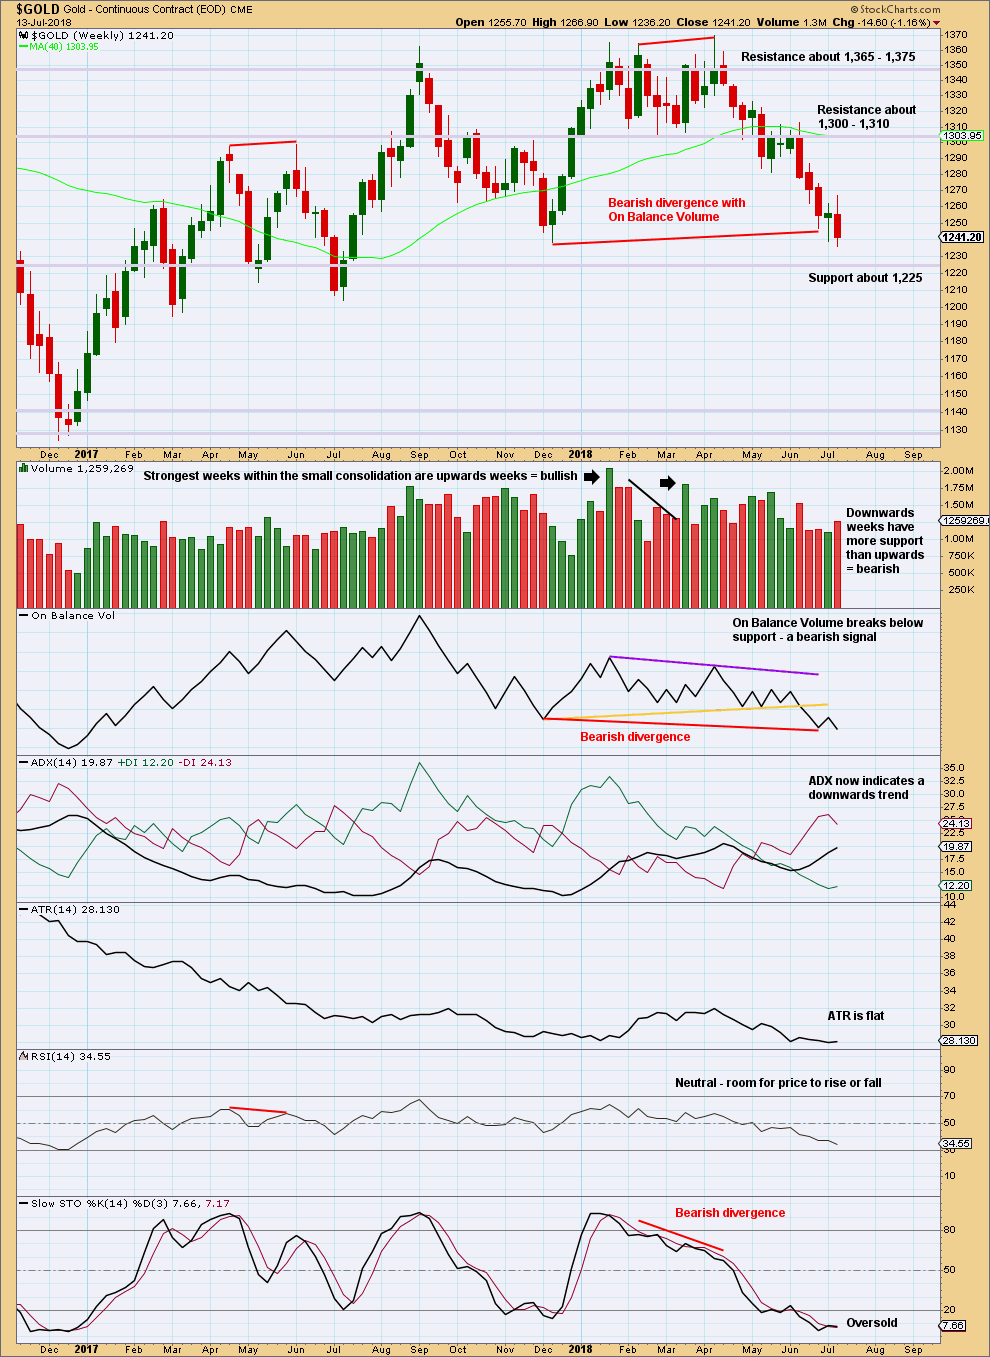
Click chart to enlarge. Chart courtesy of StockCharts.com.
A downwards week this week has support from volume.
There is single but weak bullish divergence between price and Stochastics.
DAILY CHART
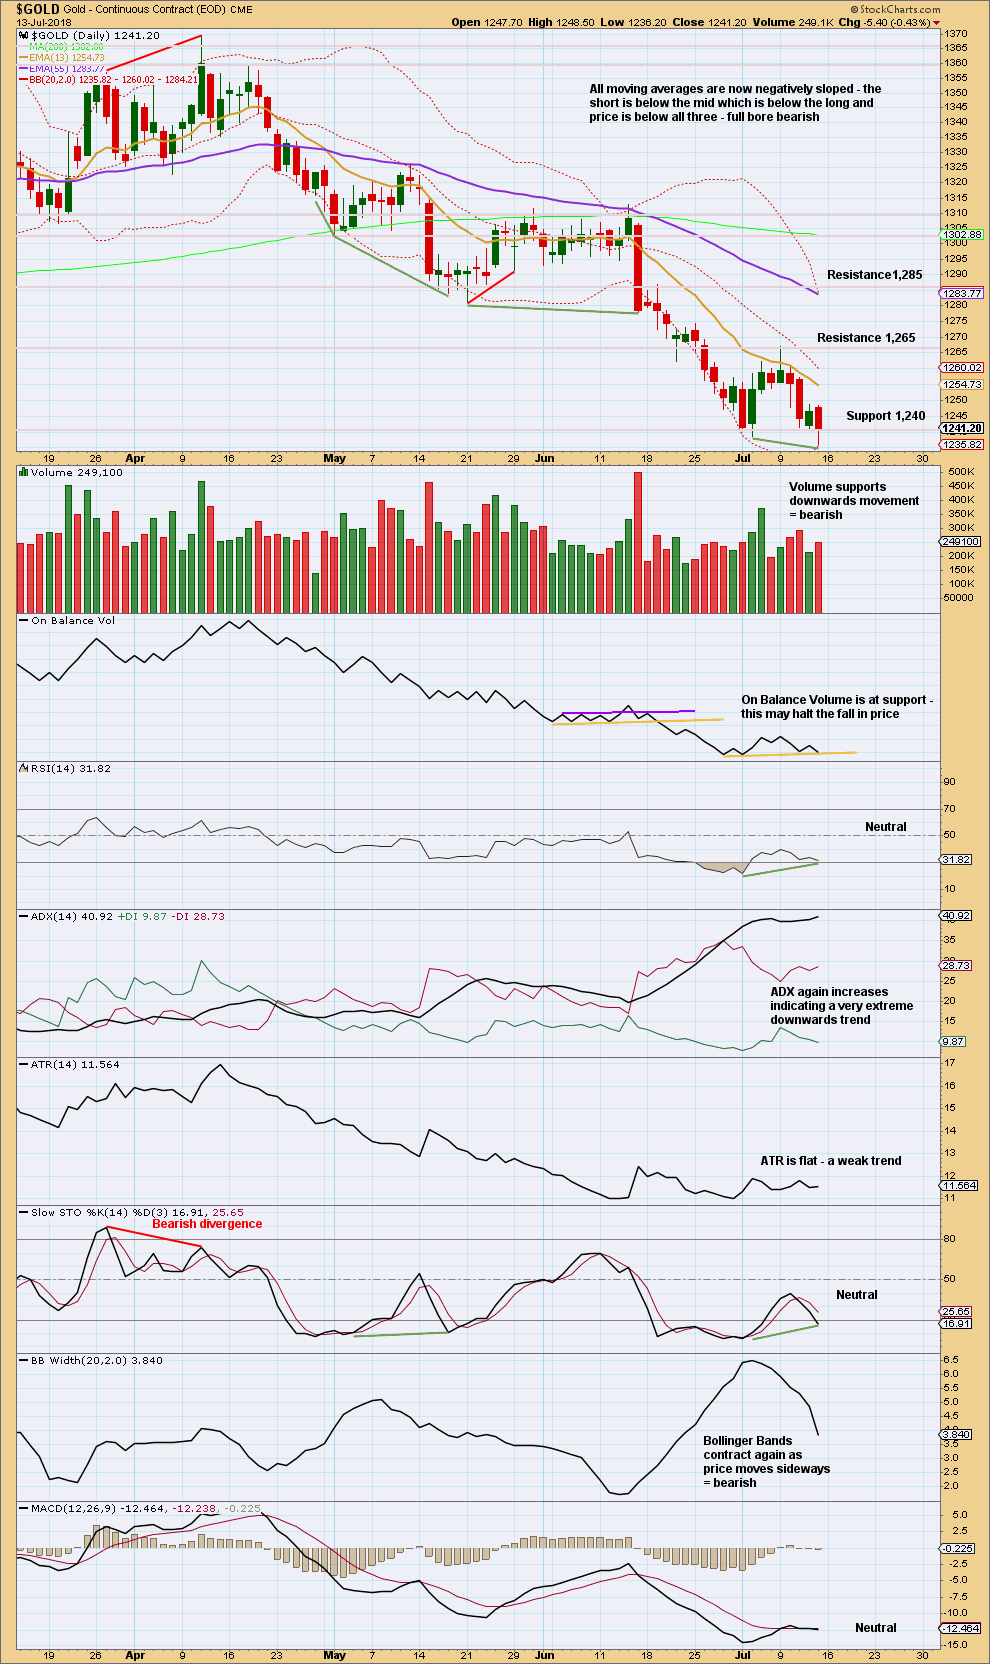
Click chart to enlarge. Chart courtesy of StockCharts.com.
The new low for Friday exhibits bullish divergence with RSI, Stochastics and possibly also On Balance Volume (although with On Balance Volume, it is essentially flat this is week).
The long lower wick on Friday’s candlestick is bullish. Overall, this chart offers some reasonable support to the idea that a small consolidation may continue here, within a larger downwards trend.
GDX WEEKLY CHART
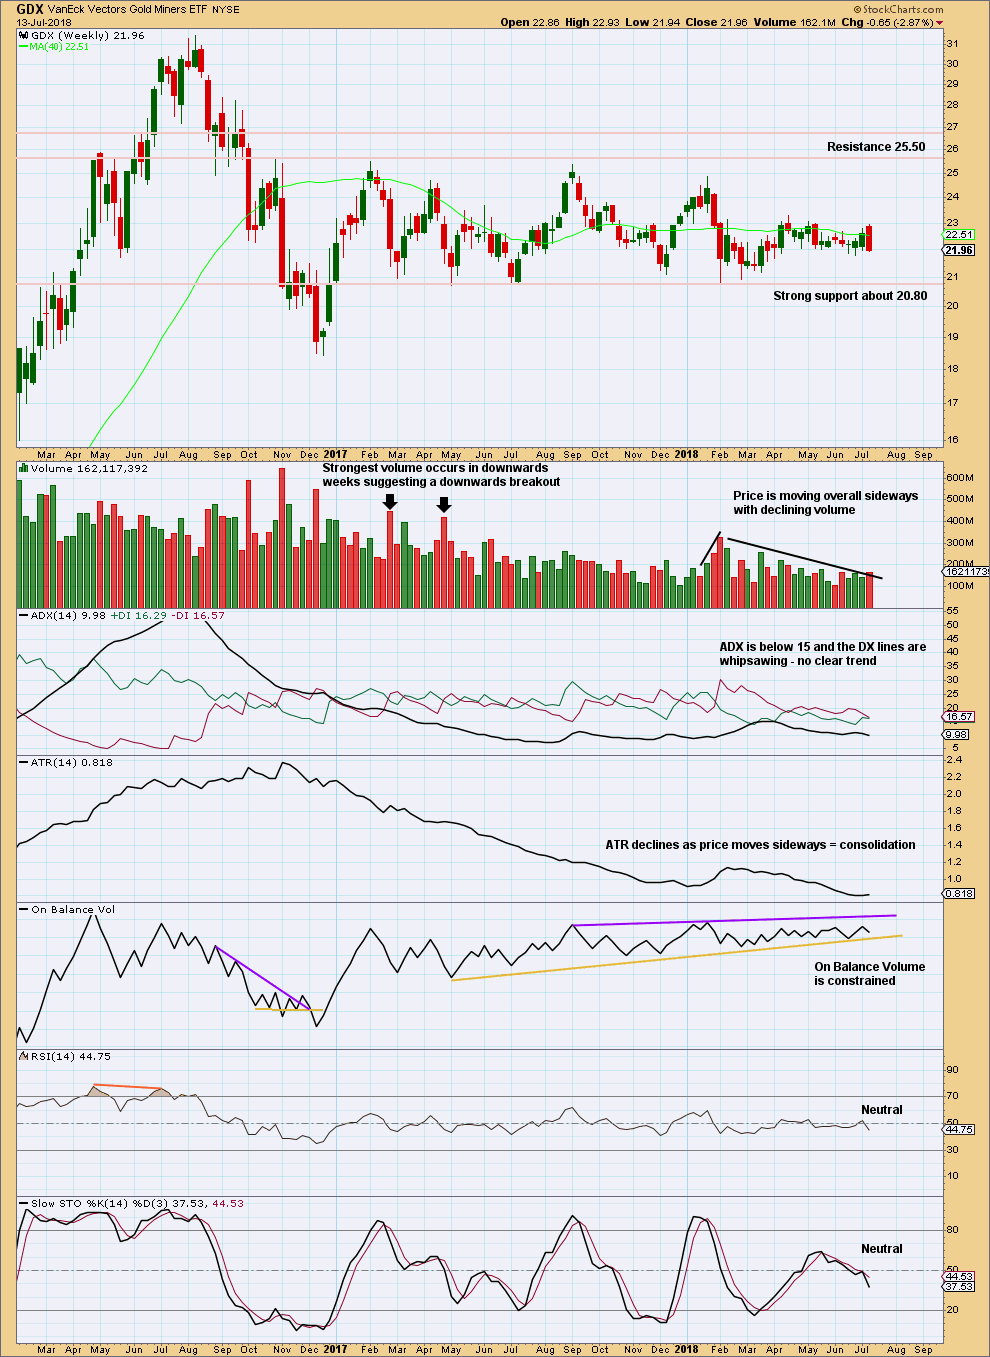
Click chart to enlarge. Chart courtesy of StockCharts.com.
Support about 20.80 has been tested about eight times and so far has held. The more often a support area is tested and holds, the more technical significance it has.
In the first instance, expect this area to continue to provide support. Only a strong downwards day, closing below support and preferably with some increase in volume, would constitute a downwards breakout from the consolidation that GDX has been in for a year now.
Resistance is about 25.50. Only a strong upwards day, closing above resistance and with support from volume, would constitute an upwards breakout.
There is some support this week for downwards movement from volume.
This weekly candlestick should not be read as a bearish engulfing pattern. For a candlestick reversal pattern to be read as such, there has to be something to reverse. Here, price is moving sideways and not trending.
GDX DAILY CHART
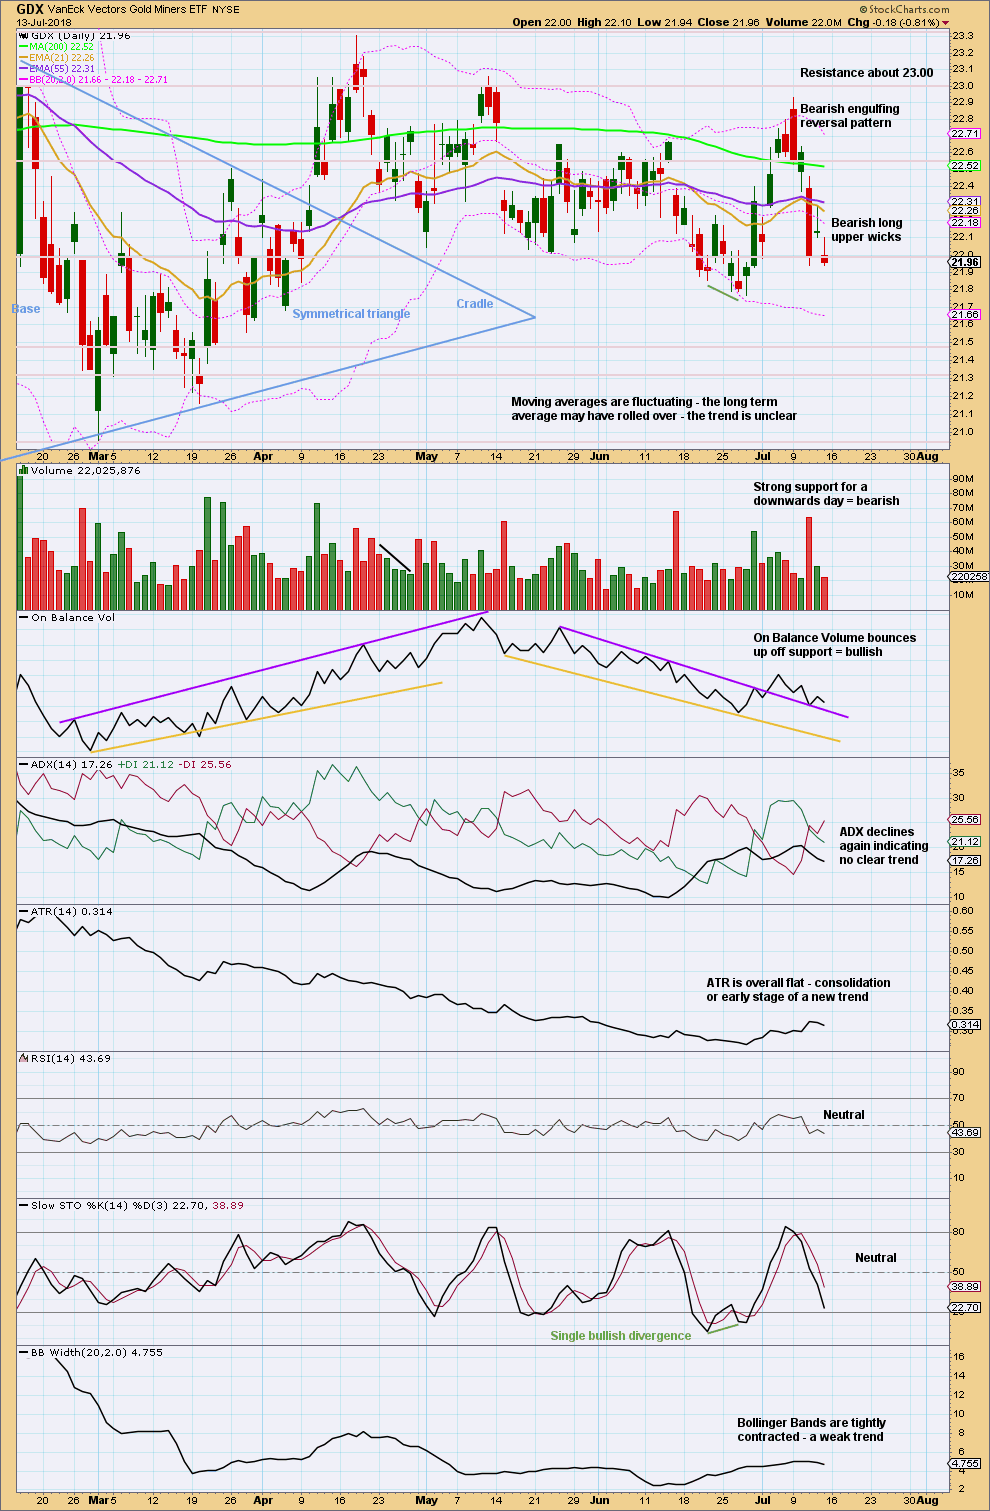
Click chart to enlarge. Chart courtesy of StockCharts.com.
Price is again testing support about 22.00. Bearish long upper wicks here suggest more downwards movement to begin next week.
Look for price to continue to support, which is next about 21.50 if 22.00 gives way. Look for downwards movement to end when price is at support and Stochastics is oversold. That is not the case yet.
US OIL
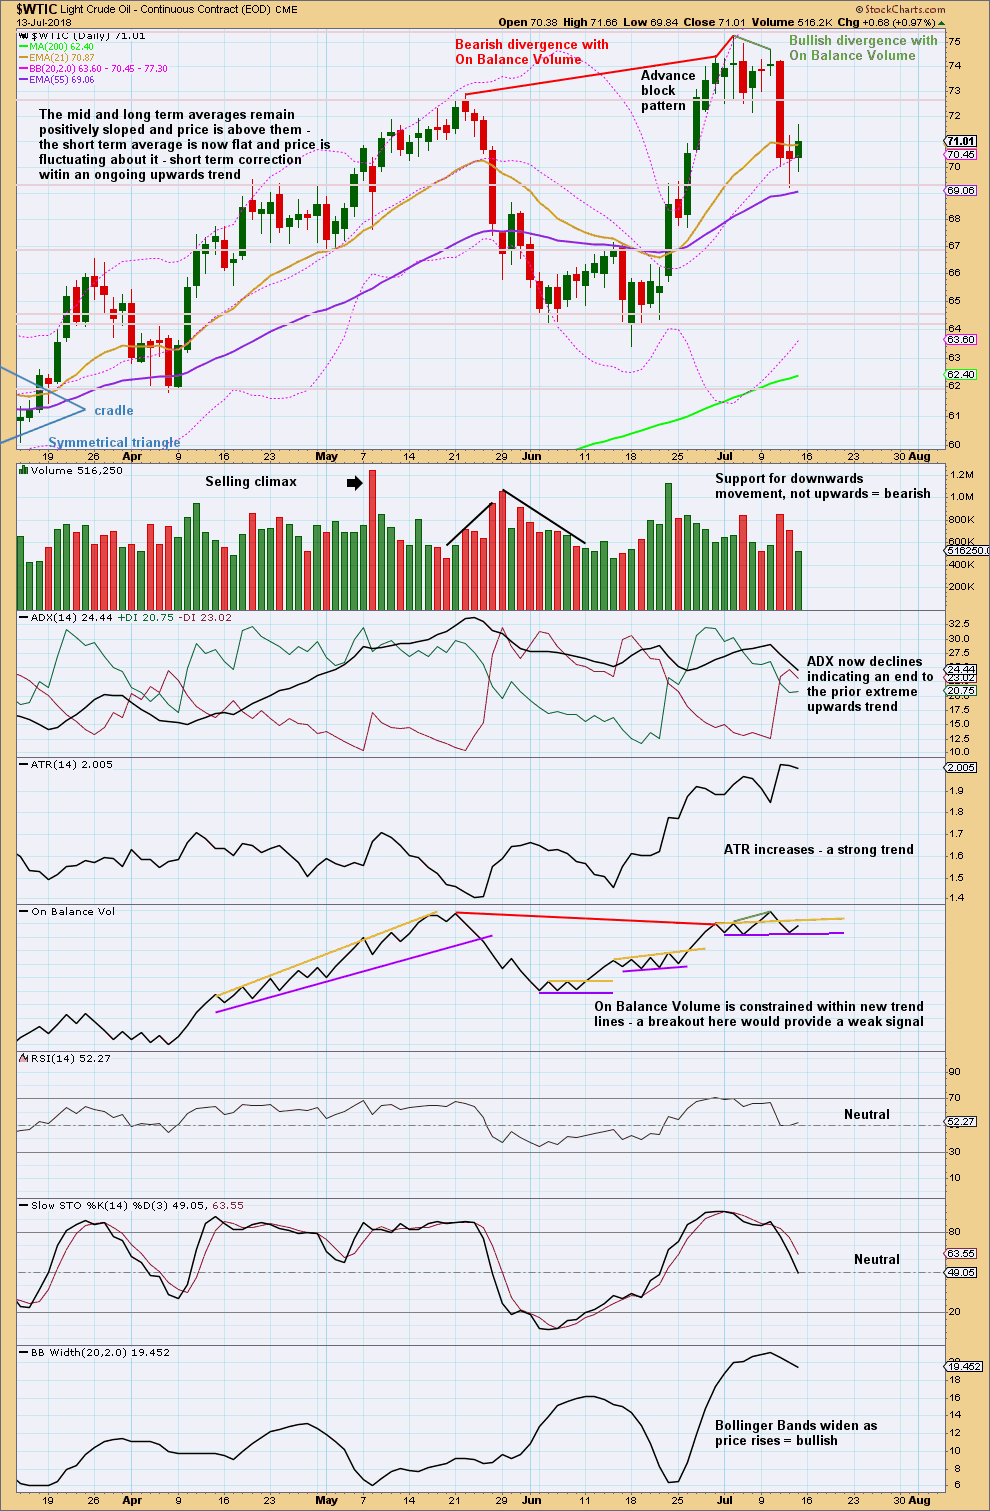
Downwards movement was expected for the week for US Oil, and this is exactly what has happened.
Summary: This downwards swing may now continue to about 61.22.
A deeper and longer lasting consolidation may be underway, which may last about 13 to 21 weeks in total. It should remain above 55.24, and the target is about 61.12. The consolidation will not move in a straight line; it may swing from resistance to support and back again in large swings. Once resistance and support are identified, then a swing trading system may be employed by more experienced traders. Support may now be about 63.0 and resistance may be about 75.25.
Always practice good risk management as the most important aspect of trading. Always trade with stops and invest only 1-5% of equity on any one trade. Failure to manage risk is the most common mistake new traders make.
MAIN WAVE COUNT
MONTHLY CHART
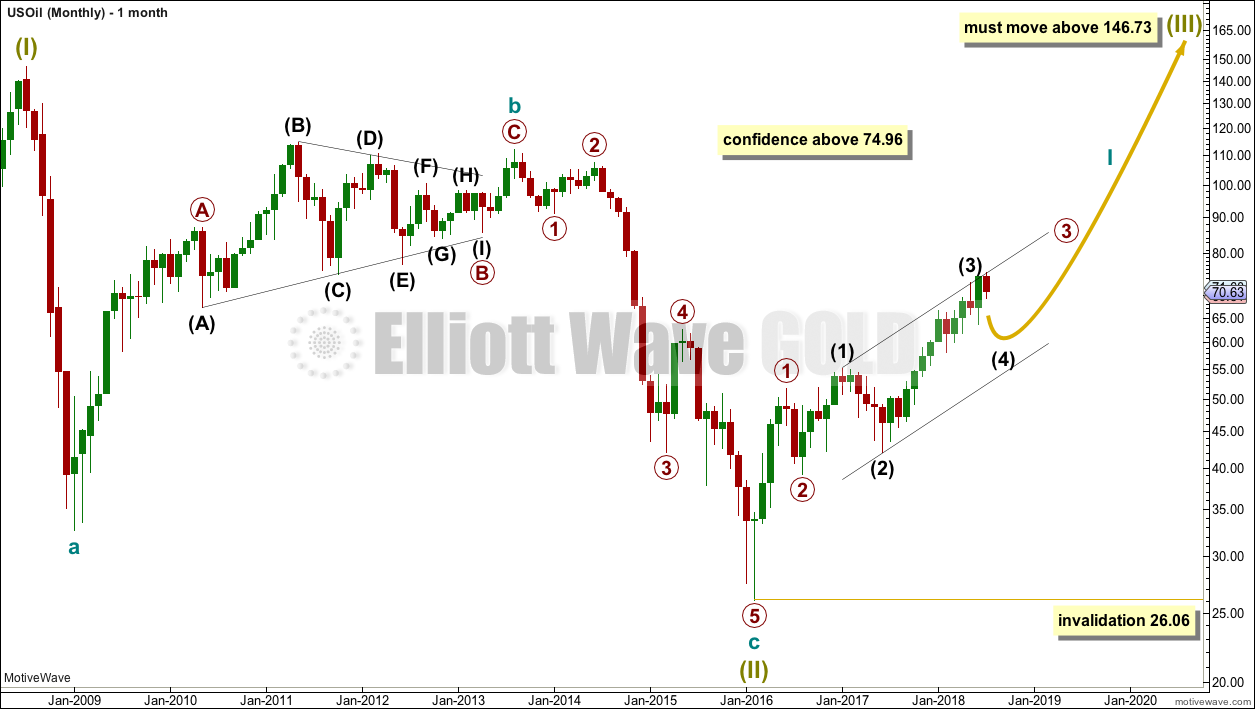
Click chart to enlarge.
It is possible that the bear market for Oil is over and a new bull market is in the very early stages.
A huge zigzag down to the last low may be complete and is labelled here Super Cycle wave (II).
Cycle wave b must be seen as complete in August 2013 for this wave count to work. It cannot be seen as complete at the prior major swing high in May 2011.
Cycle wave b is seen as a zigzag, and within it primary wave B is seen as a running contracting triangle. These are fairly common structures, although nine wave triangles are uncommon. All subdivisions fit.
Primary wave C moves beyond the end of primary wave A, so it avoids a truncation. But it does not have to move above the price territory of primary wave B to avoid a truncation, which is an important distinction.
If cycle wave b begins there, then cycle wave c may be seen as a complete five wave impulse.
Super Cycle wave (III) must move beyond the end of Super Cycle wave (I). It must move far enough above that point to allow room for a subsequent Super Cycle wave (IV) to unfold and remain above Super Cycle wave (I) price territory.
Cycle wave I may be incomplete. It may be unfolding as an impulse and may have now moved through the middle portion. Commodities have a tendency to exhibit swift strong fifth waves, and this tendency is especially prevalent for third wave impulses. Intermediate wave (5) to end primary wave 3 may be very swift and strong, ending with a blow off top.
When cycle wave I is complete, then cycle wave II may be a deep correction that may not move beyond the start of cycle wave I below 26.06.
Data from FXCM for USOil does not go back to the beginning of Super Cycle wave (I). Without an accurate known length of Super Cycle wave (I) a target cannot be calculated for Super Cycle wave (III) to end using Fibonacci ratios. The target for Super Cycle wave (III) may be calculated when cycle waves I, II, III and IV within it are complete. That cannot be done for many years.
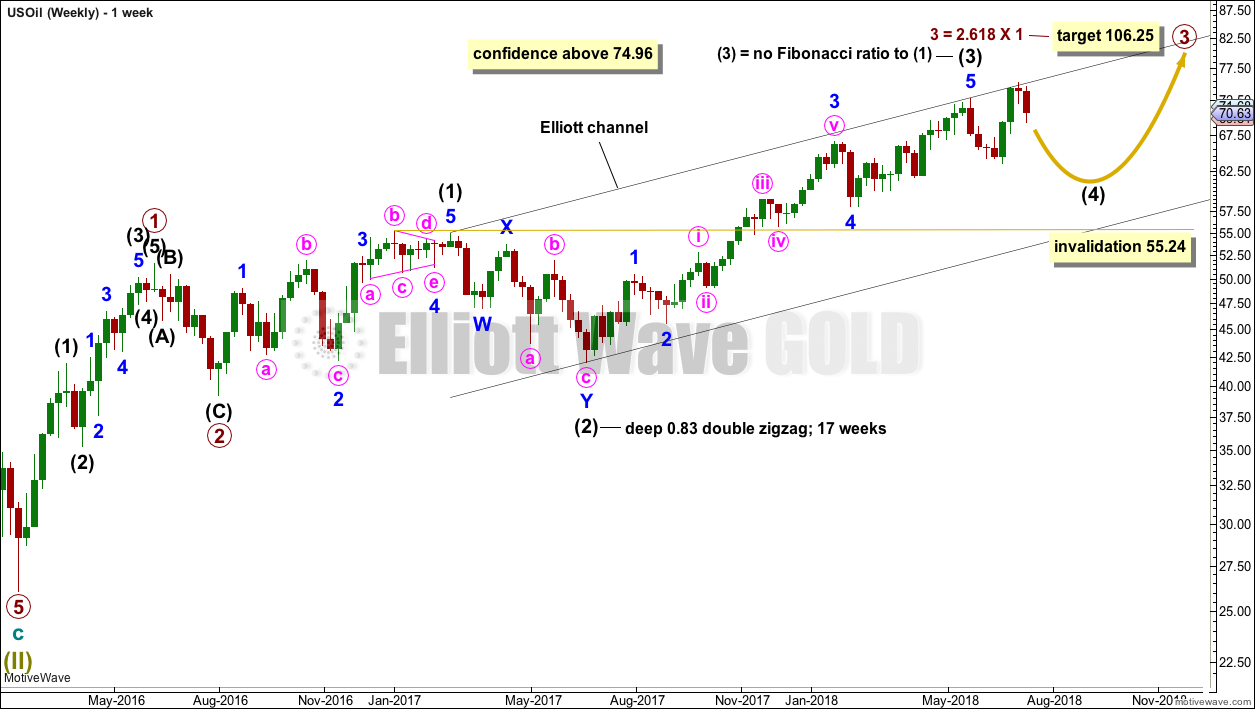
WEEKLY CHART
Click chart to enlarge.
Intermediate wave (3) may now be complete. There is no Fibonacci ratio between intermediate waves (1) and (3), and intermediate wave (3) is longer than 1.618 the length of intermediate wave (1).
This wave count fits with classic technical analysis at the monthly and daily chart levels.
Intermediate wave (2) was a deep double zigzag. Given the guideline of alternation, intermediate wave (4) may be expected to most likely be a shallow flat, triangle or combination. It may be about even in duration with intermediate wave (2), or it may be a little longer because triangles and combinations are more time consuming structures.
In the first instance, a Fibonacci 13 weeks may be expected for intermediate wave (4). If about that time the structure is incomplete, then the next Fibonacci number in the sequence at 21 will be expected. At this stage, it has lasted only 7 weeks.
Intermediate wave (4) may find support about the lower edge of the black Elliott channel. It may end within the price territory of the fourth wave of one lesser degree; minor wave 4 has its territory from 66.65 to 59.13.
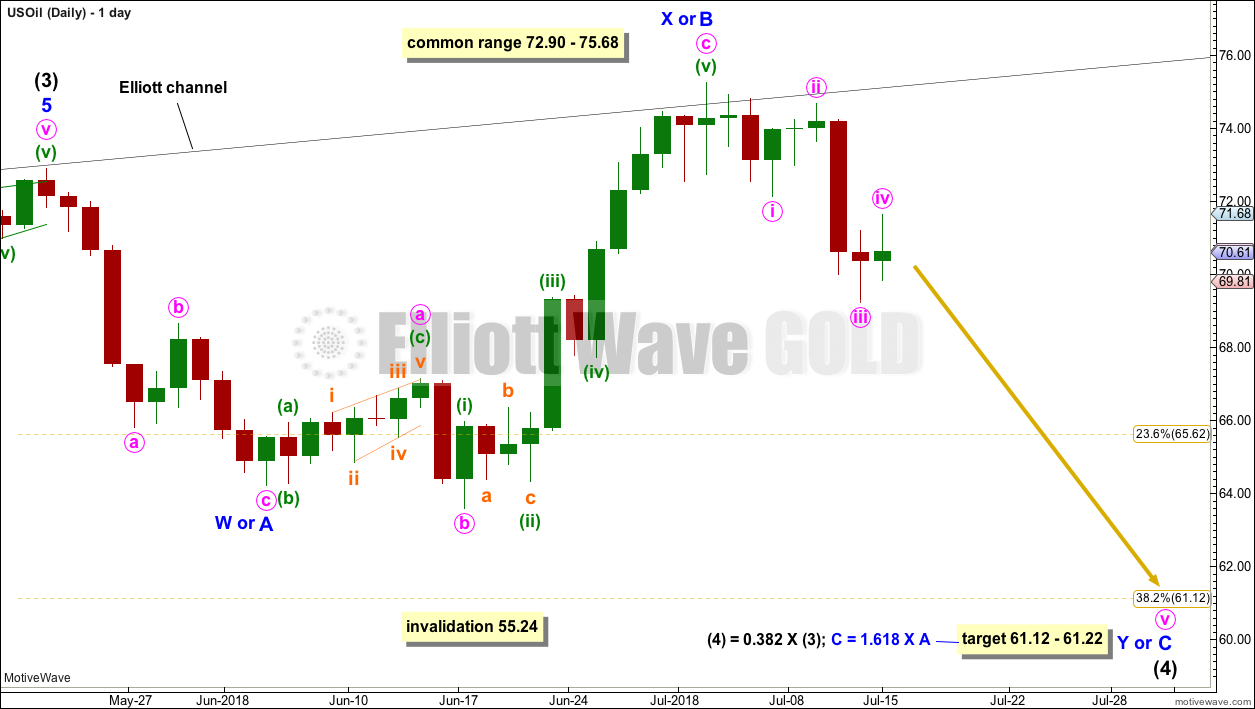
DAILY CHART
Click chart to enlarge.
If intermediate wave (4) unfolds as a double combination, flat or triangle, then the first wave down within it would be a three wave structure and most likely a zigzag.
All of a flat, combination or triangle may have within them a new high above the start of intermediate wave (4) at 72.90 as in an expanded flat, running triangle or wave X of a double combination. There can be no upper invalidation point for this reason.
It is impossible at this stage to tell which of several possible structures intermediate wave (4) may be, only that it is least likely to be a single or multiple zigzag. Focus will be on identifying when intermediate wave (4) may be over.
The zigzag down may be minor wave A within a flat or triangle for intermediate wave (4), or it may be a zigzag within a double combination for intermediate wave (4).
The movement labelled minor wave B or X looks like an expanded flat correction. Minute wave c now fits as a completed five wave impulse. Minor wave B or X is a 1.27 length of minor wave A or W. This is within the common range of 1 to 1.38 for wave B of a flat correction.
If intermediate wave (4) is unfolding as a flat correction, then within it minor wave B has now met the minimum 0.9 length of minor wave A. With minor wave B a 1.27 length of minor wave A, intermediate wave (4) may be unfolding as an expanded flat correction, which is the most common type. Minor wave C of a flat correction must unfold as a five wave structure.
If intermediate wave (4) is unfolding as a triangle, then there is no minimum requirement for minor wave B within it. With minor wave B ending beyond the start of minor wave A, intermediate wave (4) may be a running triangle. Minor wave C of a triangle must unfold as a single or double zigzag.
If intermediate wave (4) is unfolding as a combination, then there is no minimum nor maximum length required for minor wave X. Minor wave Y of a combination may unfold as a flat or triangle.
Intermediate wave (4) may not move into intermediate wave (1) price territory below 55.24.
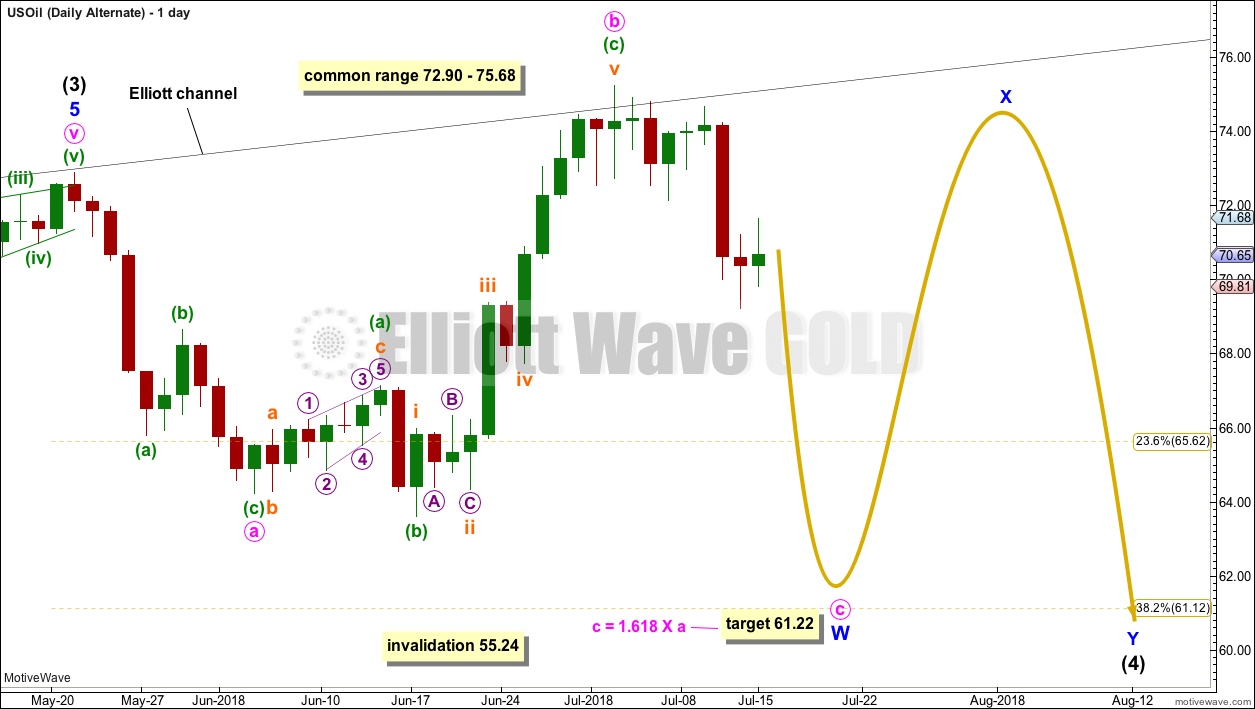
ALTERNATE DAILY CHART
Click chart to enlarge.
This alternate wave count is identical to the first daily chart above except for the degree of labelling within intermediate wave (4) which is moved down one degree.
Intermediate wave (4) may be unfolding as a double combination, with the first structure in a double an expanded flat correction labelled minor wave W. Double combinations are very common structures.
The short term expectation for some downwards movement about here is exactly the same for both wave counts. If minute wave b moves higher, then it would most likely end at or before 75.68. At the last high, minute wave b is a 1.27 length to minute wave a; this is within the normal range.
TECHNICAL ANALYSIS
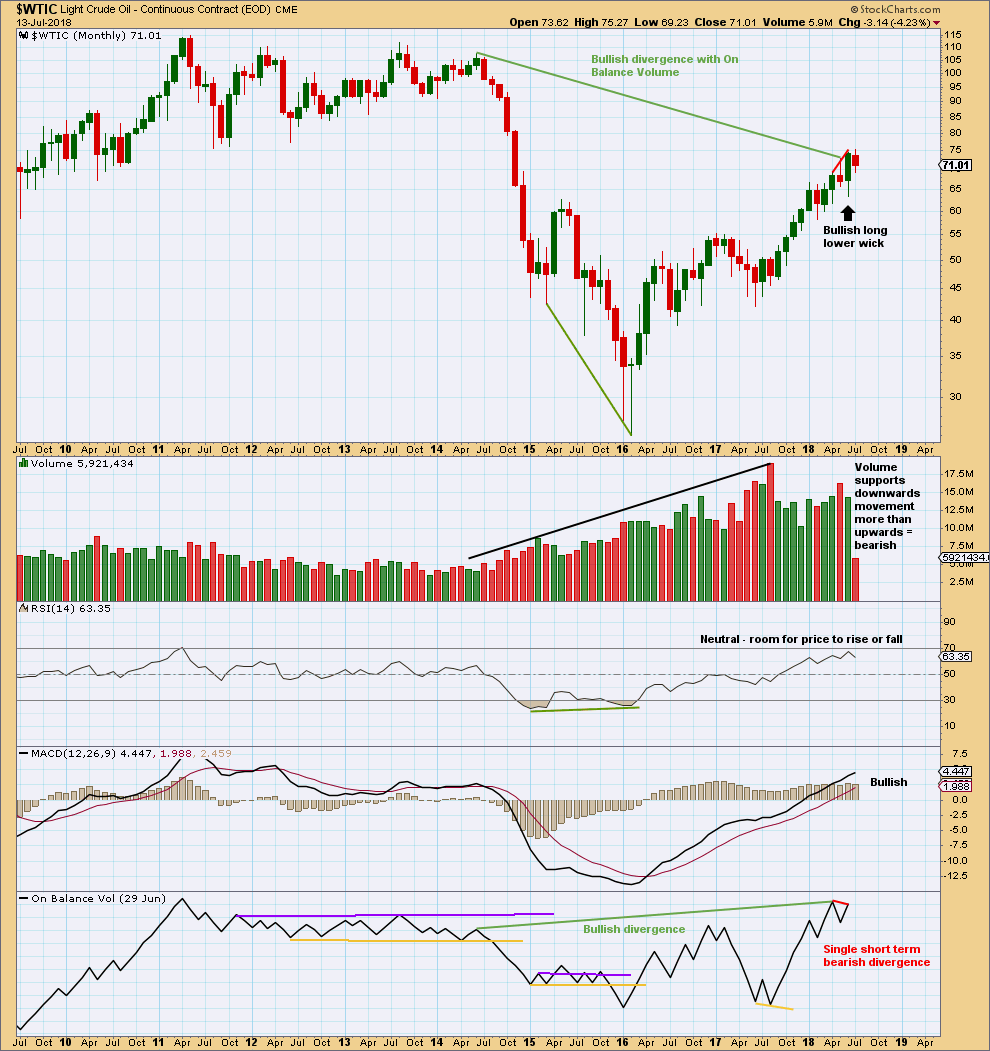
MONTHLY CHART
Click chart to enlarge. Chart courtesy of StockCharts.com.
The short term volume profile is bearish: the strongest month in the last few months was the downwards month of May (where the balance of volume was down) and now June shows a decline in volume, so volume has not supported upwards movement here.
For the short term, On Balance Volume is also slightly bearish. This supports the idea that price may be within a correction and not necessarily a continuation of the larger upwards trend.
However, it is entirely possible that this situation could reverse and volume could start to support upwards movement, as has happened back in January 2018.
The larger trend is upwards.
DAILY CHART
Click chart to enlarge. Chart courtesy of StockCharts.com.
ADX now indicates no clear trend; the market may be consolidating.
Expect swings from support to resistance and back again, using Stochastics to indicate when each swing may end. With Stochastics reaching overbought at the last highs, resistance may now be about 75.25 and support may be about 63.40. Expect a downwards swing here to support, which may end when price finds support and Stochastics reaches oversold.
Lara,
What would be the next target for Primary D of gold if the current low of $1212 at
D = C x .618 doesn’t hold?
I’ve found triangle sub-waves are often about 0.8 to 0.85 the length of the prior wave.
That gives a target of about 1,172 to 1,159 for primary D to end.
Lara,
Right near the beginning of the GOLD section you write:
“Last historic analysis with monthly charts and several weekly alternates is here, video is here.”
Could you please check the links. It seems they bring you to the master page or 1st page where I do not have access. Thanks in advance.
I’m really sorry everybody. I’ve fixed the problem now, you should all have access to those posts.
And thank you very much Rodney for pointing it out.
Updated daily chart for US Oil:
There is now a nice clear five down. Look now for a bounce, a three up.
I’ll label the five down minute i, and the three up minute ii. Targets for minute ii are the 0.382 and 0.618 Fibonacci ratios, favouring neither in this case. Look for the 0.382 first, and if price gets there and it looks like a three on the daily chart it could be over. But if price gets there and it doesn’t look like a three, then look for more upwards movement to the 0.618.
When this bounce is done we may then expect another wave down to move well below mintue i.
If any of this does not make sense, please ask questions here in comments. I’ll be checking daily and will reply.
Updated daily chart for Gold:
there is strength yesterday in this downwards movement so I don’t want to consider it as wave B within minor wave 4. B waves should exhibit weakness.
I’m going to consider minor 4 was over much more quickly than expected, exhibiting poor alternation and poor proportion to minor wave 2. It’s not the most common scenario (which is why it’s not what I expected) but it’s acceptable for this market. For Gold it’s fourth waves can be quicker than it’s second waves, and if they fail to exhibit alternation then they are sometimes both zigzags. Zigzags are by the widest margin the most common corrective structure.
On down now towards the target. I’ll be looking for one or more of the following things to signal a low in place:
– a bullish candlestick reversal pattern
– one to a few long lower candlestick wicks
– clear and strong bullish divergence between price and Stochastics while Stochastics is oversold
– clear and strong bullish divergence between price and RSI while RSI is oversold (this doesn’t have to be as strong as Stochastics)
Thank you Lara. This seems to fit well with what seems to be happening in the Gold front as well as miners seeming to hold off even as Gold was going down.
Ditto. Thanks Lara for the mid-week update. With this morning’s (7/19) premarket, gold and silver are down hard again. It looks like God may hit the target today or tomorrow. We may even see an overshoot or Minor 5 extension.
With regards to the Primary wave E, do you expect that it will end midway to the upper triangle boundary or move further to tag the upper triangle line?
I expect primary E to fall reasonably short of the upper trend line. Thats the most common look for E waves.
I’ll have a target for it, 0.618 X primary D.
Lara,
We had some overlap this morning. Also today was outside day up. If an outside day is taken out within next 2 days then I look for a end of trend. My pink bar is 160 bars from point 0. A wave count should complete in 140 to 160 bars. If 5=1 then I come up with 2840. I do know this would be a very minor trend. (Minute i of minor 3)
I guess your alternate is looking possible.
I’m not sure how to fit this puzzle together but I have one other idea expanded flat. Overlap of 2791 would be aloud as well as well pull backs that don’t overlap 2742. Would that be correct? I also count this wave 3 could last till October.
Anyway hope you don’t mind me I’m trying to learn this and self taught isn’t easy. Just looking for way to allow for today’s overlap.
I’m really leaning towards the main daily wave count now for the S&P.
Now minute wave iii has to move far enough above the high of minute wave i which was at 2,791.47 so that there is room for minute wave iv to unfold and remain above first wave price territory.
That does not mean we may have a small pullback, one or two (even three) small red daily candlesticks or doji, along the way up.
But overall to the target I’m expecting minute wave iii to continue on higher to 2,878. About there.
On Balance Volume is making new all time highs on the daily chart. That is extremely bullish.
But a note of caution: the AD line has very short term bearish divergence.
Thank you Lara
Great analysis and commentary, Lara. Thanks.
I find it quite interesting that despite gold’s continual decline, GDX is not following it lower. Do you think this means once gold starts the Primary E wave up in the triangle that the corresponding up move in GDX will be quite strong? Also, do you expect the Primary E wave to fall short of the upper triangle line?
it is interesting isn’t it. I think for now it signals some weakness in this downwards move in Gold price.
I don’t think GDX may necessarily move strongly higher when Gold has primary E though. GDX has formidable resistance ahead. It could just move sideways
rodney,
I’ve noticed some divergences in the leveraged ETF and the indices they track. As well agree with your observation on these gold miners.
Now what does it take to encourage someone smarter then me to create a useful indicator 🙂