

S&P 500
A very short range inside day does not change the Elliott wave count. Price remains within the channel and above the short term invalidation point.
At the end of the week, on the weekly time period, new signals from On Balance Volume and the AD line give confidence in the larger picture for the Elliott wave count.
Summary: The bigger picture is that this bull market is ageing, but there is not yet enough technical evidence that it is fully mature. The Elliott wave count is also incomplete.
On Balance Volume and the AD line this week both make new all time highs. This is extremely bullish. Expect upwards movement as very likely next week.
Use the new best fit channel on the daily chart for possible support for any deeper pullbacks. Pullbacks are an opportunity to join the trend.
The next short term target is about 2,878; a consolidation lasting about one to two weeks may be expected at about this target. Following that, another consolidation lasting about two weeks may be expected about 2,915.
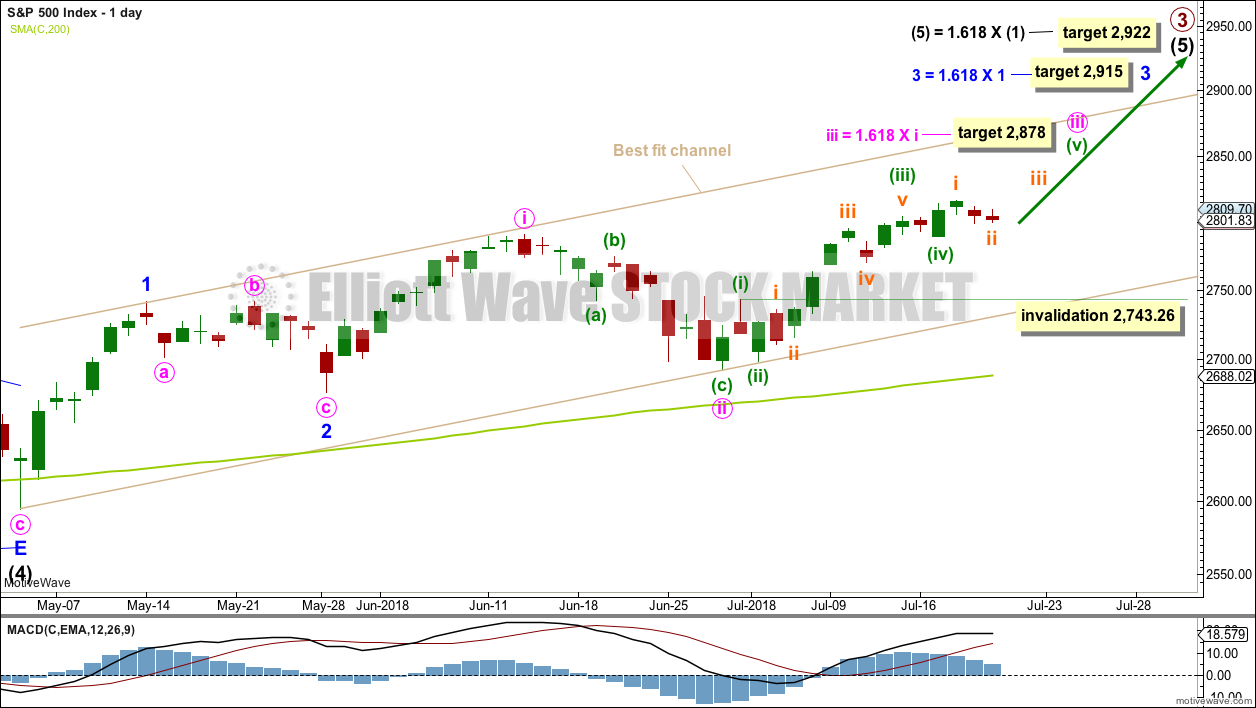
The invalidation point may now be moved up to 2,743.26.
The mid to longer term target is at 2,922 (Elliott wave) or 3,045 (classic analysis). Another multi week to multi month correction is expected at one of these targets.
The final target for this bull market to end remains at 3,616.
Always practice good risk management. Always trade with stops and invest only 1-5% of equity on any one trade.
The biggest picture, Grand Super Cycle analysis, is here.
Last historic analysis with monthly charts is here, video is here.
ELLIOTT WAVE COUNT
WEEKLY CHART
Click chart to enlarge.
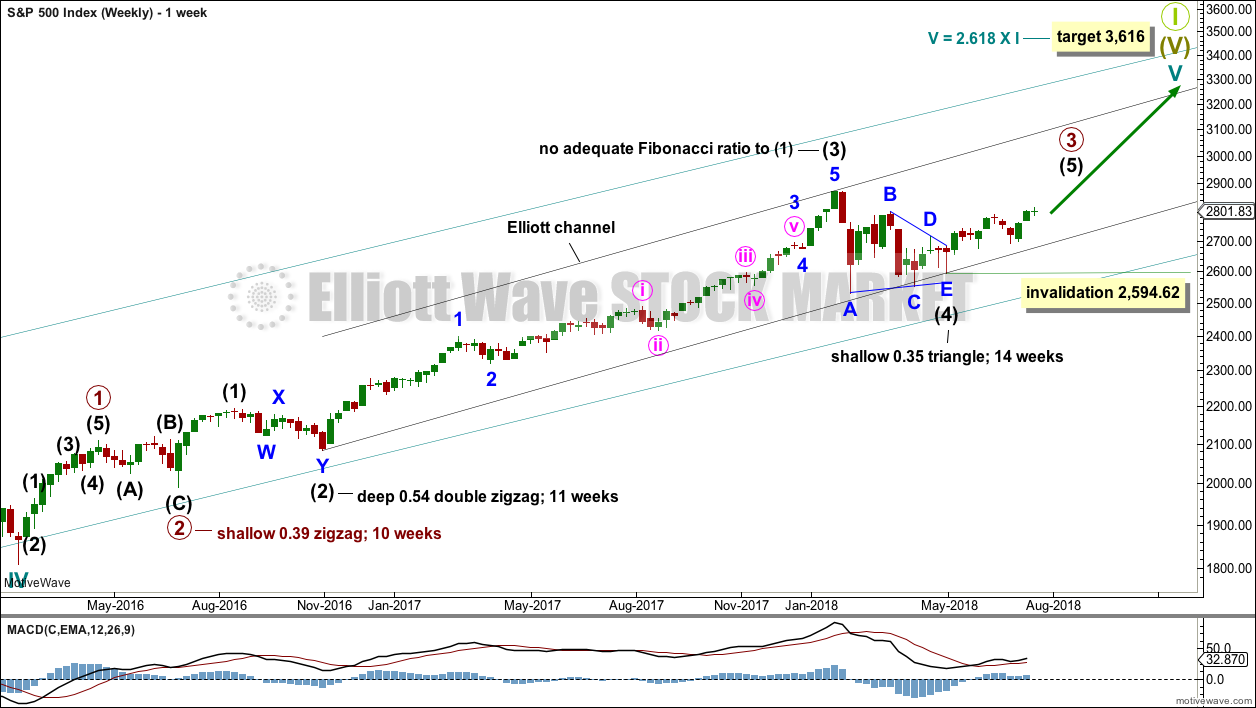
Cycle wave V must complete as a five structure, which should look clear at the weekly chart level and also now at the monthly chart level. It may only be an impulse or ending diagonal. At this stage, it is clear it is an impulse.
Within cycle wave V, the third waves at all degrees may only subdivide as impulses.
Intermediate wave (4) has breached an Elliott channel drawn using Elliott’s first technique. The channel is redrawn using Elliott’s second technique: the first trend line from the ends of intermediate waves (2) to (4), then a parallel copy on the end of intermediate wave (3). Intermediate wave (5) may end either midway within the channel, or about the upper edge.
Intermediate wave (4) may now be a complete regular contracting triangle lasting fourteen weeks, one longer than a Fibonacci thirteen. There is perfect alternation and excellent proportion between intermediate waves (2) and (4).
Within intermediate wave (5), no second wave correction may move beyond the start of its first wave below 2,594.62. However, the lower edge of the black Elliott channel drawn across the ends of intermediate degree waves should provide very strong support for any deeper pullbacks, holding price well above the invalidation point while intermediate wave (5) unfolds.
At this stage, the expectation is for the final target to me met in October 2019.
A multi week to multi month consolidation for primary wave 4 is expected on the way up to the final target.
The last bullish fifth wave of minor wave 5 to end intermediate wave (3) exhibited commodity like behaviour. It was strong and sustained. It is possible that the upcoming wave of minor wave 5 to end intermediate wave (5) to end primary wave 3 may exhibit similar behaviour, so we should be on the lookout for this possibility.
DAILY CHART
Click chart to enlarge.
Intermediate wave (5) would be very likely to make at least a slight new high above the end of intermediate wave (3) at 2,872.87 to avoid a truncation.
Intermediate wave (3) exhibits no Fibonacci ratio to intermediate wave (1). It is more likely then that intermediate wave (5) may exhibit a Fibonacci ratio to either of intermediate waves (1) or (3). The most common Fibonacci ratio would be equality in length with intermediate wave (1), but in this instance that would expect a truncation. The next common Fibonacci ratio is used to calculate a target for intermediate wave (5) to end.
A target is now calculated for minute wave iii to end, which expects to see the most common Fibonacci ratio to minute wave i. Minute wave iii may last a few weeks. When it is complete, then minute wave iv may last about one to two weeks in order for it to exhibit reasonable proportion to minute wave ii. Minute wave iv must remain above minute wave i price territory.
Minute wave iii may have passed its middle strongest portion last week. Although the structure could possibly be seen as complete at Wednesday’s high, it has still not moved far enough above the end of minute wave i yet to allow room for minute wave iv to unfold and remain above minute wave i price territory. For that to happen it looks like minuette wave (v) may be a relatively long extension, so that minute wave iii moves higher.
A target is calculated for minor wave 3 to end, which expects to see the most common Fibonacci ratio to minor wave 1. Minor wave 3 may last several weeks in total and should look like an impulse at the daily chart level. When it is complete, then minor wave 4 may last about one to two weeks in order for it to exhibit reasonable proportion to minor wave 2. Minor wave 4 must remain above minor wave 1 price territory.
Within minute wave iii, minuette wave (i) is complete as labelled. Minuette wave (iv), if it continues lower, may not move into minuette wave (i) price territory below 2,743.26.
A best fit channel is added in taupe to this chart. It contains all of intermediate wave (5) so far. The lower edge may provide support for any deeper pullbacks. The upper edge may provide resistance.
TECHNICAL ANALYSIS
WEEKLY CHART
Click chart to enlarge. Chart courtesy of StockCharts.com.
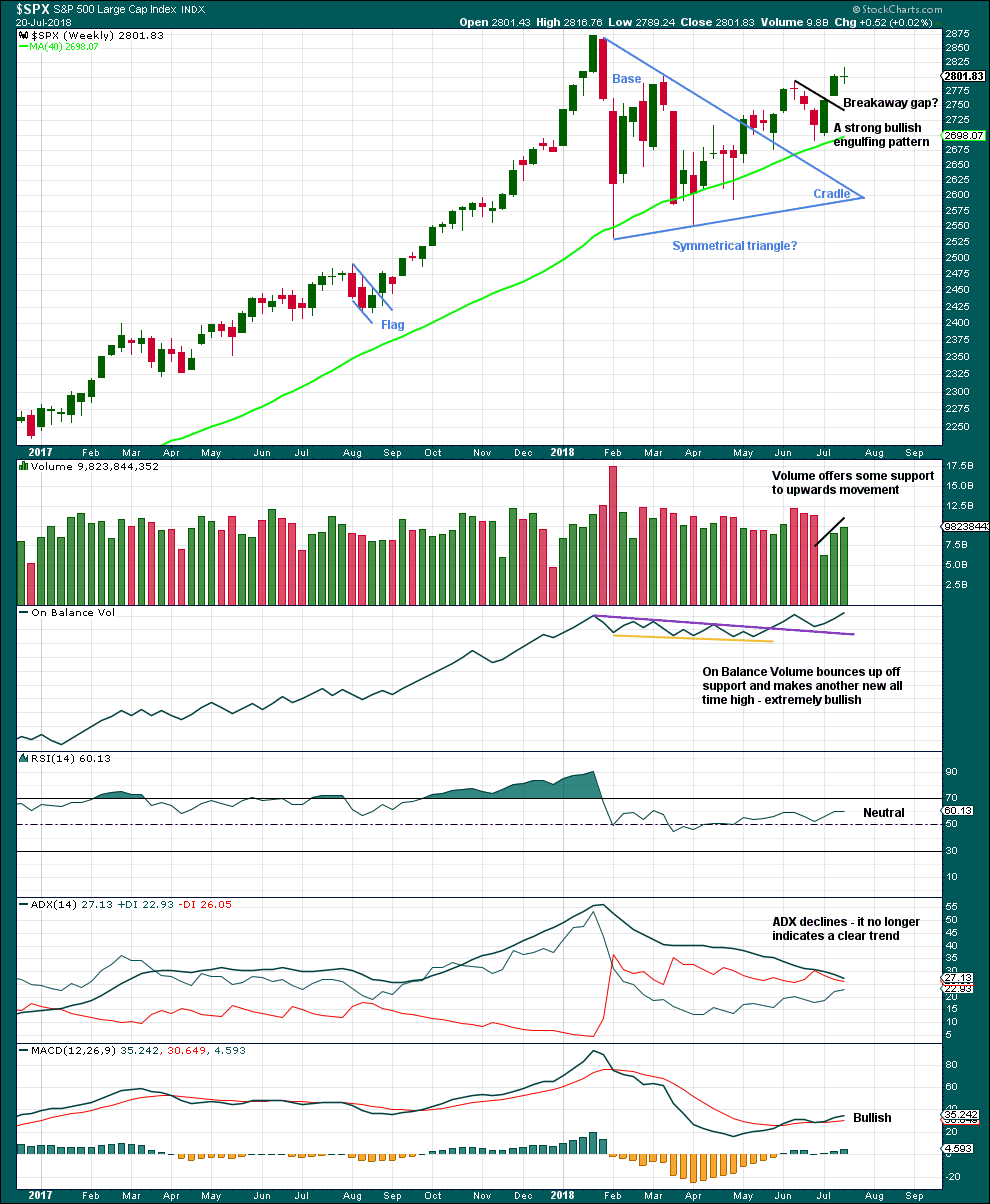
Much weight will be given in this analysis to the new all time high from On Balance Volume. Price usually follows where On Balance Volume leads. It is very reasonable here to expect a new all time high from price in coming weeks.
With volume also supporting another upwards week, this chart is very bullish.
The doji candlestick this week on its own is not a reversal signal. Doji represent a pause and can occur within a trend. There are a few examples in the prior bull run of doji on the weekly chart which were followed by more upwards movement and no reasonable pullback.
DAILY CHART
Click chart to enlarge. Chart courtesy of StockCharts.com.
The symmetrical triangle may now be complete. The base distance is 340.18. Added to the breakout point of 2,704.54 this gives a target at 3,044.72. This is above the Elliott wave target at 2,922, so the Elliott wave target may be inadequate.
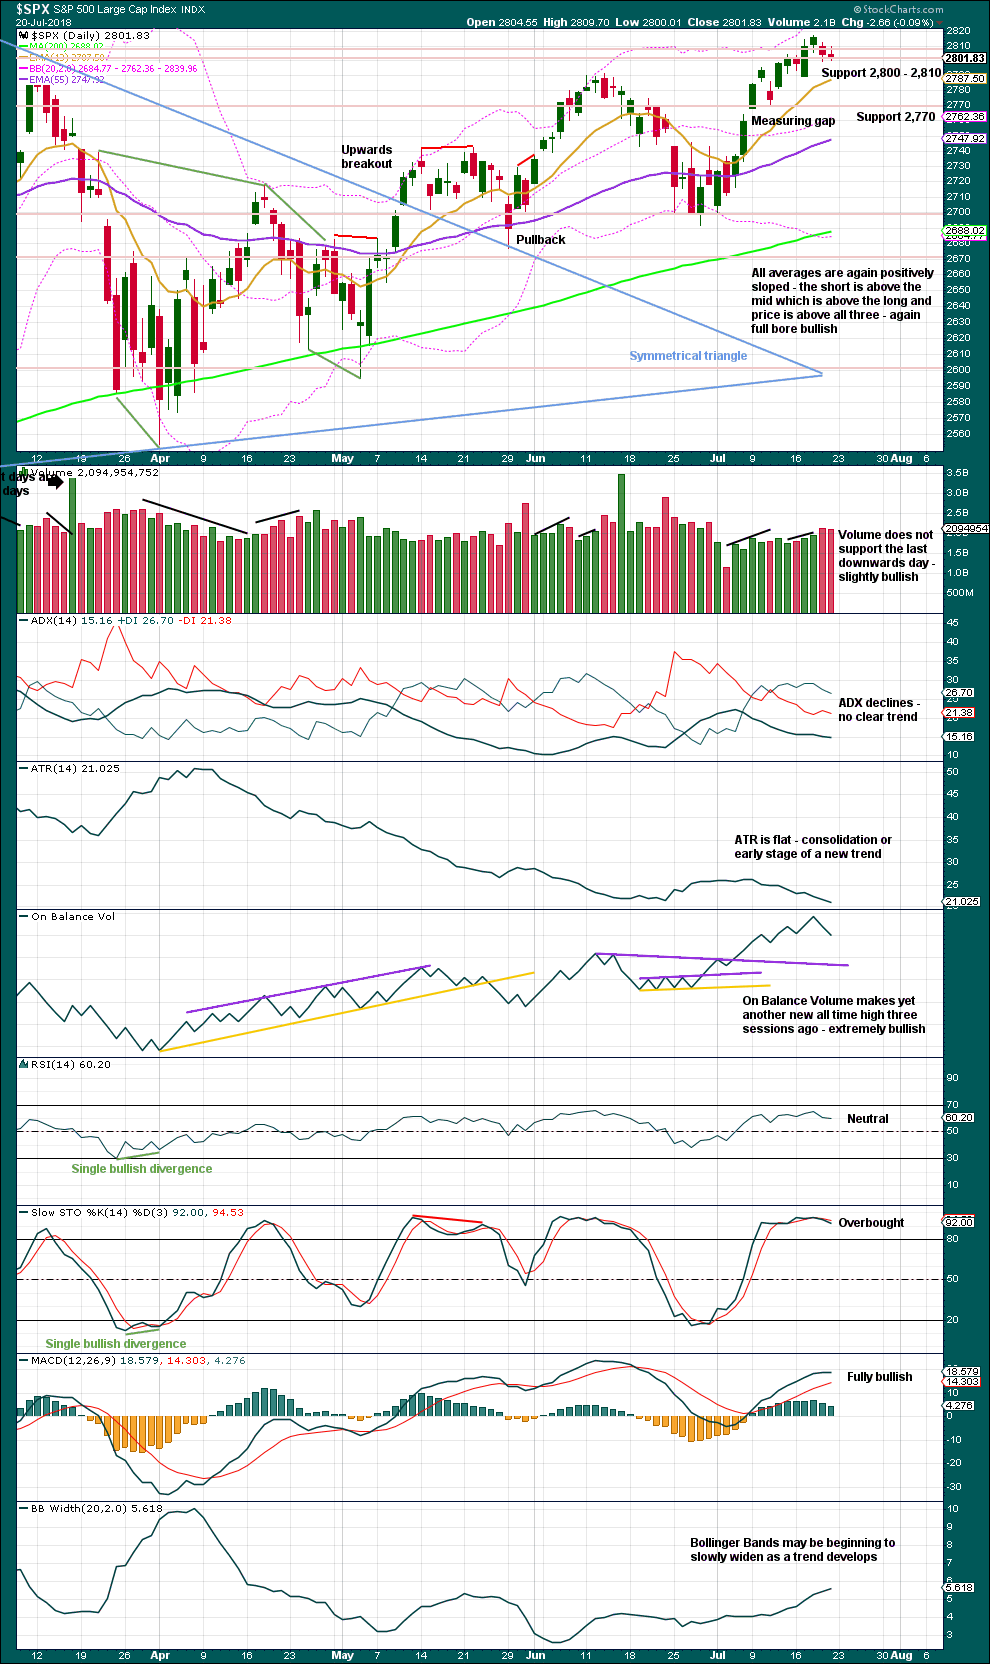
Since the low on the 2nd of April, 2018, price has made a series of higher highs and higher lows. This is the definition of an upwards trend. But trends do not move in perfectly straight lines; there are pullbacks and bounces along the way. A higher high this week adds some confidence to this trend.
The measuring gap gives a short term target at 2,838. The gap has offered support. It remains open, and the target remains valid.
There is room still for price to continue higher: On Balance Volume remains extremely bullish, and RSI is not yet overbought. When On Balance Volume makes new all time highs before price, expect it is very likely that price shall follow through.
Stochastics may remain overbought for long periods of time when this market has a strong bullish trend. Only when it reaches overbought and then exhibits clear divergence with price, then it may be useful as an indicator of a possible high in place. That is not the case yet.
The last two short range red daily candlesticks look unconvincing as the start of a new downwards trend. It looks like price has seen a small consolidation with good support about 2,800.
VOLATILITY – INVERTED VIX CHART
WEEKLY CHART
Click chart to enlarge. Chart courtesy of StockCharts.com. So that colour blind members are included, bearish signals
will be noted with blue and bullish signals with yellow.
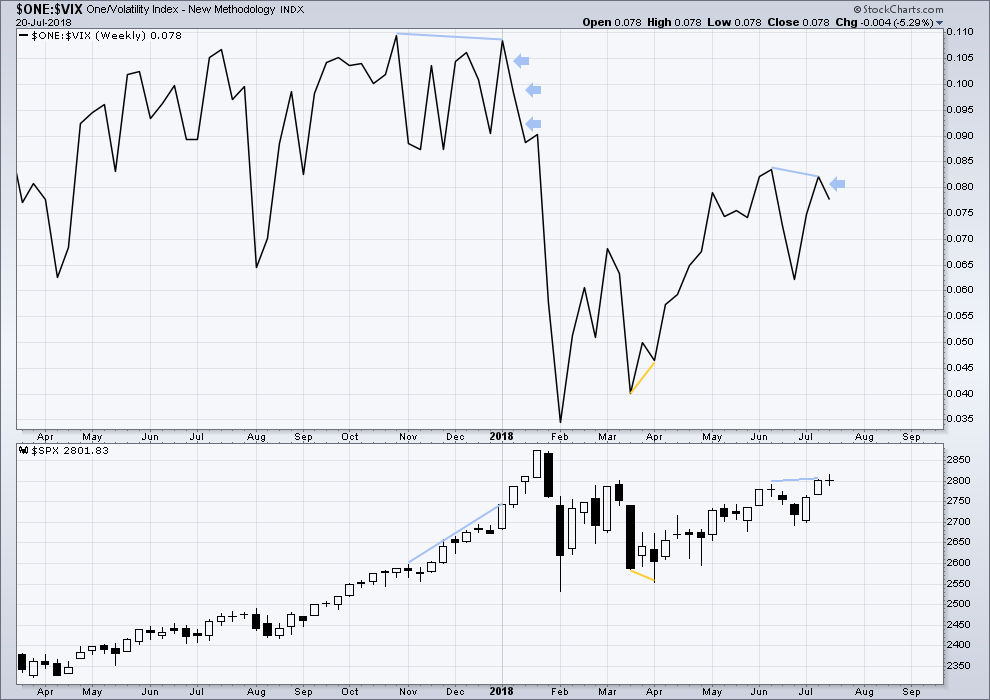
To keep an eye on the all time high for inverted VIX a weekly chart is required at this time.
Notice how inverted VIX has very strong bearish signals four weeks in a row just before the start of the last large fall in price. At the weekly chart level, this indicator may be useful again in warning of the end of primary wave 3.
Price moved higher this week, but inverted VIX moved lower. This divergence is bearish. A single week of this bearish divergence is not a very loud warning though.
DAILY CHART
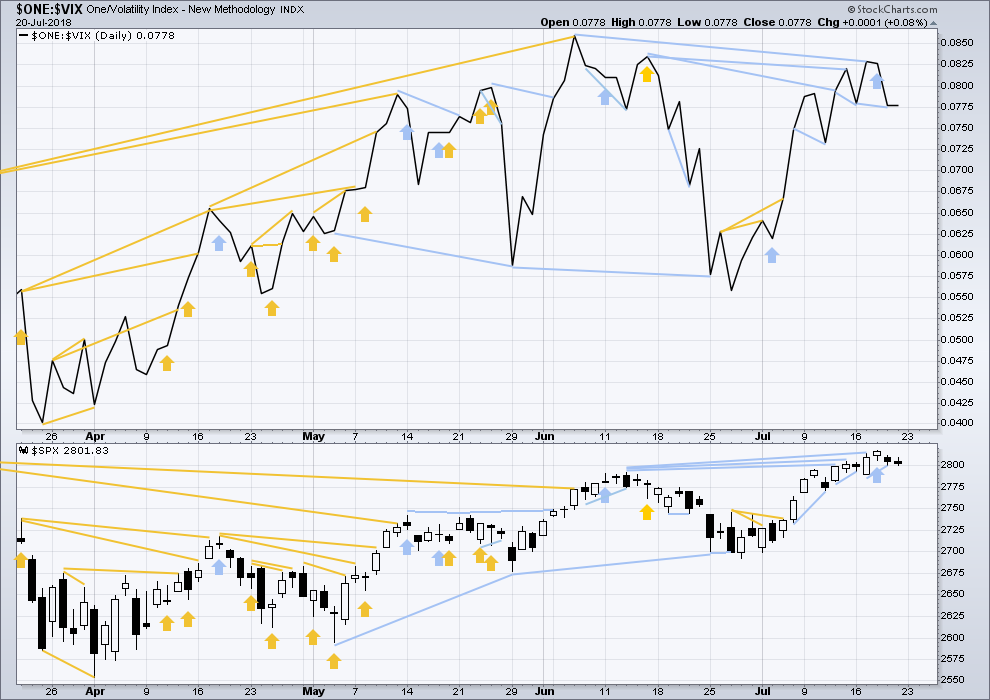
Click chart to enlarge. Chart courtesy of StockCharts.com. So that colour blind members are included, bearish signals
will be noted with blue and bullish signals with yellow.
Normally, volatility should decline as price moves higher and increase as price moves lower. This means that normally inverted VIX should move in the same direction as price.
Short term bearish divergence noted in analysis this week may now be resolved by two red daily candlesticks. There is no new short term divergence for Friday’s session.
BREADTH – AD LINE
WEEKLY CHART
Click chart to enlarge. Chart courtesy of StockCharts.com.
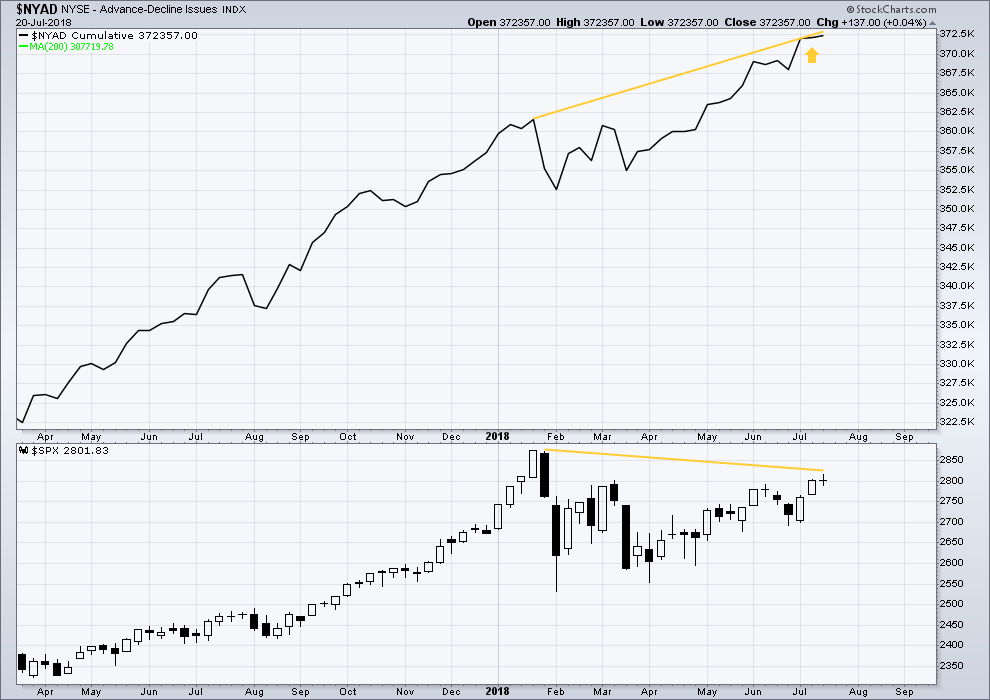
When primary wave 3 comes to an end, it may be valuable to watch the AD line at the weekly time frame as well as the daily.
At this stage, there is very strong bullish divergence between price and the AD line at the weekly time frame. With the AD line making new all time highs, expect price to follow through with new all time highs in coming weeks.
Yet another new all time high this week from the AD line is again extremely bullish.
DAILY CHART
Click chart to enlarge. Chart courtesy of StockCharts.com.
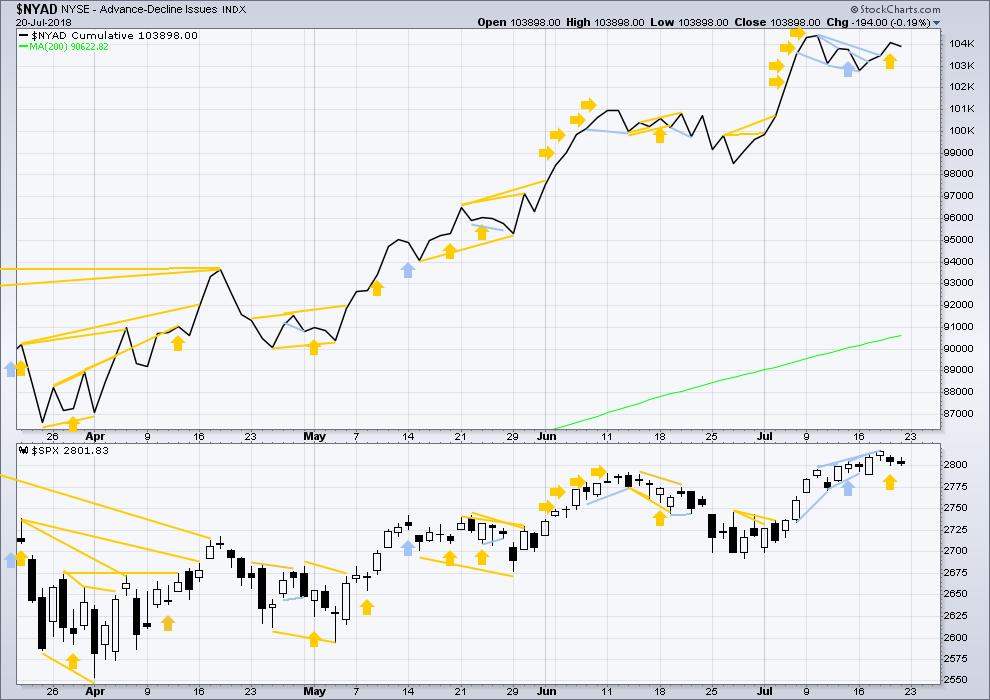
There is normally 4-6 months divergence between price and market breadth prior to a full fledged bear market. This has been so for all major bear markets within the last 90 odd years. With no longer term divergence yet at this point, any decline in price should be expected to be a pullback within an ongoing bull market and not necessarily the start of a bear market. New all time highs from the AD line means that any bear market may now be an absolute minimum of 4 months away. It may of course be a lot longer than that. My next expectation for the end of this bull market may now be October 2019.
Breadth should be read as a leading indicator.
Overall, recent new all time highs from the AD line remain extremely bullish for the longer term trend.
Price may reasonably be expected to follow through in coming weeks.
Two red daily candlesticks may now have resolved the last noted short term bearish divergence. The most recent divergence is bullish from Thursday; it may yet be followed by more upwards movement.
Small caps have made another new all time high this week. Mid caps made a new all time high last week. Only large caps have to follow through; they do usually lag in the latter stages of a bull market.
DOW THEORY
The following lows need to be exceeded for Dow Theory to confirm the end of the bull market and a change to a bear market:
DJIA: 23,360.29.
DJT: 9,806.79.
S&P500: 2,532.69.
Nasdaq: 6,630.67.
Only Nasdaq at this stage is making new all time highs, with another new all time high on Friday. DJIA and DJT need to make new all time highs for the ongoing bull market to be confirmed.
GOLD
Technical analysis at the end of this week focuses on candlestick patterns along with a very few key indicators. A strong pattern at the end of the week suggests the direction for next week for Gold.
Summary: It looks very likely that a low is in place for Gold for the short to mid term. A bounce up now to about 1,307 is expected to last a few weeks, possibly as long as 21 weeks. It is expected to have a consolidation within it.
Always trade with stops to protect your account. Risk only 1-5% of equity on any one trade.
Grand SuperCycle analysis is here.
Last historic analysis with monthly charts and several weekly alternates is here, video is here.
There are six weekly charts published in the last historic analysis. All but two expect more downwards movement at this time; the two bullish wave counts have been invalidated below 1,236.54. The remaining four bearish wave counts are updated in this analysis.
MAIN ELLIOTT WAVE COUNT
WEEKLY CHART – TRIANGLE
Click chart to enlarge.
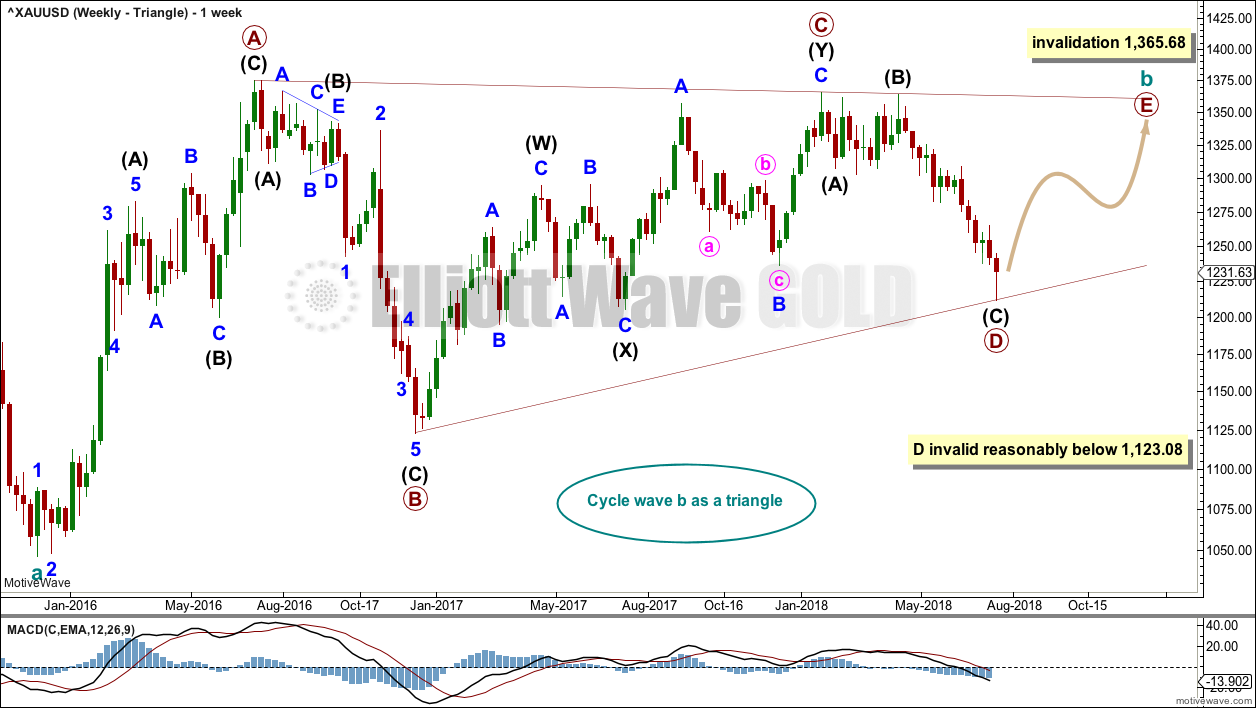
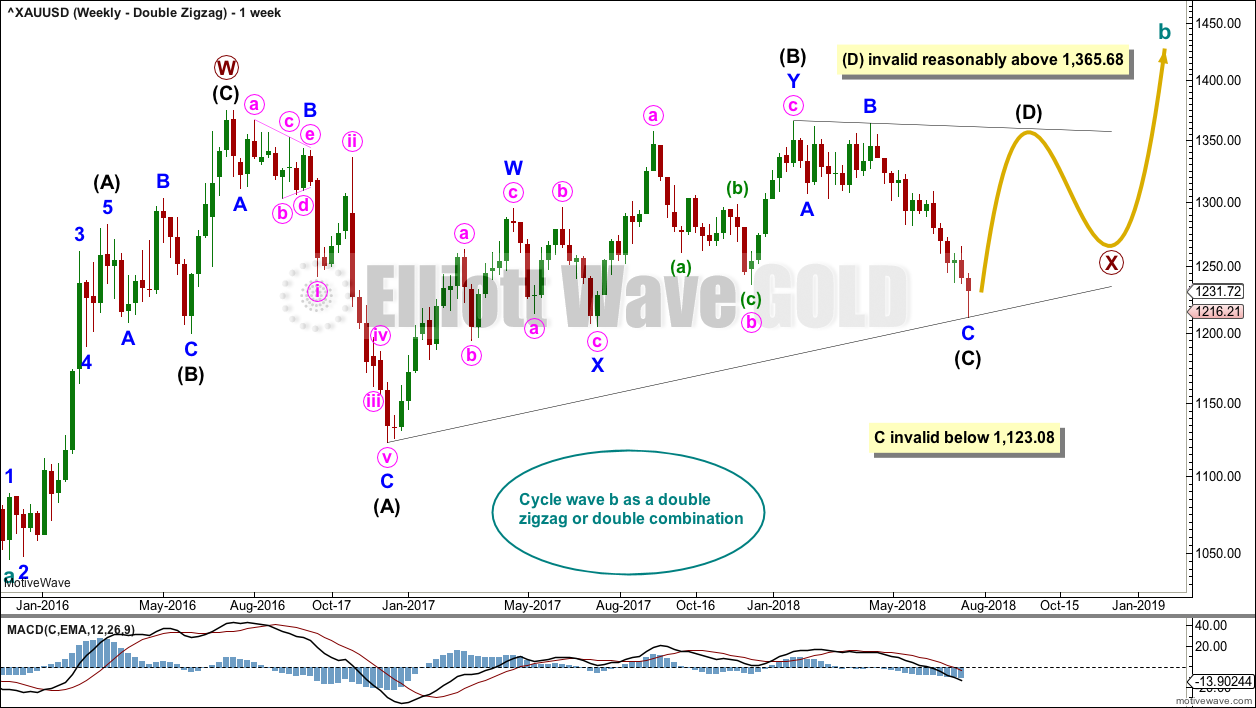
The triangle so far has the best fit and look.
Cycle wave b may be an incomplete triangle. The triangle may be a contracting or barrier triangle, with a contracting triangle looking much more likely because the A-C trend line does not have a strong slope. A contracting triangle could see the B-D trend line have a stronger slope, so that the triangle trend lines converge at a reasonable rate. A barrier triangle would have a B-D trend line that would be essentially flat, and the triangle trend lines would barely converge.
Within a contracting triangle, primary wave D may not move beyond the end of primary wave B below 1,123.08. Within a barrier triangle, primary wave D may end about the same level as primary wave B at 1,123.08, so that the B-D trend line is essentially flat. Only a new low reasonably below 1,123.08 would invalidate the triangle.
Within both a contracting and barrier triangle, primary wave E may not move beyond the end of primary wave C above 1,365.68.
Four of the five sub-waves of a triangle must be zigzags, with only one sub-wave allowed to be a multiple zigzag. Primary wave C is the most common sub-wave to subdivide as a multiple, and this is how primary wave C for this example fits best.
Primary wave D must be a single structure, most likely a zigzag. It is possible that primary wave D could be over.
One triangle sub-wave tends to be close to 0.618 the length of its predecessor; if primary wave D is over at this weeks low, it is just 3.64 below this point.
There are no problems in terms of subdivisions or rare structures for this wave count. It has an excellent fit and so far a typical look.
DAILY CHART – TRIANGLE
Click chart to enlarge.
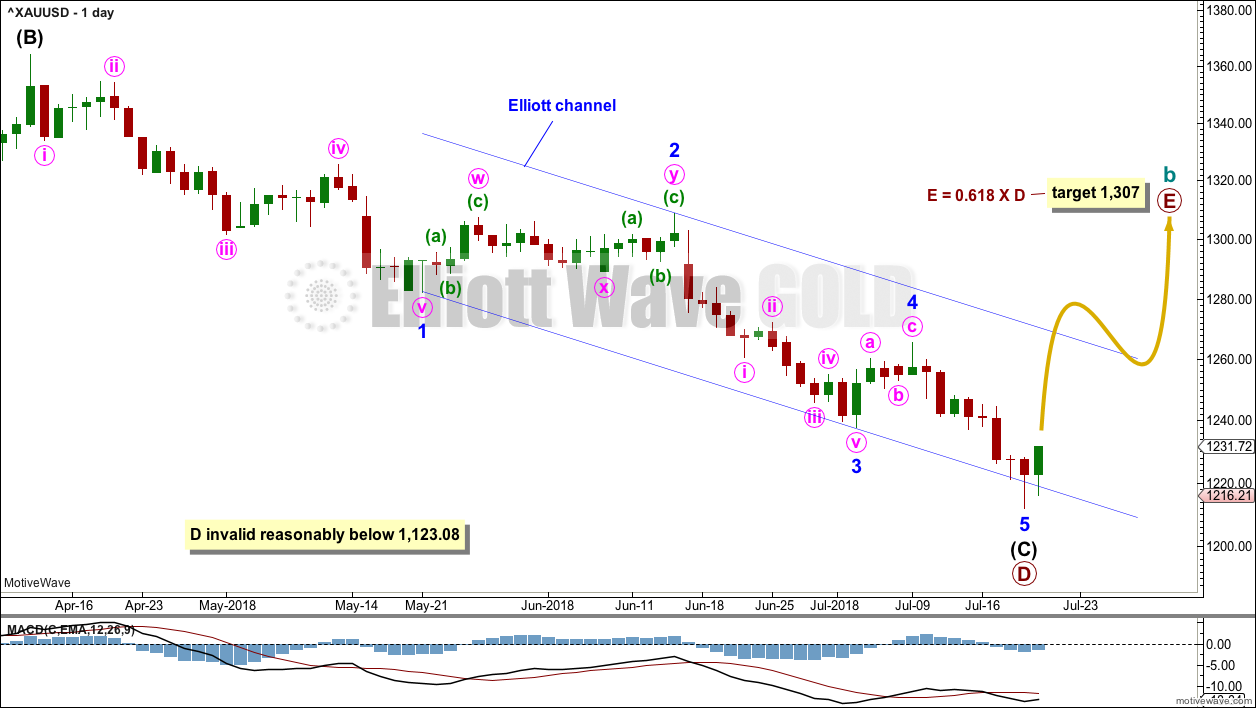
It is possible at the end of this week that primary wave D is over. The structure may be seen complete and technical analysis indicates a low may now be in place.
It is also possible that minor wave 5 could continue lower next week.
At this stage, the best target calculation for primary wave E would be 0.618 the length of primary wave D. This yields a target that is within a very strong area of resistance.
When intermediate waves (A) and (B) within primary wave E may be complete, then the ratio between intermediate waves (A) and (C) may be used to add to the target calculation at a second degree. At that stage, it may change or widen to a zone.
Primary wave E would be most likely to fall reasonably short of the A-C trend line.
In the first instance, primary wave E may be expected to last about a Fibonacci 21 weeks.
WEEKLY CHART – FLAT
Click chart to enlarge.
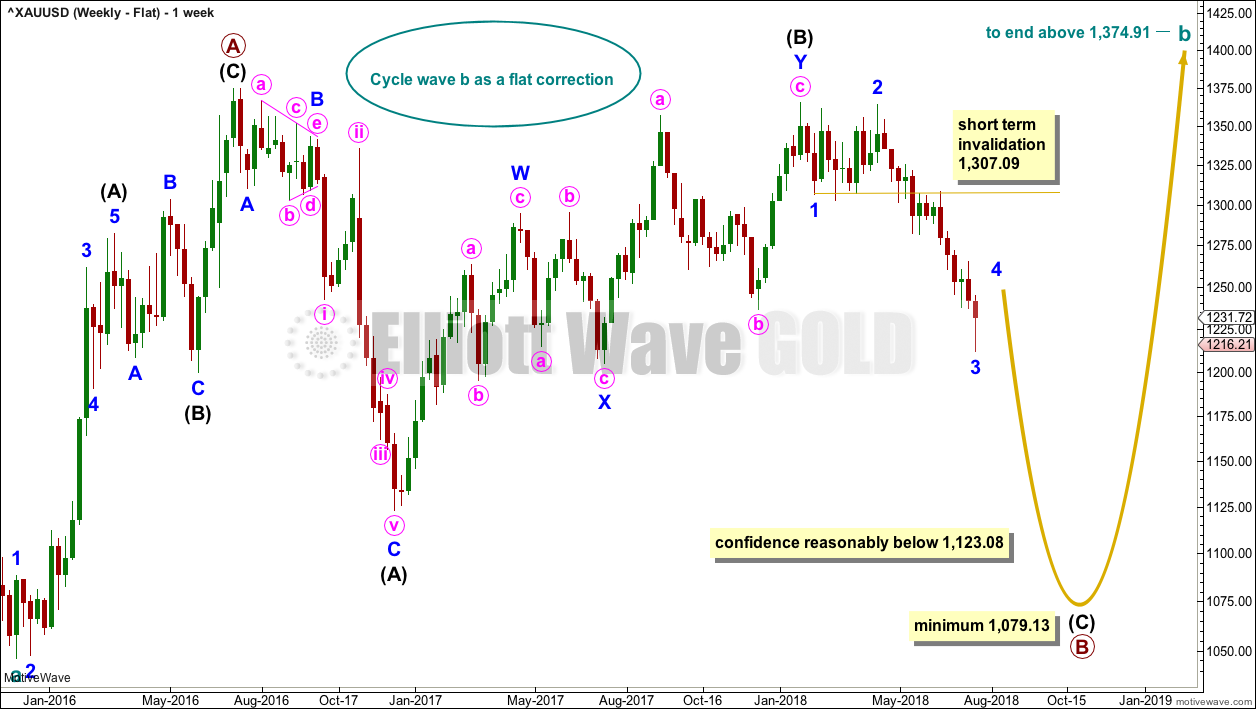
It is possible that cycle wave b may be a flat correction. Within a flat correction, primary wave B must retrace a minimum 0.9 length of primary wave A at 1,079.13 or below. Primary wave B may make a new low below the start of primary wave A at 1,046.27 as in an expanded flat correction.
Only a new low reasonably below 1,123.08 would provide reasonable confidence in this wave count.
Intermediate wave (C) must subdivide as a five wave structure; it may be unfolding as an impulse. Within the impulse, minor waves 1, 2 and now 3 may be complete and minor wave 4 may not move into minor wave 1 price territory above 1,307.09.
Minor wave 2 was a double zigzag lasting nine weeks. To exhibit alternation and reasonable proportion minor wave 4 may be a flat, combination or triangle and may last a little longer than nine weeks as these types of corrections tend to be longer lasting than zigzags or zigzag multiples.
WEEKLY CHART – COMBINATION
Click chart to enlarge.
It is essential when a triangle is considered to always consider alternates. Too many times over the years I have labelled a triangle as unfolding or even complete, only for it to be invalidated and the structure turning out to be something else.
When a triangle is invalidated, then the most common structure the correction turns out to be is a combination.
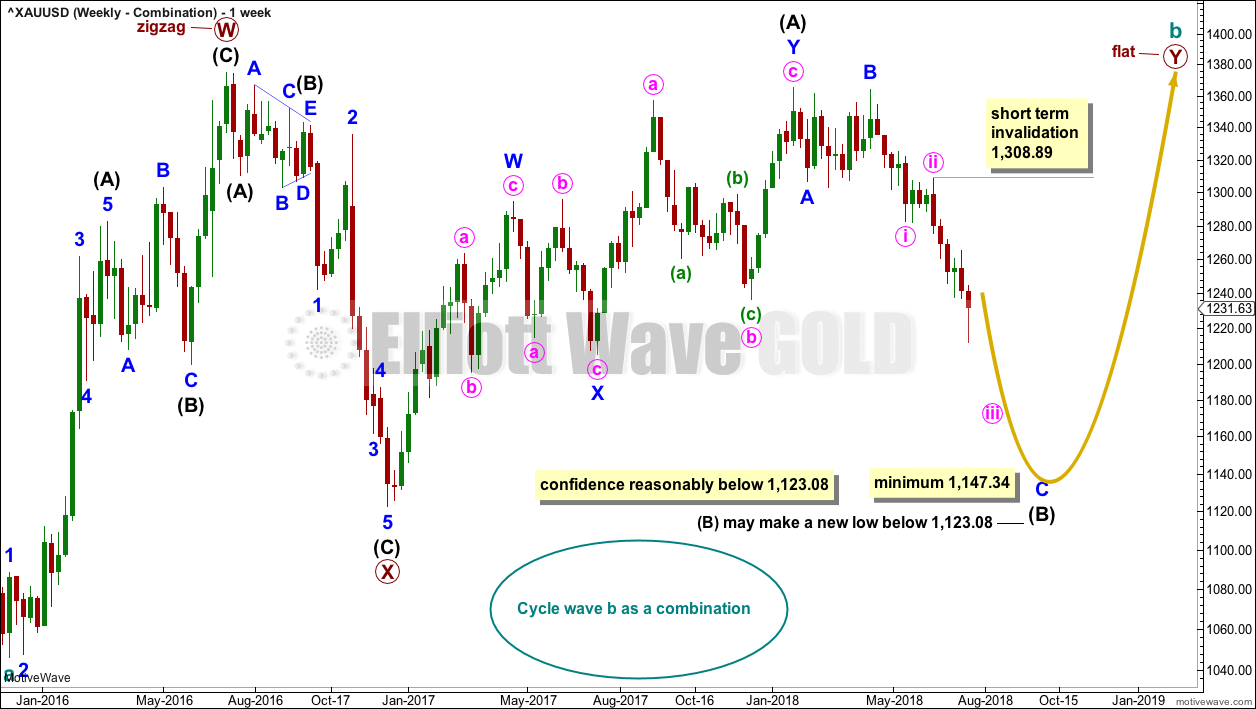
If cycle wave b is a combination, then the first structure in a double may be a complete zigzag labelled primary wave W.
The double may be joined by a three in the opposite direction, a zigzag labelled primary wave X.
The second structure in the double may be a flat correction labelled primary wave Y. It may also be a triangle, but that would expect essentially the same movement as the weekly triangle chart and so shall not yet be considered while there is no divergence in the expected pathway for price.
Within a flat correction for primary wave Y, the current downwards wave of intermediate wave (B) may be a single or multiple zigzag; for now it shall be labelled as a single. Intermediate wave (B) must retrace a minimum 0.9 length of intermediate wave (A) at 1,147.34. Intermediate wave (B) may move beyond the start of intermediate wave (A) as in an expanded flat.
Within the zigzag of intermediate wave (B), minor waves A and B may be complete. Minor wave C must subdivide as a five wave structure; at this stage, it may be an incomplete impulse. Within minor wave C, minute waves i and ii may be complete. Within minute wave iii, no second wave correction may move beyond the start of its first wave above 1,308.89.
This wave count is the most immediately bearish of the four remaining weekly wave counts.
When intermediate wave (B) is complete, then intermediate wave (C) would be expected to make at least a slight new high above the end of intermediate wave (A) at 1,365.68 to avoid a truncation. Primary wave Y would be most likely to end about the same level as primary wave W at 1,374.91, so that the whole structure takes up time and moves price sideways, as that is the purpose of double combinations.
While double combinations are very common, triples are extremely rare. When the second structure in a double is complete, then it is extremely likely that the whole correction is over.
WEEKLY CHART – DOUBLE ZIGZAG
Click chart to enlarge.
Finally, it is also possible that cycle wave b may be a double zigzag or a double combination.
The first zigzag in the double is labelled primary wave W. This has a good fit.
The double may be joined by a corrective structure in the opposite direction, a triangle labelled primary wave X. The triangle would be only a little over halfway through.
Within the triangle of primary wave X, intermediate wave (C) may now be complete. If it continues any lower, then it may not move beyond the end of intermediate wave (A) below 1,123.08.
This wave count may now expect choppy overlapping movement in an ever decreasing range for several more months. After the triangle is complete, then an upwards breakout would be expected from it.
Primary wave Y would most likely be a zigzag because primary wave X would be shallow; double zigzags normally have relatively shallow X waves.
Primary wave Y may also be a flat correction if cycle wave b is a double combination, but combinations normally have deep X waves. This would be less likely.
This wave count has good proportions and no problems in terms of subdivisions.
TECHNICAL ANALYSIS
WEEKLY CHART
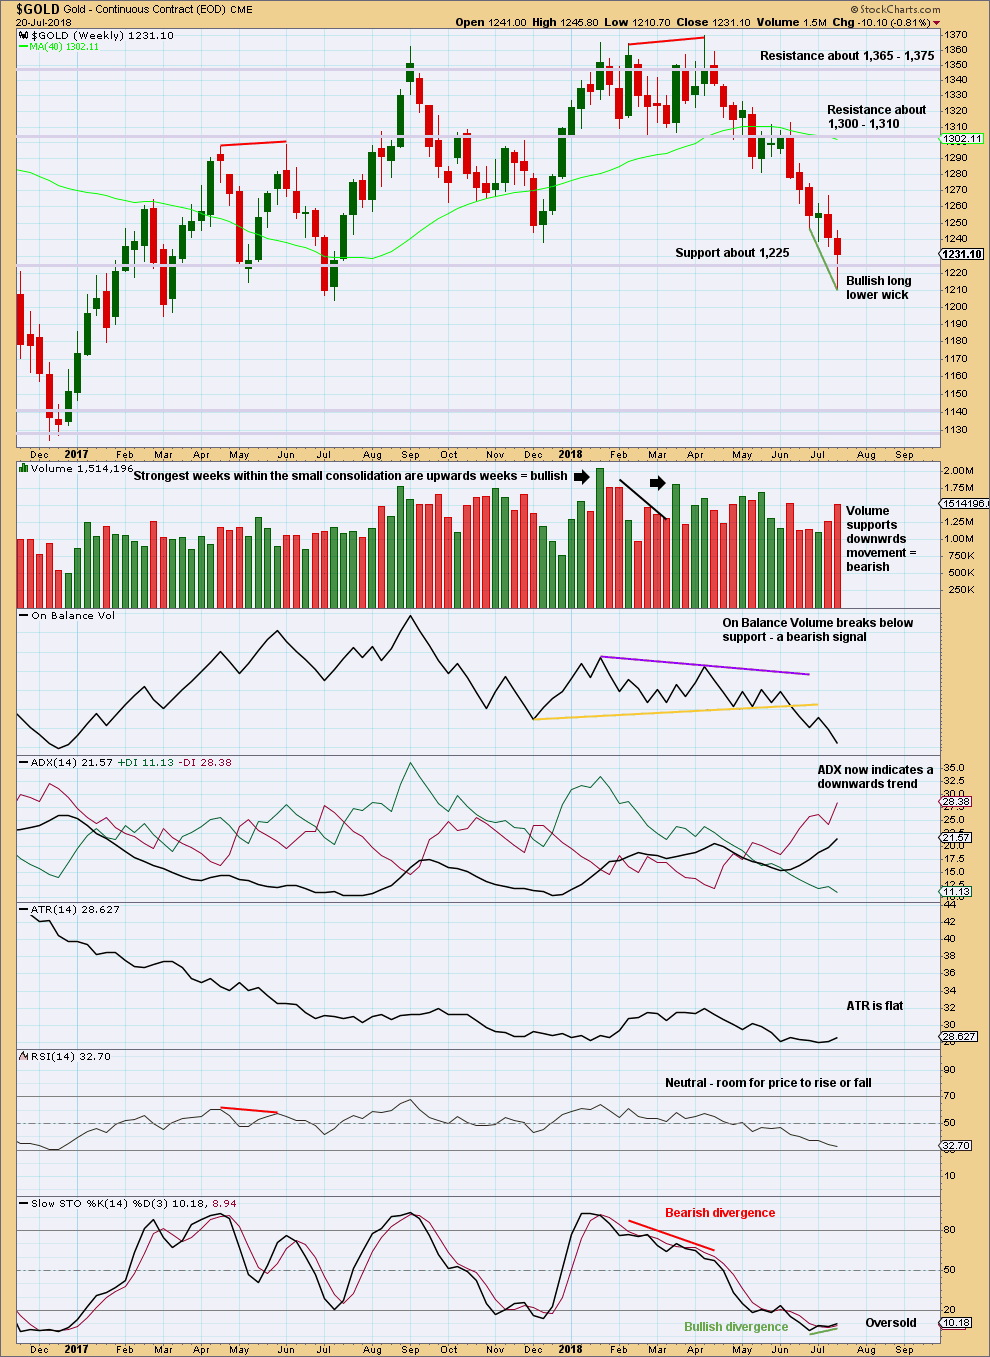
Click chart to enlarge. Chart courtesy of StockCharts.com.
The reasonably long lower wick on this weekly candlestick is given weight in this analysis.
DAILY CHART
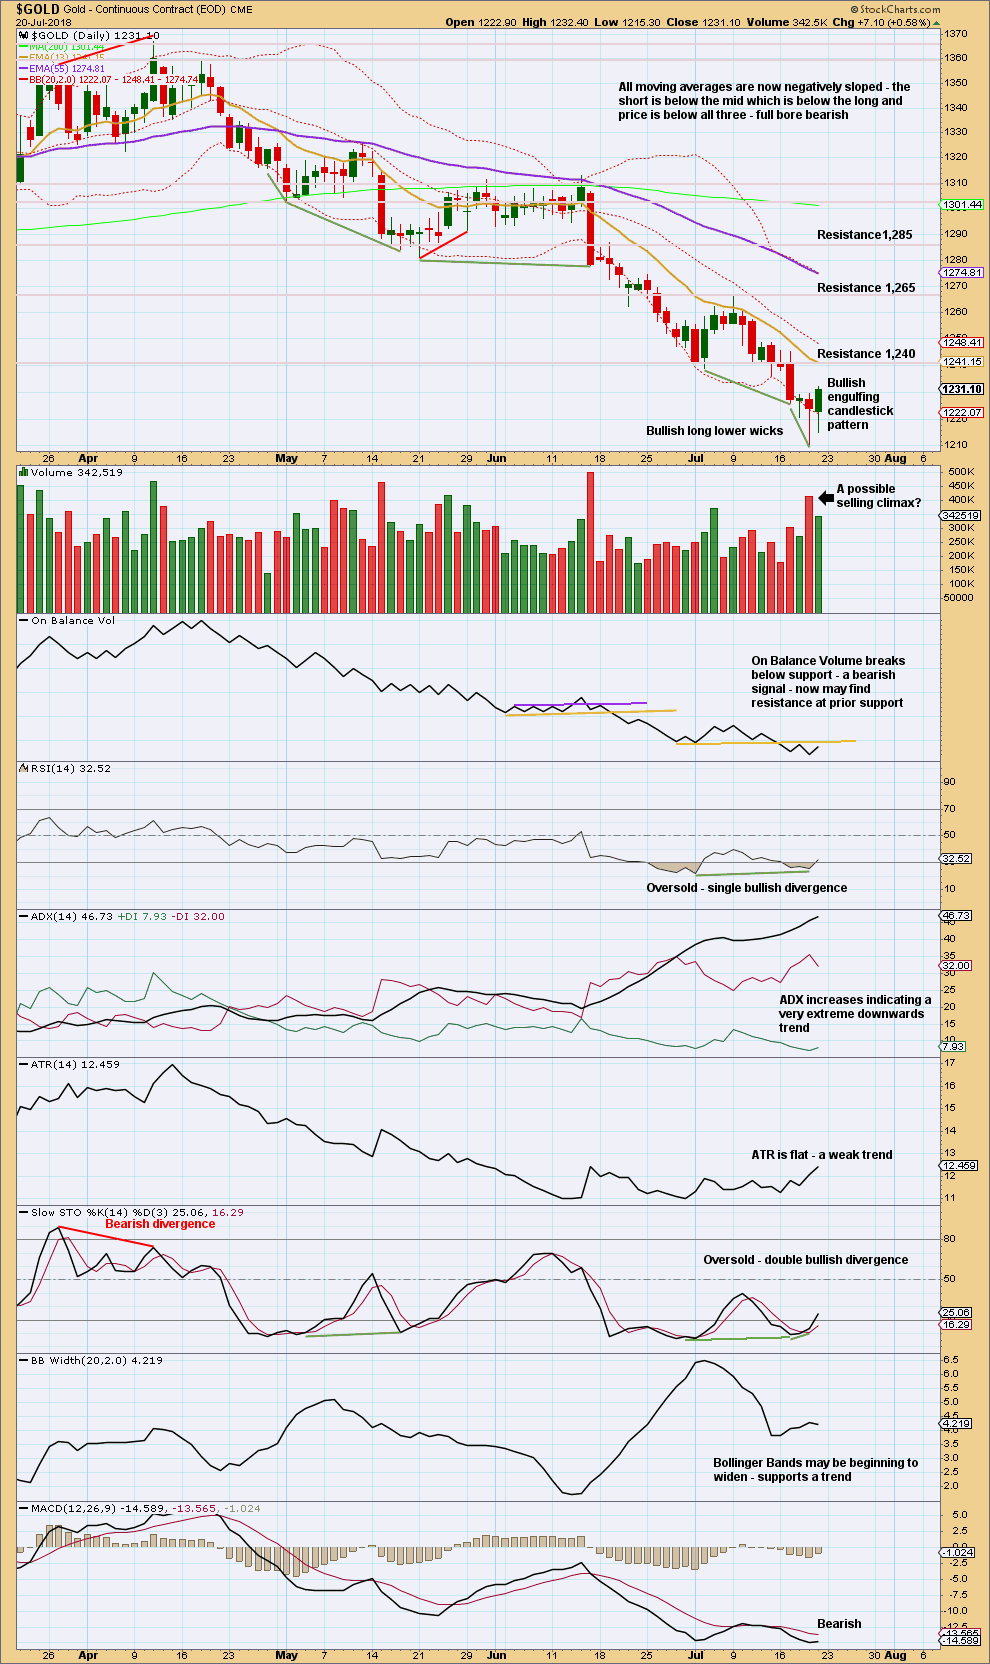
Click chart to enlarge. Chart courtesy of StockCharts.com.
There is now a small cluster of three long lower daily candlestick wicks. In conjunction with a Bullish Engulfing candlestick pattern, single bullish divergence between price and RSI while RSI is oversold, and now double bullish divergence between price and Stochastics while Stochastics is oversold, it looks increasingly like a low may now be in place for the short to mid term at least.
ADX does indicate this downwards trend is very extreme, so looking at other indicators for a cluster of signals is the approach I will take this week.
GDX WEEKLY CHART
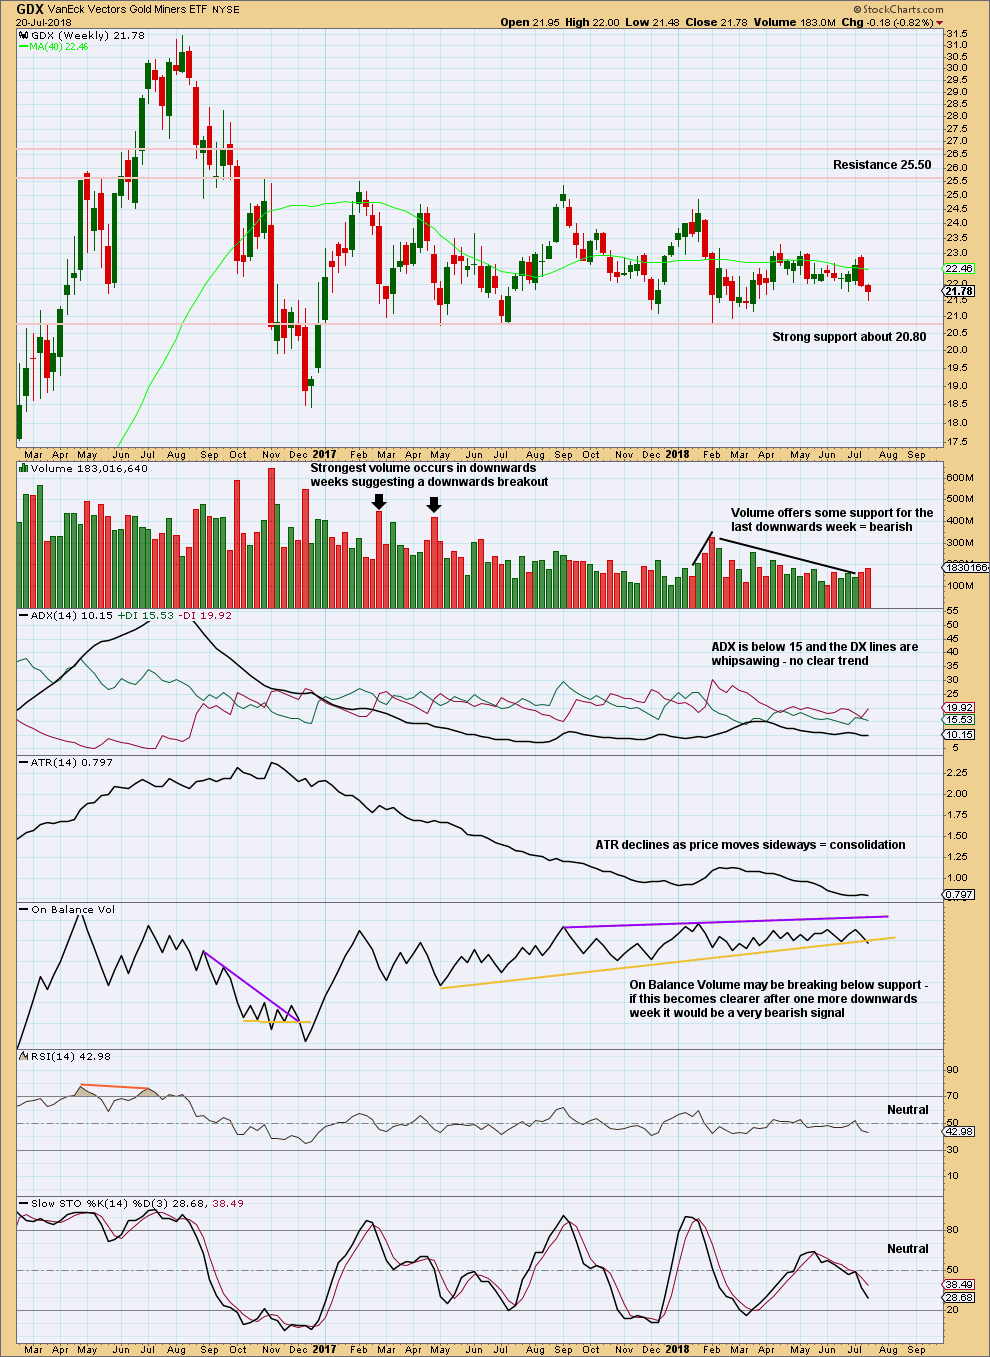
Click chart to enlarge. Chart courtesy of StockCharts.com.
GDX has been range bounce since January 2017. This is a very long sideways consolidation. The longer it continues, the more sustained the eventual breakout will be. Volume suggests the breakout may more likely be downwards.
Support about 20.80 has been tested about eight times and so far has held. The more often a support area is tested and holds, the more technical significance it has.
In the first instance, expect this area to continue to provide support. Only a strong downwards day, closing below support and preferably with some increase in volume, would constitute a downwards breakout from the consolidation.
Resistance is about 25.50. Only a strong upwards day, closing above resistance and with support from volume, would constitute an upwards breakout.
There is again some support this week for downwards movement from volume.
GDX DAILY CHART
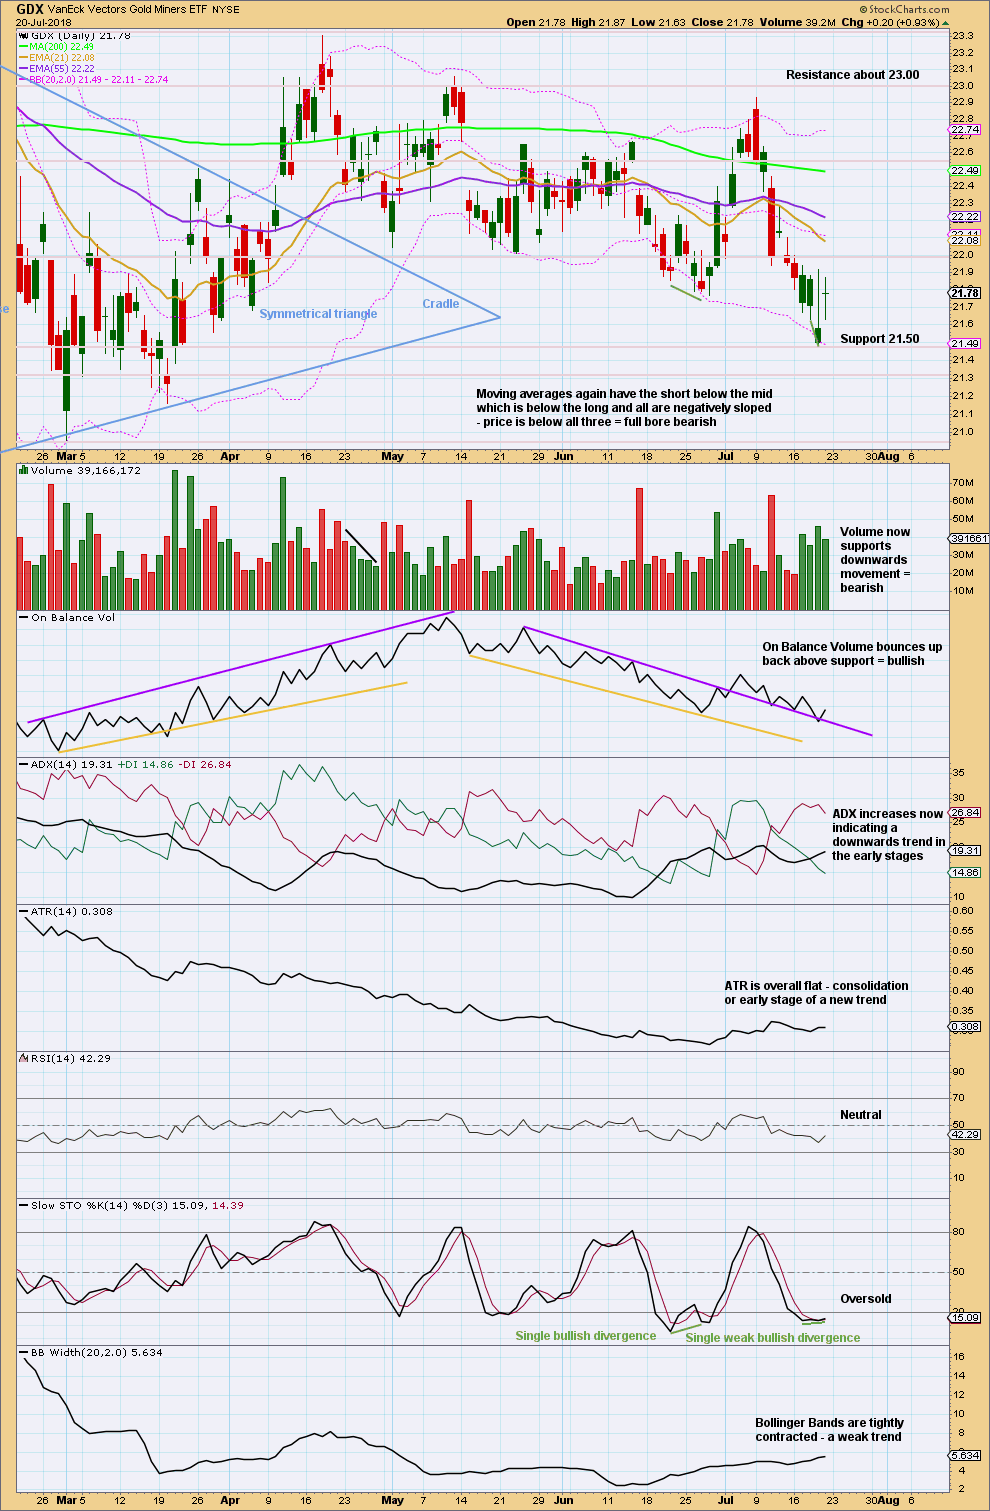
Click chart to enlarge. Chart courtesy of StockCharts.com.
While Gold now looks reasonably bullish for at least the short term, GDX does not. GDX looks reasonably bearish. If price can break below support at 21.50, then next support is about 21.30.
US OIL
Again, downwards movement was expected for the week, which is what has happened.
Summary: This downwards swing may now continue to about 61.22. For the very short term, look out for a bounce to end about 72.12.
A deeper and longer lasting consolidation may be underway, which may last about 13 to 21 weeks in total. It should remain above 55.24, and the target is about 61.12. The consolidation will not move in a straight line; it may swing from resistance to support and back again in large swings. Once resistance and support are identified, then a swing trading system may be employed by more experienced traders. Support may now be about 63.0 and resistance may be about 75.25.
Always practice good risk management as the most important aspect of trading. Always trade with stops and invest only 1-5% of equity on any one trade. Failure to manage risk is the most common mistake new traders make.
MAIN WAVE COUNT
MONTHLY CHART
Click chart to enlarge.
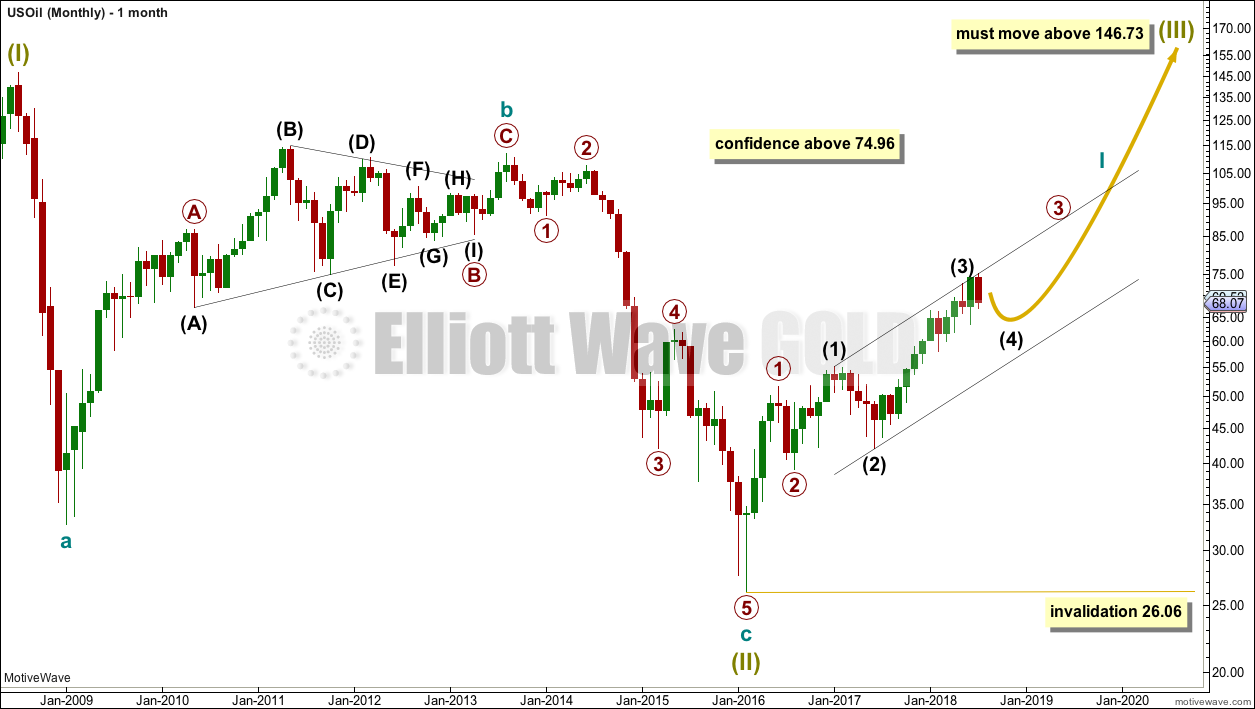
The bear market for US Oil looks to be over and a new bull market looks to be in its very early stages. The prior bearish wave count has been invalidated, leaving only this very bullish wave count.
A huge zigzag down to the last low may be complete and is labelled here Super Cycle wave (II).
Cycle wave b must be seen as complete in August 2013 for this wave count to work. It cannot be seen as complete at the prior major swing high in May 2011.
Cycle wave b is seen as a zigzag, and within it primary wave B is seen as a running contracting triangle. These are fairly common structures, although nine wave triangles are uncommon. All subdivisions fit.
Primary wave C moves beyond the end of primary wave A, so it avoids a truncation. But it does not have to move above the price territory of primary wave B to avoid a truncation, which is an important distinction.
If cycle wave b begins there, then cycle wave c may be seen as a complete five wave impulse.
Super Cycle wave (III) must move beyond the end of Super Cycle wave (I). It must move far enough above that point to allow room for a subsequent Super Cycle wave (IV) to unfold and remain above Super Cycle wave (I) price territory.
Cycle wave I may be incomplete. It may be unfolding as an impulse and may have now moved through the middle portion. Commodities have a tendency to exhibit swift strong fifth waves, and this tendency is especially prevalent for third wave impulses. Intermediate wave (5) to end primary wave 3 may be very swift and strong, ending with a blow off top.
When cycle wave I is complete, then cycle wave II may be a deep correction that may not move beyond the start of cycle wave I below 26.06.
Data from FXCM for USOil does not go back to the beginning of Super Cycle wave (I). Without an accurate known length of Super Cycle wave (I) a target cannot be calculated for Super Cycle wave (III) to end using Fibonacci ratios. The target for Super Cycle wave (III) may be calculated when cycle waves I, II, III and IV within it are complete. That cannot be done for many years.
WEEKLY CHART
Click chart to enlarge.
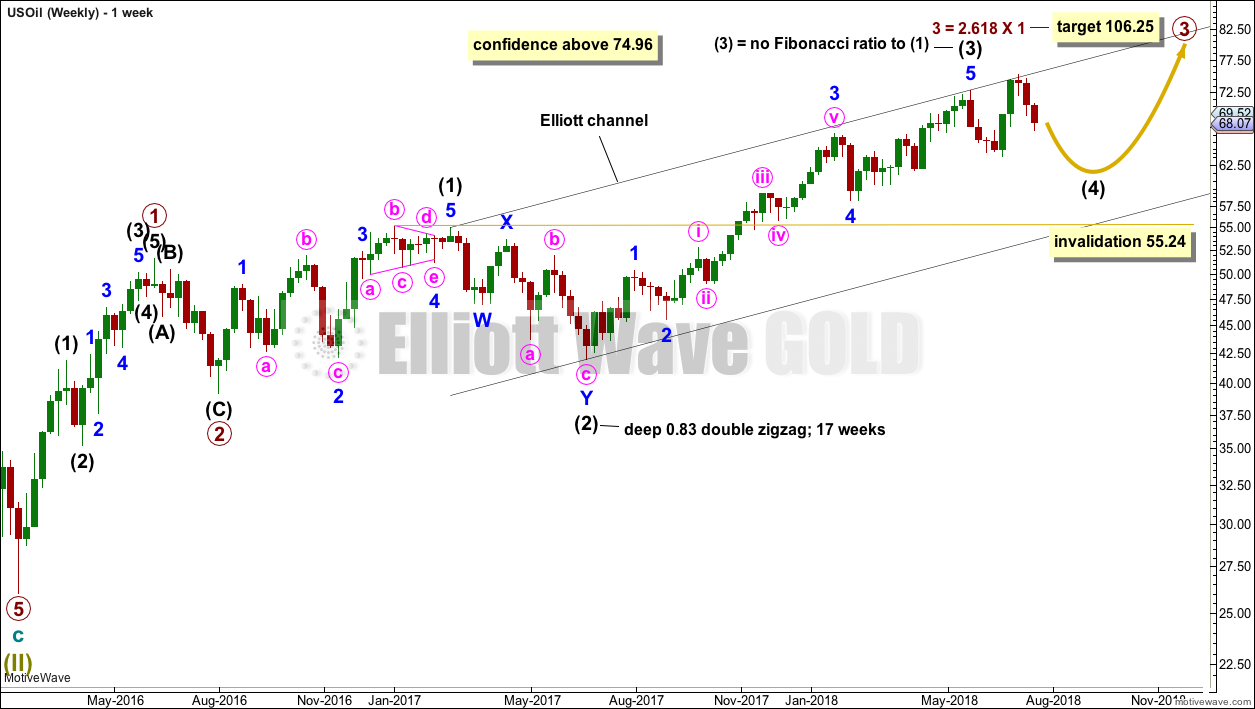
Intermediate wave (3) may now be complete. There is no Fibonacci ratio between intermediate waves (1) and (3), and intermediate wave (3) is longer than 1.618 the length of intermediate wave (1).
This wave count fits with classic technical analysis at the monthly and daily chart levels.
Intermediate wave (2) was a deep double zigzag. Given the guideline of alternation, intermediate wave (4) may be expected to most likely be a shallow flat, triangle or combination. It may be about even in duration with intermediate wave (2), or it may be a little longer because triangles and combinations are more time consuming structures.
In the first instance, a Fibonacci 13 weeks may be expected for intermediate wave (4). If about that time the structure is incomplete, then the next Fibonacci number in the sequence at 21 will be expected. At this stage, it has lasted only 8 weeks.
Intermediate wave (4) may find support about the lower edge of the black Elliott channel. It may end within the price territory of the fourth wave of one lesser degree; minor wave 4 has its territory from 66.65 to 59.13.
DAILY CHART
Click chart to enlarge.
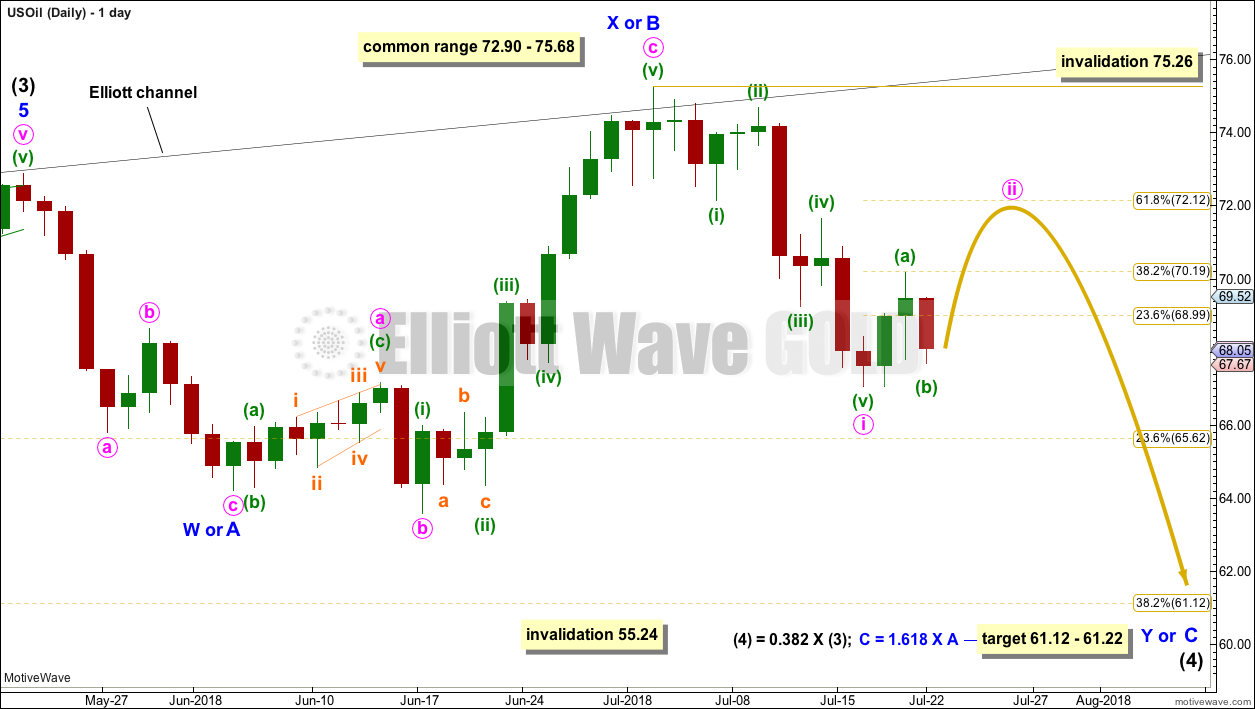
Intermediate wave (4) may still be unfolding as any one of a flat, combination or triangle. This chart will encompass all three ideas. When the three ideas begin to diverge in the next week or so, then they may be published as separate charts.
If intermediate wave (4) is unfolding as a flat correction, then within it minor wave A was a completed zigzag and minor wave B was a completed expanded flat correction and a 1.27 length to minor wave A, which is within the most common range of 1 to 1.38. Minor wave C may now most likely reach about 1.618 the length of minor wave A. Minor wave C would be extremely likely to make at least a slight new low below the end of minor wave A at 64.22 to avoid a truncation and a very rare running flat.
If intermediate wave (4) is unfolding as a triangle, then within it minor wave A is a completed zigzag and minor wave B is a completed expanded flat correction. Four of the five sub-waves of a triangle must be single or multiple zigzags, leaving one triangle sub-wave which may be a flat correction. Only one triangle sub-wave may be a multiple zigzag, and minor wave C is the most likely triangle sub-wave to be a double zigzag. Minor wave C may not move beyond the end of minor wave A below 64.22 for a triangle.
If intermediate wave (4) is unfolding as a double combination, then minor wave W within it would be the first complete structure as a zigzag. Minor wave X may now be complete, joining the two structures within the double. Minor wave Y may be either a flat or triangle, and a flat is much more likely by a very wide margin. Minor wave Y may end about the same level as minor wave W at 64.22, so that the whole structure moves sideways.
The structures are incomplete for all three ides. More sideways movement would be expected, with final resistance about 75.25 and support about 63.50 or a bit below.
Intermediate wave (4) may not move into intermediate wave (1) price territory below 55.24.
ALTERNATE DAILY CHART
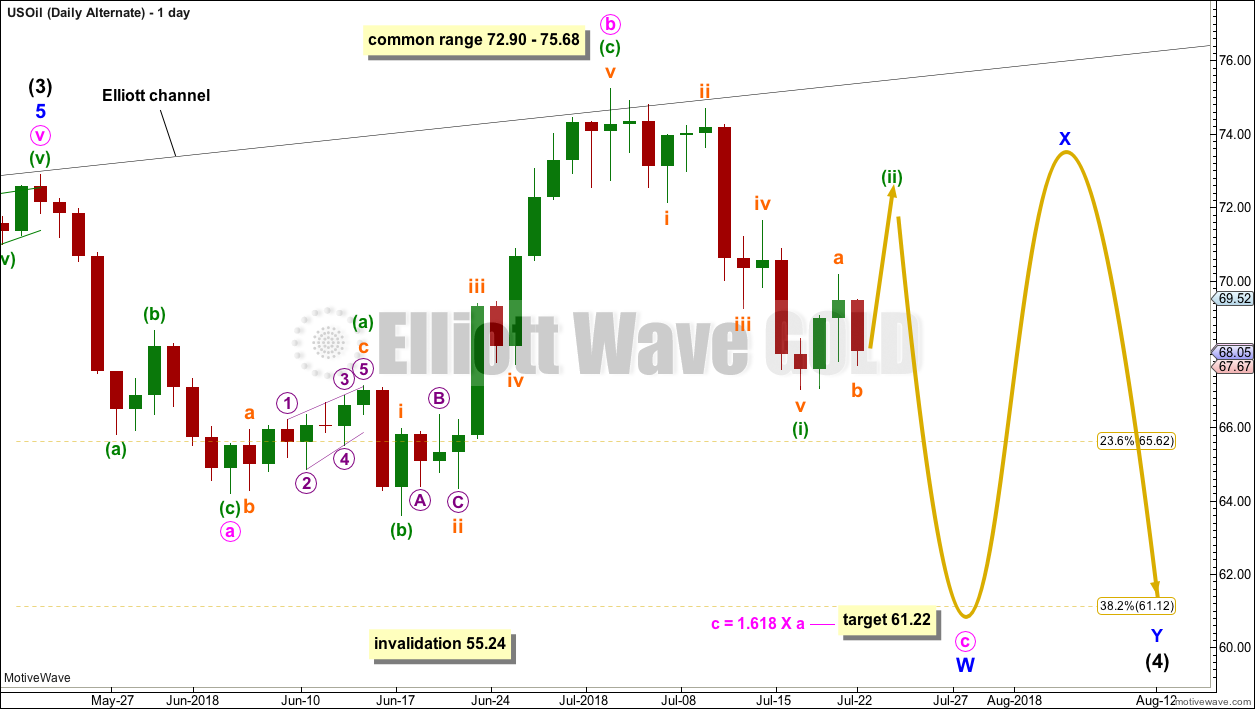
Click chart to enlarge.
This alternate wave count is identical to the first daily chart above except for the degree of labelling within intermediate wave (4) which is moved down one degree.
Intermediate wave (4) may be unfolding as a double combination, with the first structure in a double an incomplete expanded flat correction labelled minor wave W. Double combinations are very common structures.
The short term expectation for some downwards movement about here is exactly the same for both wave counts.
TECHNICAL ANALYSIS
MONTHLY CHART
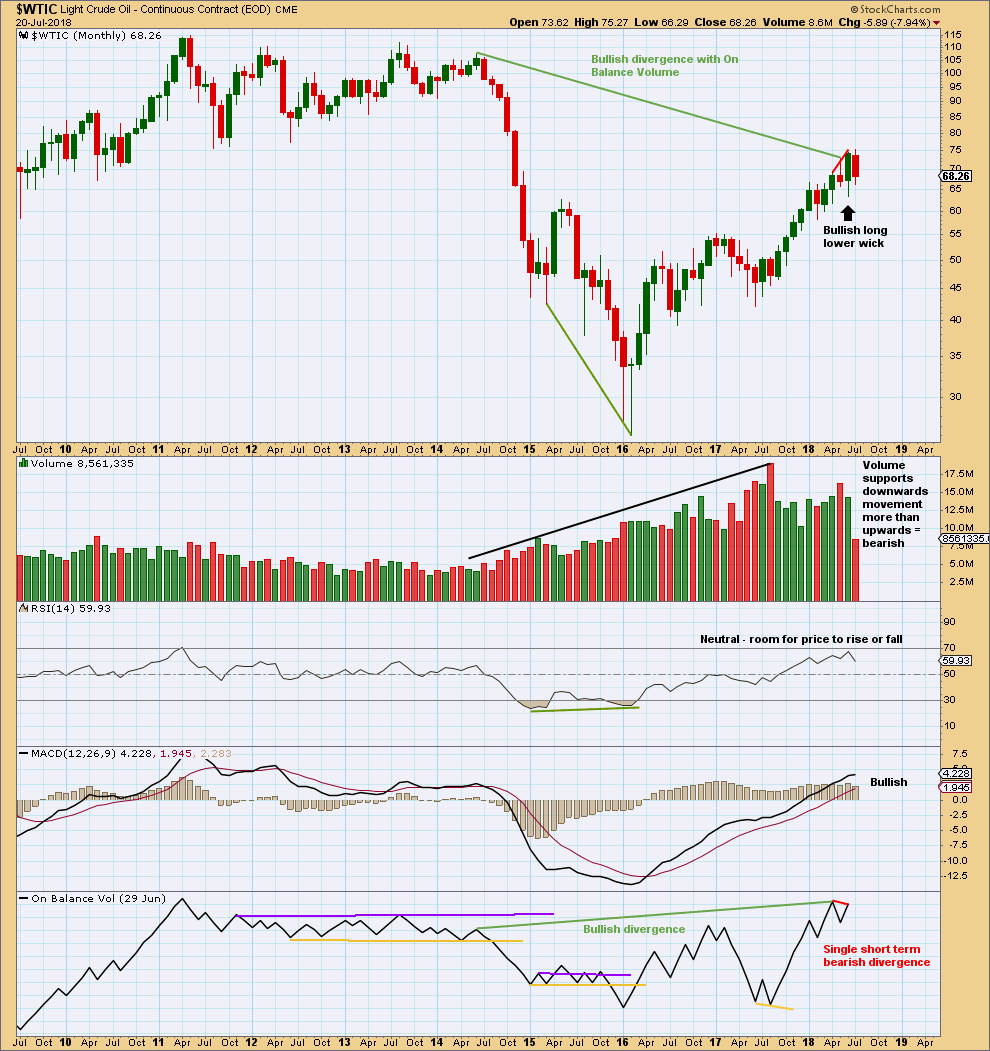
Click chart to enlarge. Chart courtesy of StockCharts.com.
The short term volume profile is bearish: the strongest month in the last few months was the downwards month of May (where the balance of volume was down) and now June shows a decline in volume, so volume has not supported upwards movement here.
For the short term, On Balance Volume is also slightly bearish. This supports the idea that price may be within a correction and not necessarily a continuation of the larger upwards trend.
However, it is entirely possible that this situation could reverse and volume could start to support upwards movement, as has happened back in January 2018.
The larger trend is upwards.
DAILY CHART
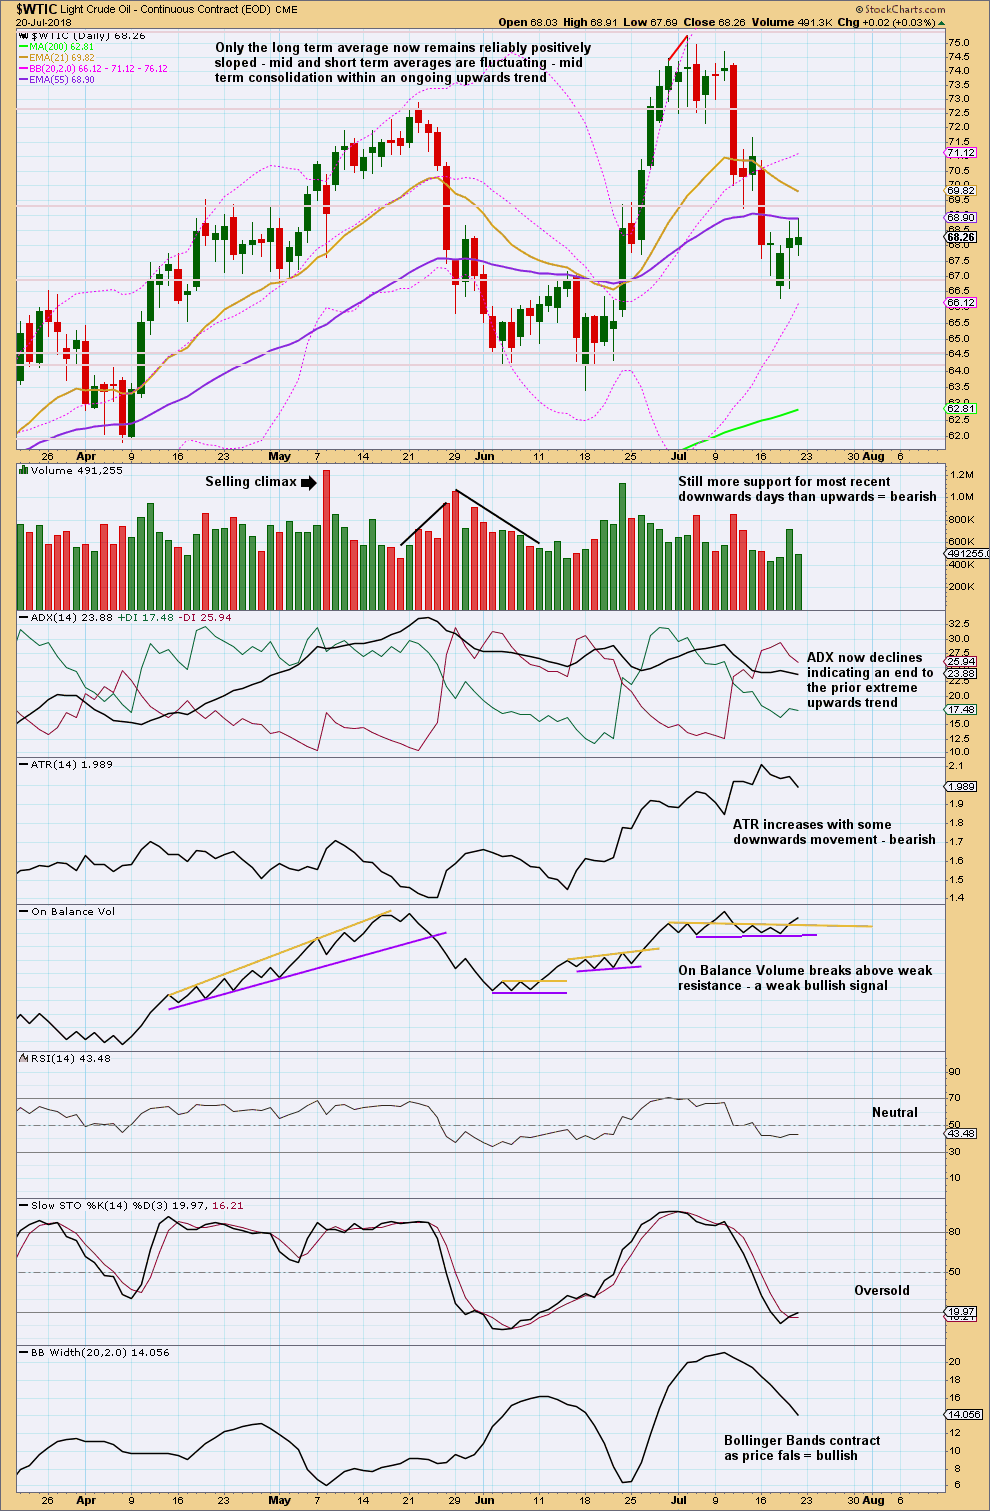
Click chart to enlarge. Chart courtesy of StockCharts.com.
ADX now indicates no clear trend; the market may be consolidating.
Expect swings from support to resistance and back again, using Stochastics to indicate when each swing may end.
Price has moved lower.
This looks like a downwards swing. There is some support here, at about 67.00. Look for a bounce here within the downwards swing. Thereafter, the swing may continue to the lower edge of support for this consolidation, which is about 64.00. If price gets down there and Stochastics is oversold and there exhibits bullish divergence with price, then look for the downwards swing to end an a new upwards swing to begin.
Your July 25th Q and A posting was very helpful. Thank you.
That’s great, I thought it might be helpful.
Hello Lara, you have very strong bullish long-term view for Oil&SP. Can it be possible to see longer bearish view for gold&silver at the same time??? The gap/negative correlation between oil and gold is quite big already ….My guess is the key for both is USD index. If it goes lower – the gold/silver hardly will go downwards on longer term basis…and oil too in this case… Can you show your USD index longer term view? Is it bearish or bullish?
There are a couple of assumptions in your question which I’ll address first.
1. That I don’t have a long term bearish view for Gold and Silver. My main wave counts for both these markets are in fact very bearish for the long term.
2. That there is a correlation between the USD index and Gold / Silver. Thankfully there is an easy way to accurately determine if that assumption is accurate using simple math.
The correlation coefficient between USD index and Gold fluctuates from above +0.5 to below -0.5. Any two sets of data which have a correlation coefficient that spends time in the shaded area between those two points are two sets of data which do not have a reliable correlation.
Furthermore, any two sets of data which have a correlation coefficient that can move from above +0.5 to below -0.5 are two sets of data which absolutely do not have a mathematically reliable correlation. Any correlation which may appear from time to time should be considered completely due to chance, and not due to any causal relationship between the two markets.
My USD index analysis was updated last on the 10th of June. Here is the link. The biggest picture is very bullish. You can find all analysis via the drop down box under “categories” on the RH side bar.
Thanks! Your correct in terms of correlation but still it is hard to imagine oil going that much up with your bullish wave count along with your strong USD bullish wave counts. Hope they will still remain inversely correlated on the longer time horizons. Can your EEM wave counts fortell the most probable direction of USD index? Anyway thanks very much Alex
A member emailed me with this question, and I think the question is a very good one so I’ll copy it and my answer here:
Q: “You are now analyzing SPX , Gold and Oil, which do you have most confidence in? Which market SPX, Gold, Oil are you most accurate / confident in ?”
A: “At this time I have by quite a wide margin most confidence in my S&P500 analysis. This is because both On Balance Volume and the AD line are making new all time highs at both daily and weekly time frames. This is extremely bullish.
My analysis for Gold I do not have nearly as much confidence in. That’s because I think it’s in a B wave, and they really are the absolute worst Elliott wave structures. They are analogous to choppy time consuming consolidations, and there is no technical analysis method that I am aware of which gives any kind of picture whatsoever on the pathway for price within consolidations. Swings from resistance to support and back again are normally very choppy and overlapping.
I am now reasonably confident in my US Oil analysis with invalidation of the bearish alternate. It now looks clear that this market is in a major new bull trend to last years. The problem for the short term though is I expect it is consolidating for a minor degree fourth wave. But I am aware that if I’m wrong we could see surprises to the upside for Oil. It may not be in a larger fourth wave, it could still be in an upwards trend.
You have not asked about Silver, and normally I’d not mention it, but last week it had a very interesting break below support that lasted over a year. This is extremely significant for this market. The longer the consolidation, the longer the resulting trend after a breakout. I expect Silver to now trend downwards for a long time, current highs may not be seen again for years. The trick there is finding a good entry point for short positions. Take a look at the last published weekly technical chart for Silver and you’ll see what I mean. “
Thanks again, Lara.
As an interesting aside that adds further weight to a major S&P500 top, “Elliot Wave Principle” 10th Edition, on page 148 elaborates on Fibo Time progresssions – no doubt taken from the Dow though)
1929+3 = 1932 Bear Market
1929+5 = 1934 Correction Bottom
1929+8 = 1937 bull market top
1929+13 = 1942 bear market bottom
1928+21 = 1949 bear market bottom
1928+34 = 1962 crash bottom
1928+55 = 1983 probable Supercycle peak
_____________________________________
Frost and Prechter on page 149 then note a time deviation of plus or minus two units away from the exact Fib ratio for numbers 55 and 89.
So next in sequence would be
1929+89 = 2018 or S&P500 possible top range 2016-2020
OR
1928+89 = 2017 or S&P500 possible top range 2015-2019
This adds further weight that within the years 2018-2019 we should see a major market turning point. As you mention we’re not there yet! But its interesting to see such a old time progression that was first noted decades ago line up with the aging bull market you describe so well. The timing can be uncanny sometimes.
Thanks for that. Yes, it is uncanny sometimes how Fibonacci projections for targets and durations can be so accurate.