
Last analysis noted that Silver had strong support about 15.65. A downwards breakout below long held support was expected as more likely than upwards. Price closed at 15.485 this week, giving a classic downwards breakout.
Summary: A classic downwards breakout from a very long held consolidation has now occurred. The trend is down. Bounces and consolidations may be used as opportunities to join the trend.
In the first instance, expect resistance about 15.748. A small sideways consolidation or a small bounce may unfold next week.
Always trade with stops, and invest only 1-5% of equity on any one trade.
Last monthly charts can be viewed here.
New updates to this analysis are in bold.
ELLIOTT WAVE COUNTS
MAIN WAVE COUNT
WEEKLY CHART
Click chart to enlarge.
This main wave count now has good support from classic technical analysis, so it will be favoured. This wave count looks highly likely.
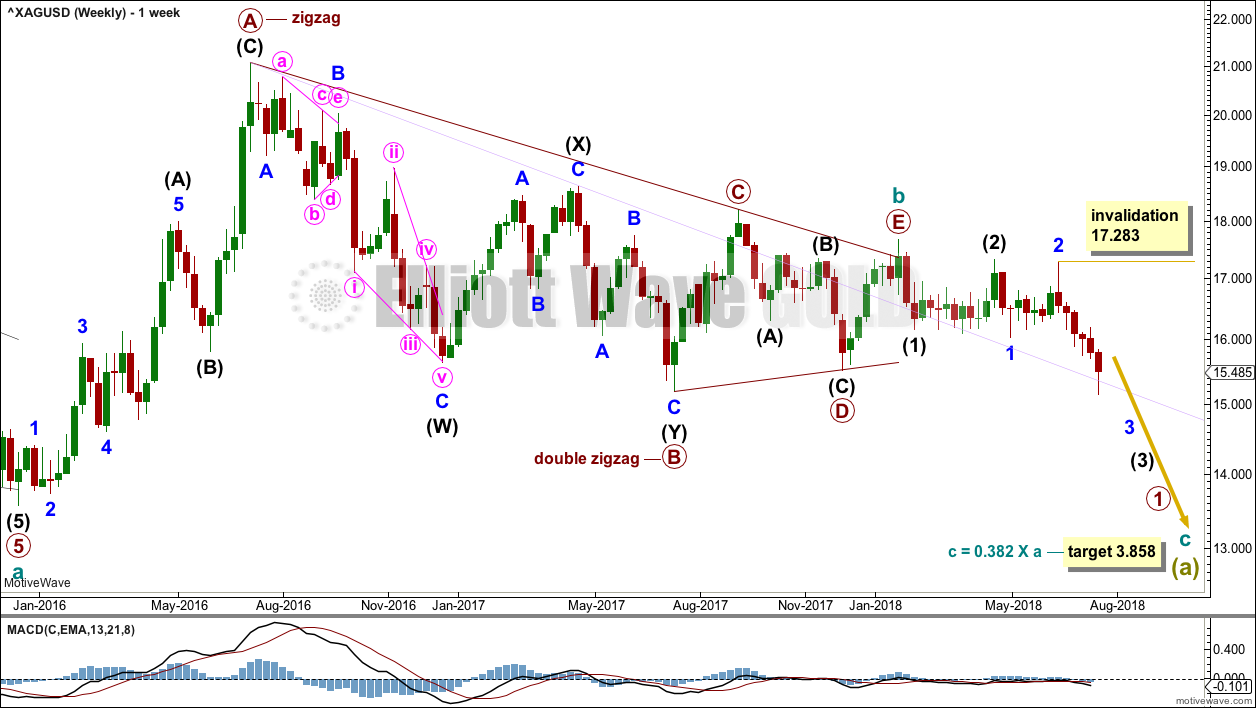
The first wave count expects that the bear market, which began from the April 2011 high, is incomplete.
Cycle wave a is seen as a five wave impulse for this main wave count. There are multiple corrective structures possible still for cycle wave b.
This first weekly chart sees cycle wave b as a now possibly complete regular contracting triangle.
Primary wave E of the triangle may have ended with an overshoot of the A-C trend line. If this wave count is correct, then price should have reversed already. Within the new downwards trend, no second wave correction may move beyond the start of the first wave above 17.680.
So far, within the new downwards trend, there may now be two overlapping first and second waves and a third wave at two degrees may be unfolding lower. Look out for a selling climax to end one or both of minor wave 3 and intermediate wave (3). Commodities can exhibit very strong fifth waves; this tendency is especially prevalent in fifth waves to end third wave impulses.
DAILY CHART
Click chart to enlarge.
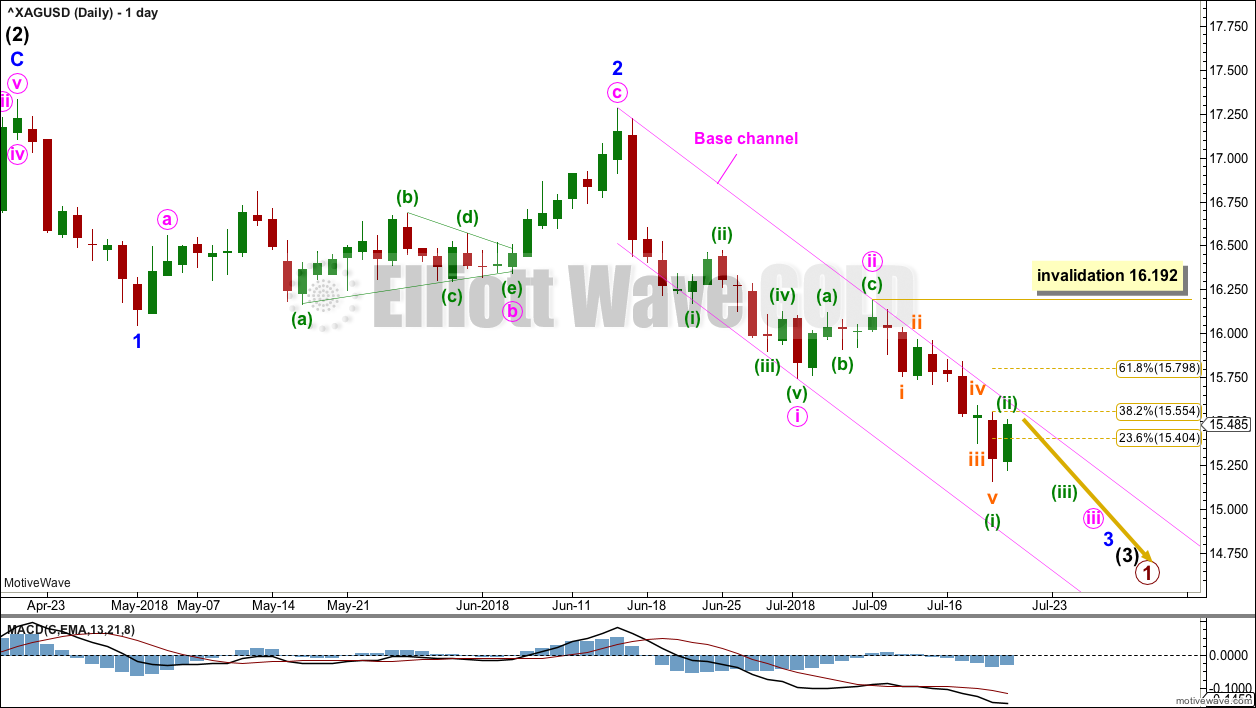
Intermediate wave (3) may only subdivide as an impulse. Within intermediate wave (3), minor waves 1 and 2 may now be complete.
Minor wave 3 may only subdivide as an impulse. Within minor wave 3, minute waves i and ii may now be complete. Minute wave iii may have just begun. Within minute wave iii, minuette wave (ii) may not move beyond the start of minuette wave (i) above 16.192.
If the base channel continues to show where bounces find resistance, then minuette wave (ii) may be over here or very soon, ending close to the 0.382 Fibonacci ratio of minuette wave (i).
Look out for surprises now to be to the downside for Silver.
SECOND WAVE COUNT
WEEKLY CHART
Click chart to enlarge.
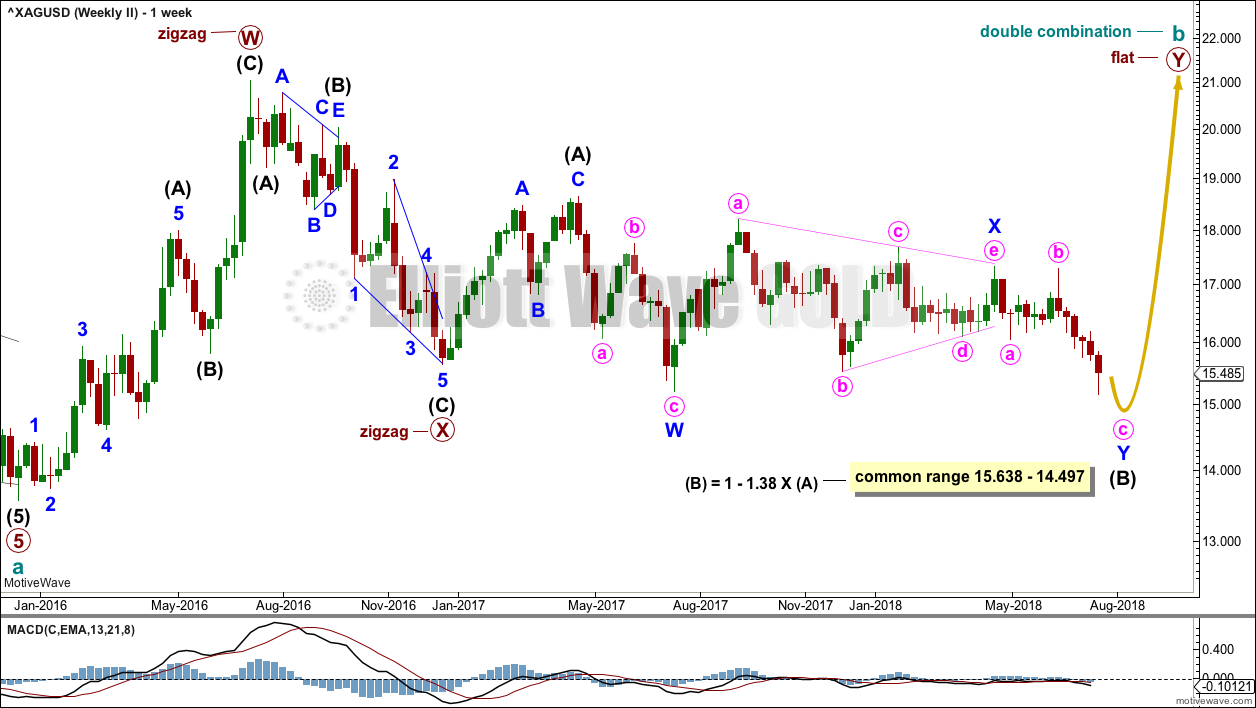
Cycle wave b may still be completing as a double combination: zigzag – X – flat. The second structure, a flat correction for primary wave Y, may be underway.
Within a flat correction, intermediate wave (B) must retrace a minimum 0.9 length of intermediate wave (A) at 15.938. Intermediate wave (B) has met this minimum requirement; the rule for a flat correction is met. The structure of intermediate wave (B) is reanalysed this week. It may be continuing a little lower as a double zigzag.
The purpose of combinations is to take up time and move price sideways. To achieve this purpose the second structure in the double normally ends about the same level as the first.
DAILY CHART
Click chart to enlarge.
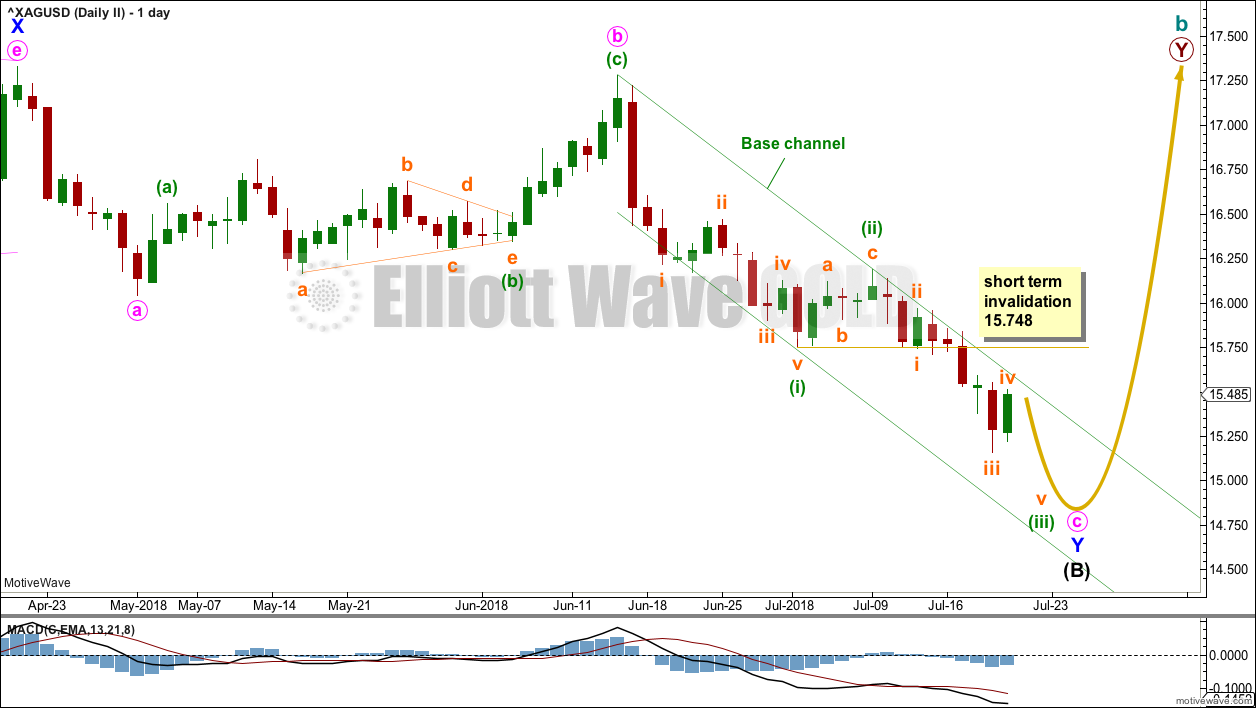
This daily chart shows all of the second possible zigzag in the double for intermediate wave (B). The second zigzag is labelled minor wave Y.
Within the zigzag of minor wave Y, minute wave c must subdivide as a five wave structure. At this stage, current labelling shows it is unfolding as an impulse. Also at this stage, it is not possible to see minute wave c complete as the last low. Therefore, more downwards movement to complete the structure looks most likely.
If minuette wave (iii) is correctly labelled as complete, then minuette wave (iv) may not move into minuette wave (i) price territory above 15.748.
The base channel so far contains all downwards movement. The upper edge may continue to provide resistance as minute wave c unfolds lower.
ALTERNATE WAVE COUNT
WEEKLY CHART
Click chart to enlarge.
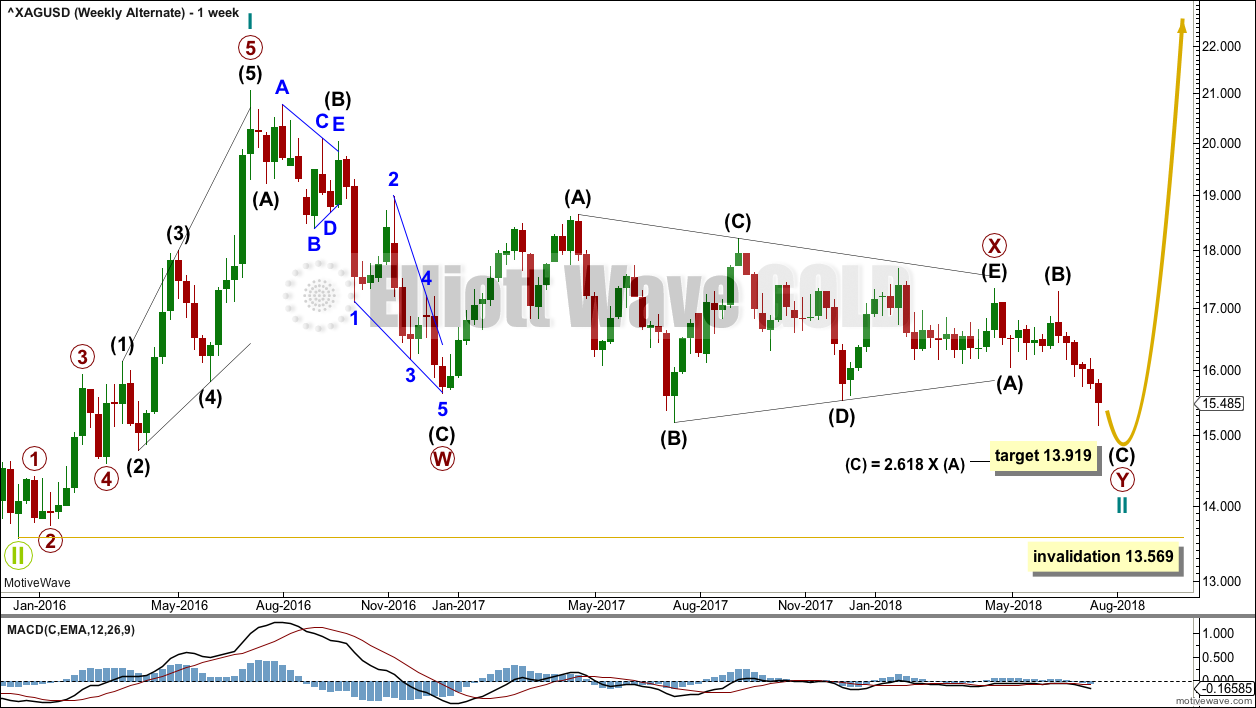
This alternate wave count looks at the possibility that the bear market may be over for Silver and a new bull market may have begun.
This wave count remains valid if cycle wave II is considered to be continuing.
Cycle wave II may be continuing further as a double zigzag. The first zigzag in the double may be complete, labelled primary wave W. The double may be joined by a corrective structure in the opposite direction, a triangle labelled primary wave X.
The second zigzag in the double may be incomplete. It is labelled primary wave Y.
Within primary wave Y, intermediate wave (C) has passed both equality in length with intermediate wave (A) and 1.618 the length of intermediate wave (A). The structure of intermediate wave (C) is incomplete.
A target is calculated using the next Fibonacci ratio in the sequence.
Cycle wave II may not move beyond the start of cycle wave I below 13.569.
At the daily chart level, the structure of intermediate wave (C) would be seen as an impulse. The subdivisions and invalidation point would be the same as the second daily chart above, only the degrees would be different.
TECHNICAL ANALYSIS
WEEKLY CHART
Click chart to enlarge. Chart courtesy of StockCharts.com.
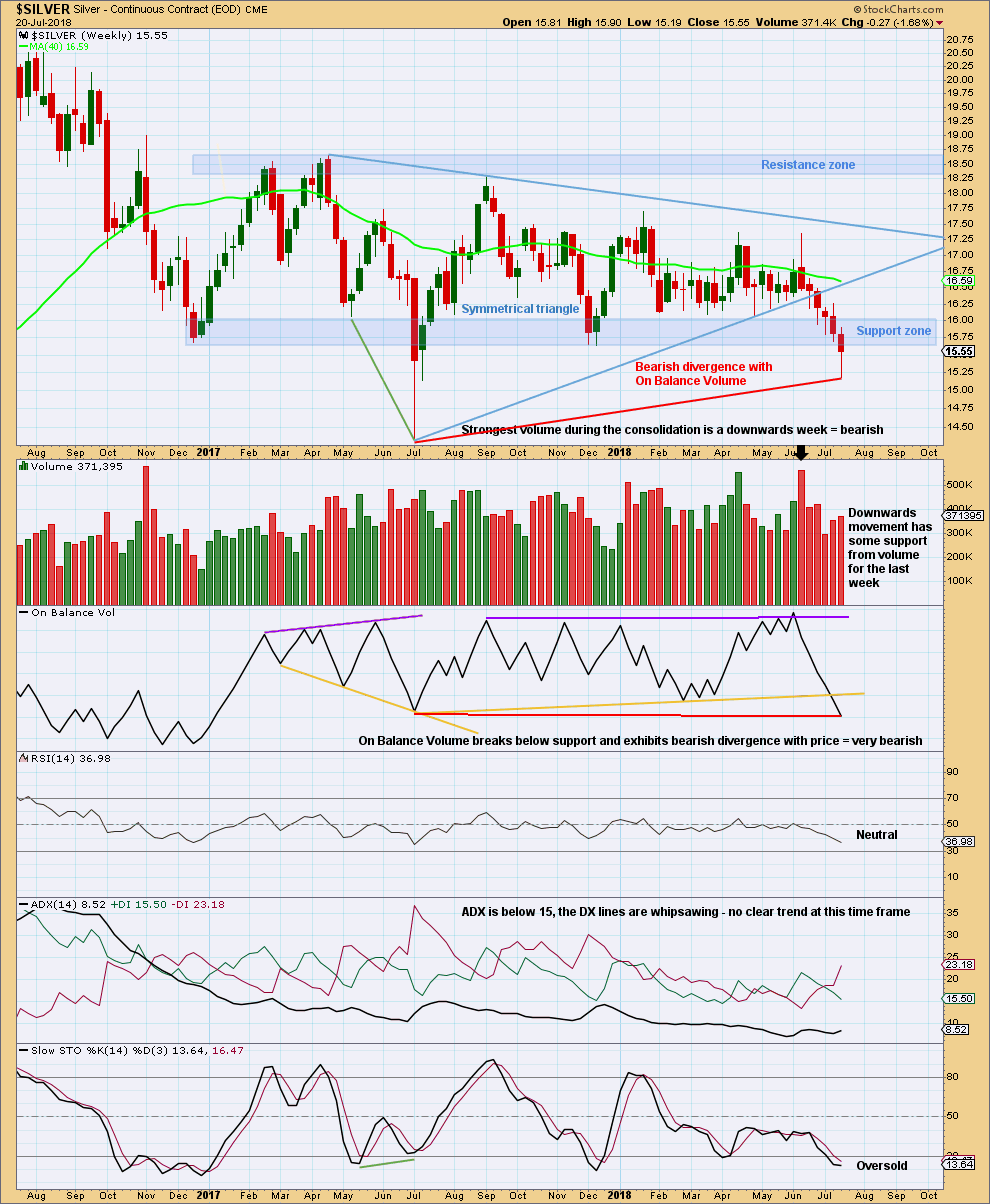
This week looks like a classic downwards breakout below support from a very long held consolidation zone.
The breakout has support from volume. On Balance Volume is very bearish.
Stochastics can remain oversold for fairly long periods of time when this market has a strong trend. Only when it is oversold and then exhibits bullish divergence with price may a low in place be a reasonable consideration. That is not the case yet.
ADX indicates no clear trend yet as it is below 15. If it reaches to 15, then it would indicate a downwards trend.
Throwbacks after downwards breakouts are not as common as pullbacks after upwards breakouts. Look out for the possibility that a strong throwback may not occur. If it does, then look for resistance about 15.70. The long lower wick on the last weekly candlestick does look bullish, so it does look like a throwback may occur in this instance.
DAILY CHART
Click chart to enlarge. Chart courtesy of StockCharts.com.
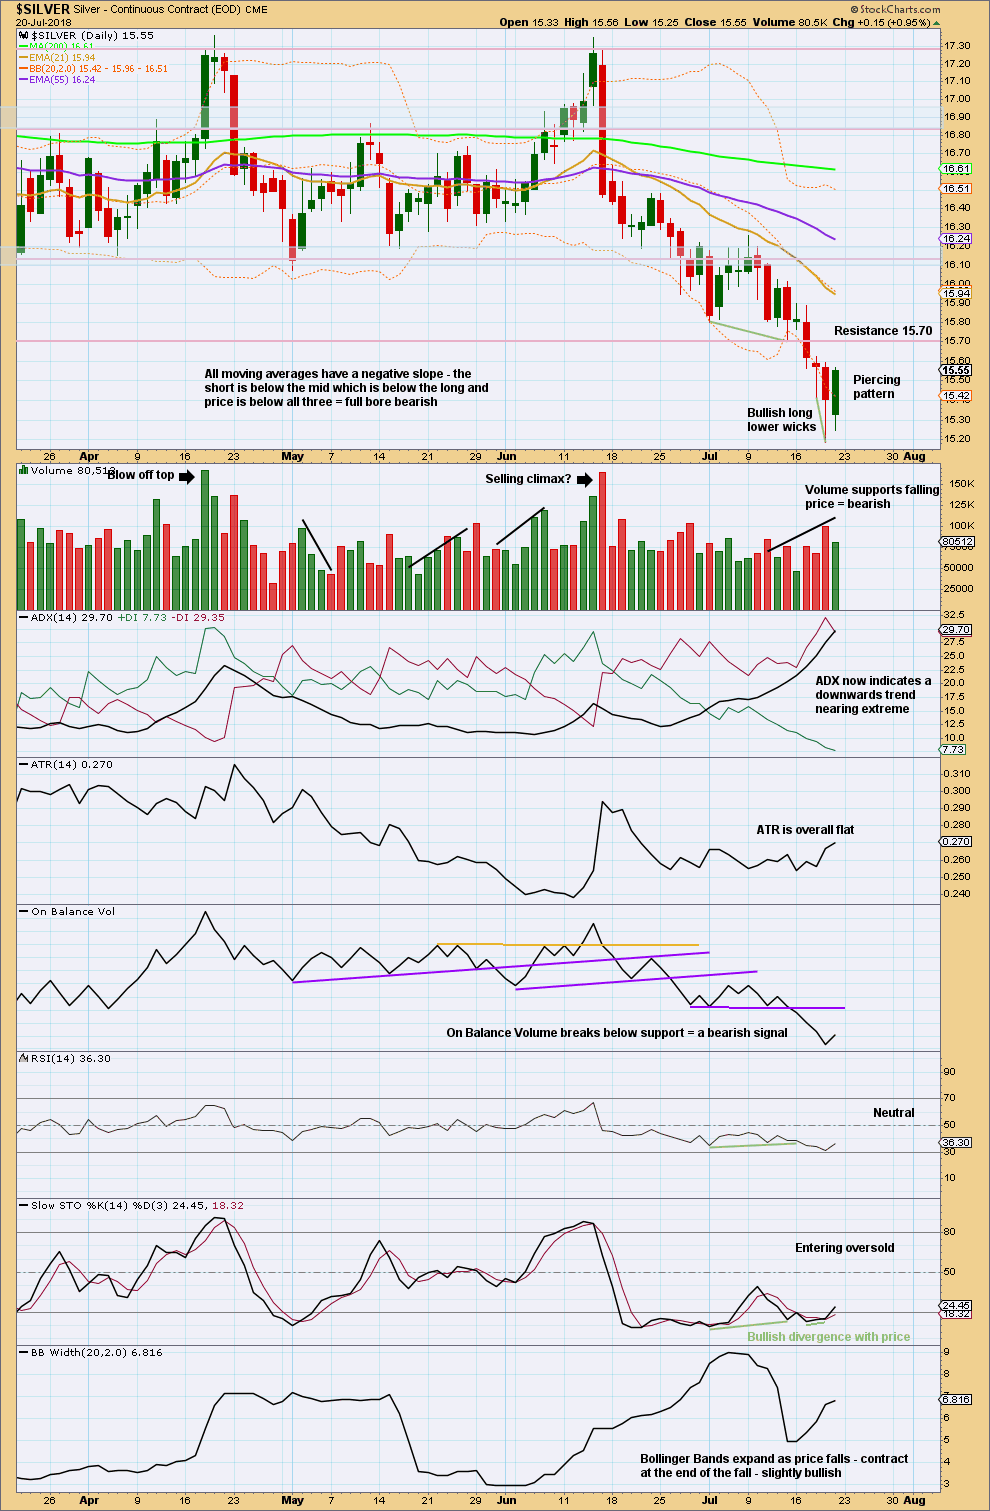
The bullish long lower wicks and the piercing pattern indicate some sideways or upwards movement may begin next week. This is supported by Stochastics at oversold and exhibiting double bullish divergence now with price.
Look for resistance about 15.70.
Published @ 12:11 a.m. EST on 22nd July, 2018.