
The short term Elliott wave structure and strong volume for Friday indicate the direction for next week.
Summary: With support from volume, GDX has effected a downwards breakout from a very long held consolidation (beginning December 2016). The target is at 16.10.
The target is at 1,185 if Gold makes a new low below 1,204.69, which now looks most likely. If Gold does make a new low, then about the target a strong bounce for a multi week upwards wave is expected.
Always trade with stops to protect your account. Risk only 1-5% of equity on any one trade.
New updates to this analysis are in bold.
Grand SuperCycle analysis is here.
Last historic analysis with monthly charts and several weekly alternates is here, video is here.
MAIN ELLIOTT WAVE COUNT
WEEKLY CHART – TRIANGLE
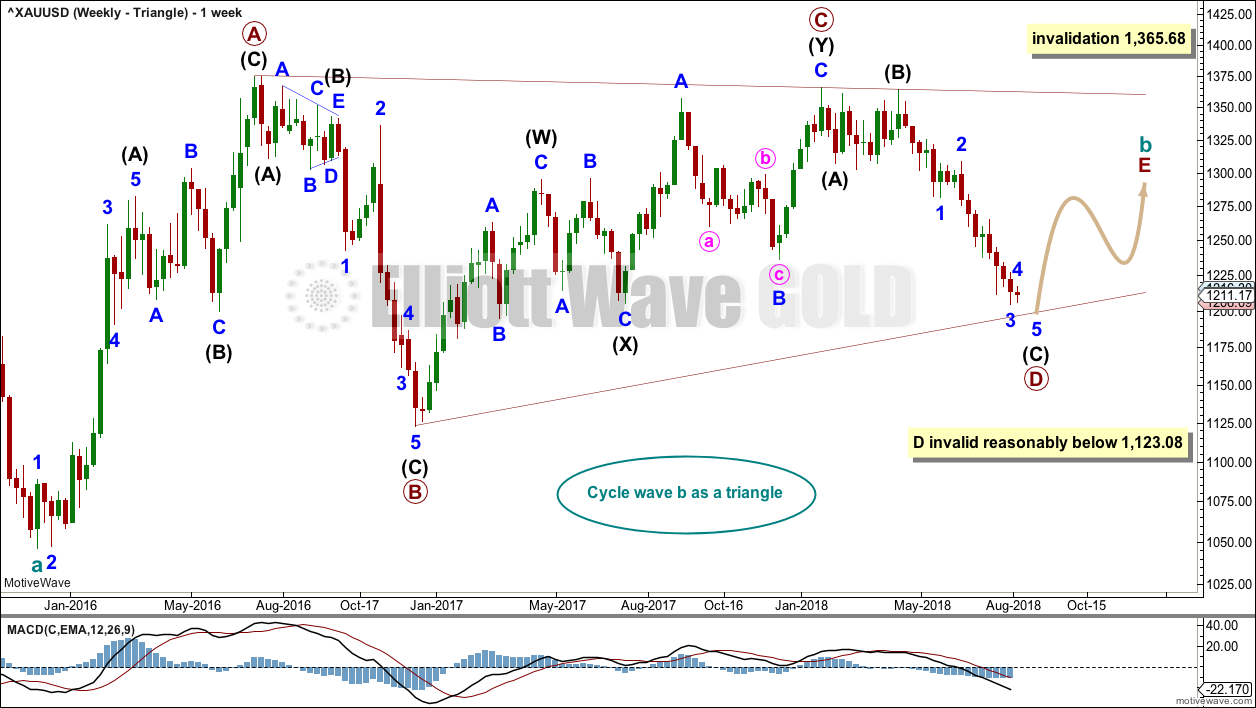
Click chart to enlarge.
There are four remaining weekly wave counts at this time for cycle wave b: a triangle, flat, combination or double zigzag. All four weekly charts will again be reviewed at the end of this week.
While the direction does not diverge for these four weekly wave counts, only one weekly wave count shall be published on a daily basis, so that the analysis is manageable for me to publish and for members to digest. Note: This does not mean that the remaining three counts may not be correct.
The triangle so far has the best fit and look.
Cycle wave b may be an incomplete triangle. The triangle may be a contracting or barrier triangle, with a contracting triangle looking much more likely because the A-C trend line does not have a strong slope. A contracting triangle could see the B-D trend line have a stronger slope, so that the triangle trend lines converge at a reasonable rate. A barrier triangle would have a B-D trend line that would be essentially flat, and the triangle trend lines would barely converge.
Within a contracting triangle, primary wave D may not move beyond the end of primary wave B below 1,123.08. Within a barrier triangle, primary wave D may end about the same level as primary wave B at 1,123.08, so that the B-D trend line is essentially flat. Only a new low reasonably below 1,123.08 would invalidate the triangle.
Within both a contracting and barrier triangle, primary wave E may not move beyond the end of primary wave C above 1,365.68.
Four of the five sub-waves of a triangle must be zigzags, with only one sub-wave allowed to be a multiple zigzag. Primary wave C is the most common sub-wave to subdivide as a multiple, and this is how primary wave C for this example fits best.
Primary wave D must be a single structure, most likely a zigzag.
There are no problems in terms of subdivisions or rare structures for this wave count. It has an excellent fit and so far a typical look.
DAILY CHART – TRIANGLE
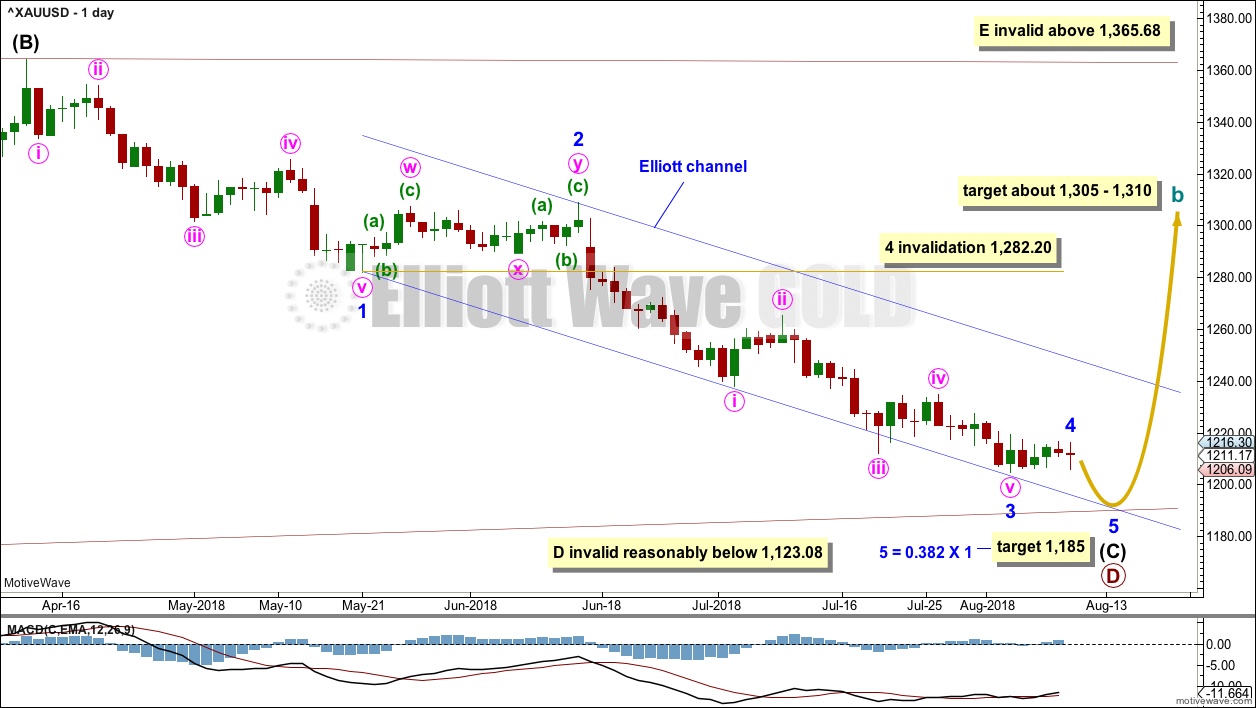
Click chart to enlarge.
Primary wave D now looks most likely to be incomplete, requiring a final short fifth wave downwards for minor wave 5.
Minor wave 5 may find support at the lower edge of the blue Elliott channel. After a new low, if price turns up and breaks above the upper edge of this channel, then that shall be a very strong indication that the downwards wave of intermediate wave (C) should be over and a new upwards wave should have begun.
On the hourly chart, minor wave 4 looks like a complete triangle. Gold often exhibits surprisingly short fifth waves out of its fourth wave triangles; if the target calculated is wrong, it may be too low.
Minor wave 4 may not move into minor wave 1 price territory above 1,282.20.
HOURLY CHART
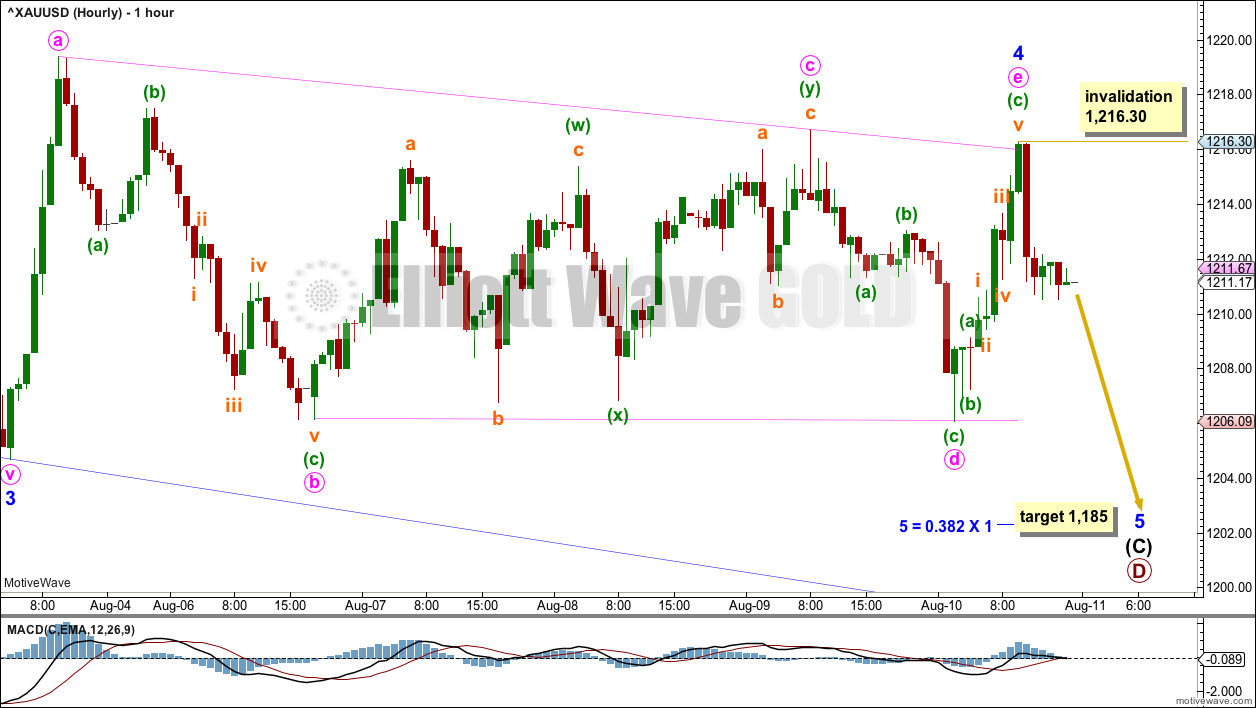
Click chart to enlarge.
Minor wave 4 fits as a completed regular barrier triangle. Here, the b-d trend line is essentially flat with minute wave d only very slightly below the end of minute wave b.
Within the triangle, it is minute wave c which subdivides as a double zigzag; this is the most common triangle sub-wave to subdivide as a multiple.
Minute wave e ends with a very small overshoot of the a-c trend line.
Within minor wave 5, no second wave correction may move beyond the start of its first wave above 1,216.30.
ALTERNATE HOURLY CHART
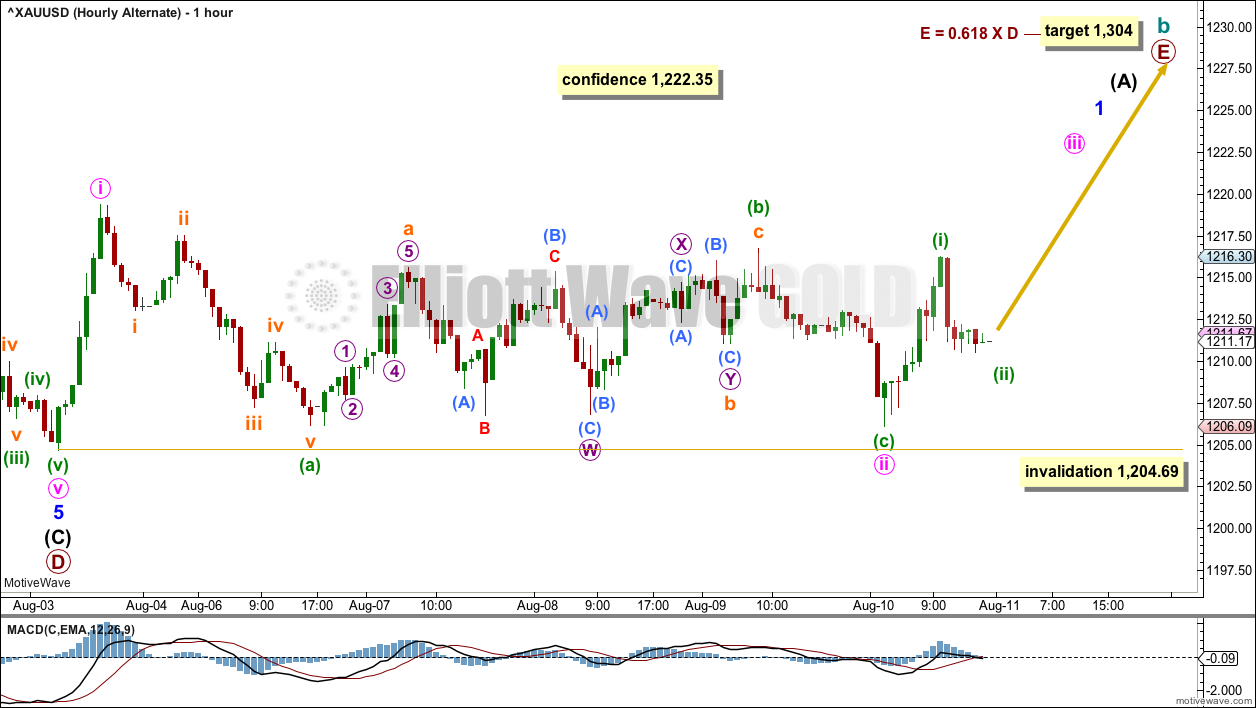
Click chart to enlarge.
This was until today the main hourly Elliott wave count. Now strong volume for downwards movement on Friday and a possible pennant pattern indicate that this wave count should be judged to have a lower probability.
It is possible that primary wave D was over at the last low, and that sideways movement of the last few sessions is a first wave for minute wave i and a deep time consuming second wave for minute wave ii. If minute wave ii continues further, then it may not move beyond the start of minute wave i below 1,204.69.
Primary wave E may last several weeks and may end about strong resistance at 1,305 – 1,310.
WEEKLY CHART – FLAT
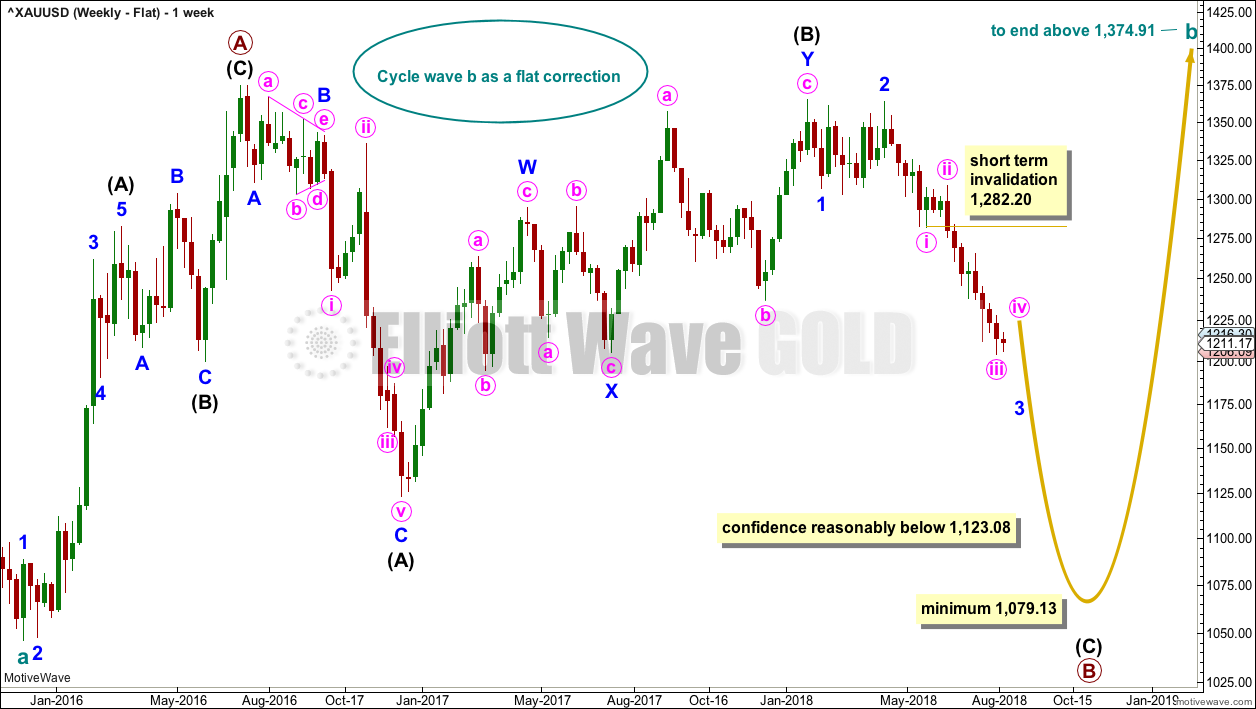
Click chart to enlarge.
It is possible that cycle wave b may be a flat correction. Within a flat correction, primary wave B must retrace a minimum 0.9 length of primary wave A at 1,079.13 or below. Primary wave B may make a new low below the start of primary wave A at 1,046.27 as in an expanded flat correction.
Only a new low reasonably below 1,123.08 would provide reasonable confidence in this wave count.
Intermediate wave (C) must subdivide as a five wave structure; it may be unfolding as an impulse. Within intermediate wave (C), only minor waves 1 and 2 may be complete. Minor wave 3 may be an incomplete impulse, and within it minute wave iv may have just ended as a small triangle. But if minute wave iv continues further, it may not move into minute wave i price territory above 1,282.20.
When minor wave 3 is complete, then this wave count shall expect a multi week bounce or sideways consolidation for minor wave 4. At that stage, the invalidation point must move up to the end of minor wave 1 at 1,307.09.
Minor wave 2 was a double zigzag lasting nine weeks. To exhibit alternation and reasonable proportion minor wave 4 may be a flat, combination or triangle and may last a little longer than nine weeks as these types of corrections tend to be longer lasting than zigzags or zigzag multiples.
WEEKLY CHART – COMBINATION
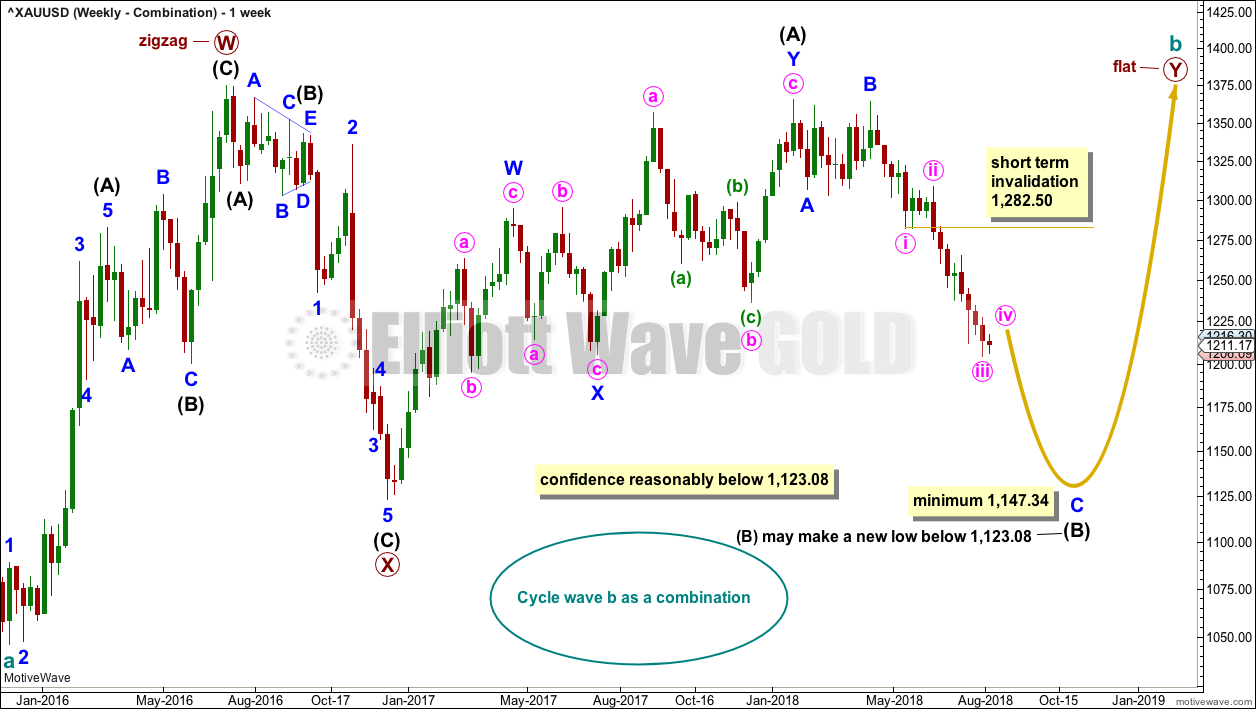
Click chart to enlarge.
It is essential when a triangle is considered to always consider alternates. Too many times over the years I have labelled a triangle as unfolding or even complete, only for it to be invalidated and the structure turning out to be something else.
When a triangle is invalidated, then the most common structure the correction turns out to be is a combination.
If cycle wave b is a combination, then the first structure in a double may be a complete zigzag labelled primary wave W.
The double may be joined by a three in the opposite direction, a zigzag labelled primary wave X.
The second structure in the double may be a flat correction labelled primary wave Y. It may also be a triangle, but that would expect essentially the same movement as the weekly triangle chart and so shall not yet be considered while there is no divergence in the expected pathway for price.
Within a flat correction for primary wave Y, the current downwards wave of intermediate wave (B) may be a single or multiple zigzag; for now it shall be labelled as a single. Intermediate wave (B) must retrace a minimum 0.9 length of intermediate wave (A) at 1,147.34. Intermediate wave (B) may move beyond the start of intermediate wave (A) as in an expanded flat.
Within the zigzag of intermediate wave (B), minor waves A and B may be complete. Minor wave C must subdivide as a five wave structure; at this stage, it may be an incomplete impulse. Within minor wave C, minute waves i and ii and now iii may be complete. It is also possible at the end of this week that minute wave iv may be a small complete triangle. If it continues further, then minute wave iv may not move into minute wave i price territory above 1,282.50.
When intermediate wave (B) is complete, then intermediate wave (C) would be expected to make at least a slight new high above the end of intermediate wave (A) at 1,365.68 to avoid a truncation. Primary wave Y would be most likely to end about the same level as primary wave W at 1,374.91, so that the whole structure takes up time and moves price sideways, as that is the purpose of double combinations.
While double combinations are very common, triples are extremely rare. When the second structure in a double is complete, then it is extremely likely that the whole correction is over.
This is the most immediately bearish wave count.
WEEKLY CHART – DOUBLE ZIGZAG
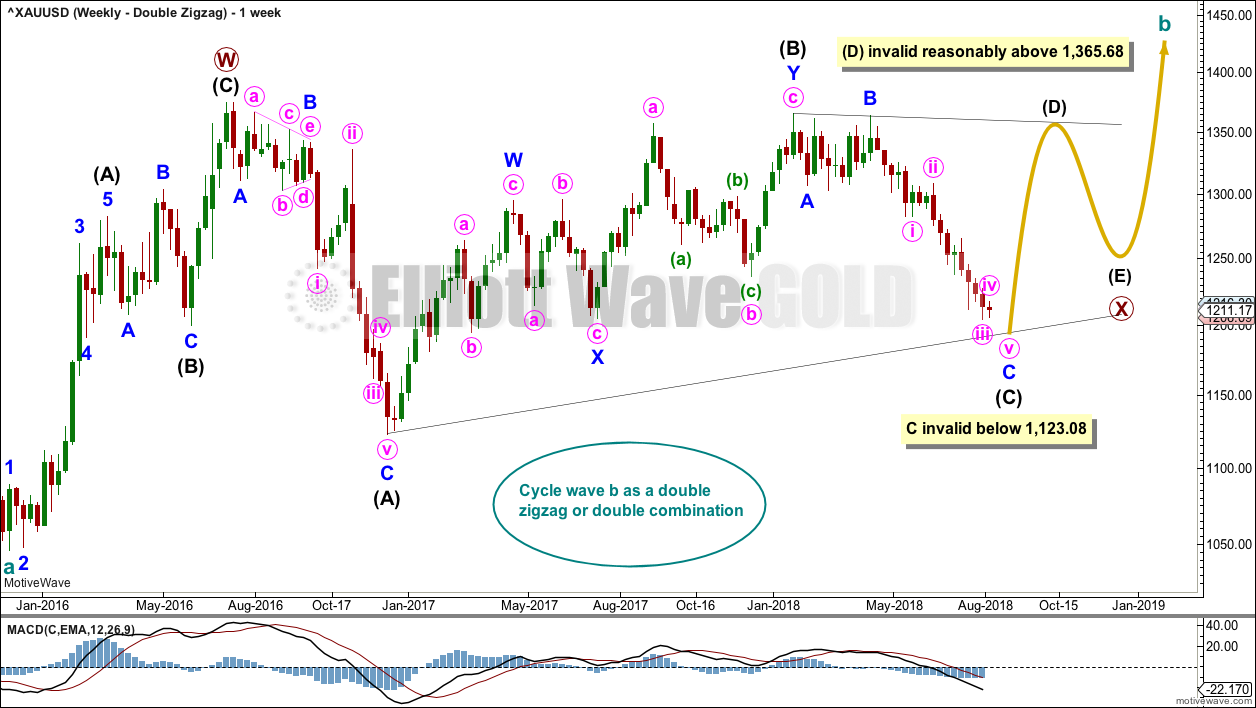
Click chart to enlarge.
Finally, it is also possible that cycle wave b may be a double zigzag or a double combination.
The first zigzag in the double is labelled primary wave W. This has a good fit.
The double may be joined by a corrective structure in the opposite direction, a triangle labelled primary wave X. The triangle would be about two thirds complete.
Within the triangle of primary wave X, intermediate wave (C) may now be almost complete. It may not move beyond the end of intermediate wave (A) below 1,123.08.
This wave count may now expect choppy overlapping movement in an ever decreasing range for several more months. After the triangle is complete, then an upwards breakout would be expected from it.
Primary wave Y would most likely be a zigzag because primary wave X would be shallow; double zigzags normally have relatively shallow X waves.
Primary wave Y may also be a flat correction if cycle wave b is a double combination, but combinations normally have deep X waves. This would be less likely.
This wave count has good proportions and no problems in terms of subdivisions.
TECHNICAL ANALYSIS
WEEKLY CHART
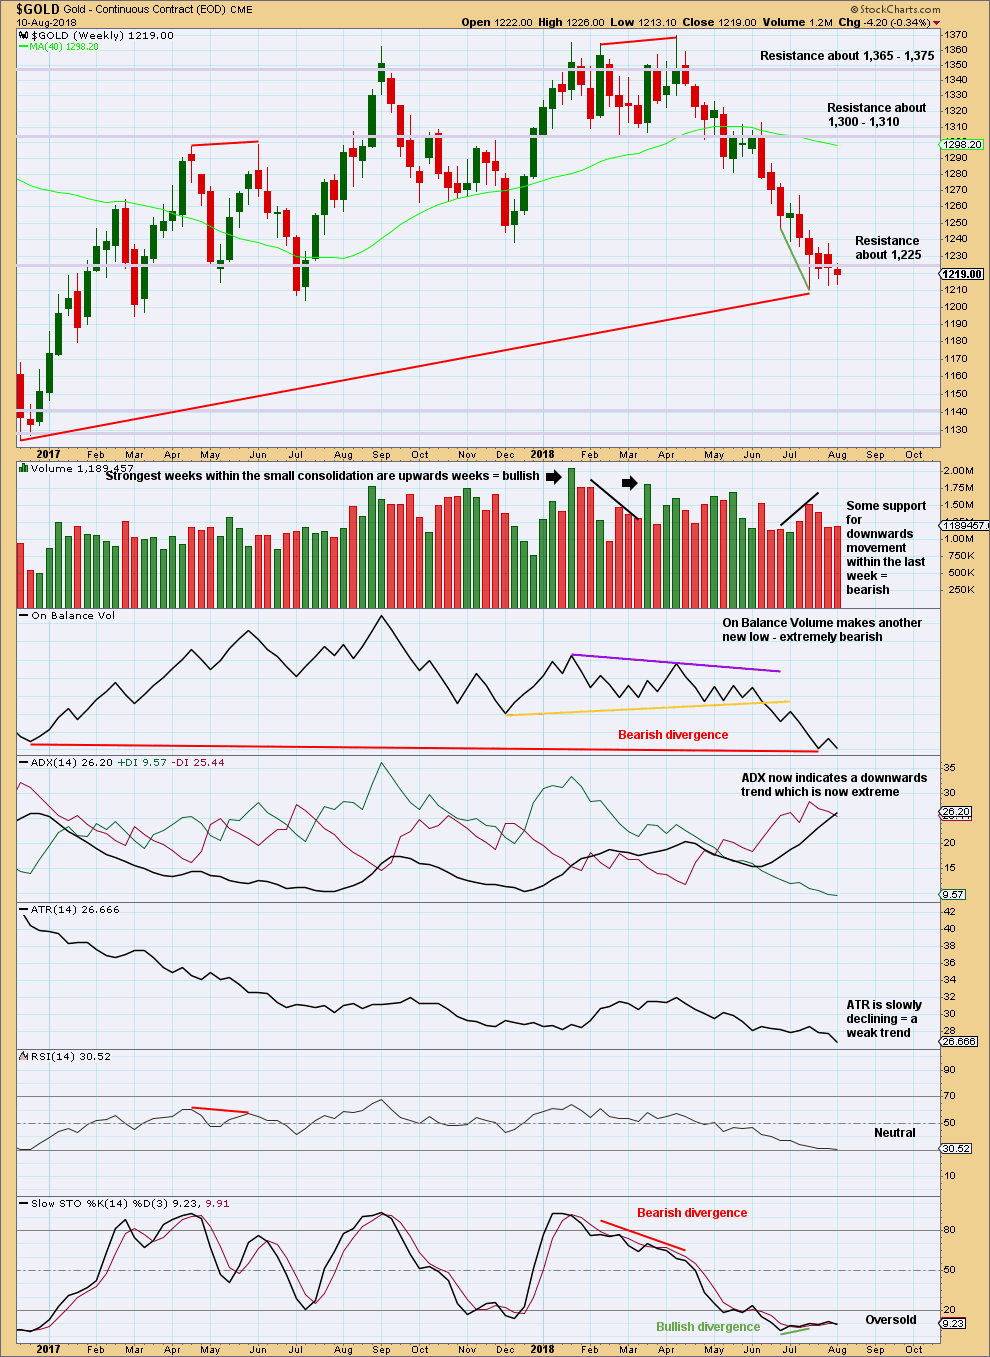
Click chart to enlarge. Chart courtesy of StockCharts.com.
The long term picture for this chart is bearish due to the long term bearish divergence between price and On Balance Volume.
Short term bullishness may have now been resolved by some sideways movement.
For this market, when a strong trend is unfolding, ADX may reach very extreme and may continue as such for several weeks.
Low and declining ATR looks normal for a B wave, particularly a triangle.
DAILY CHART
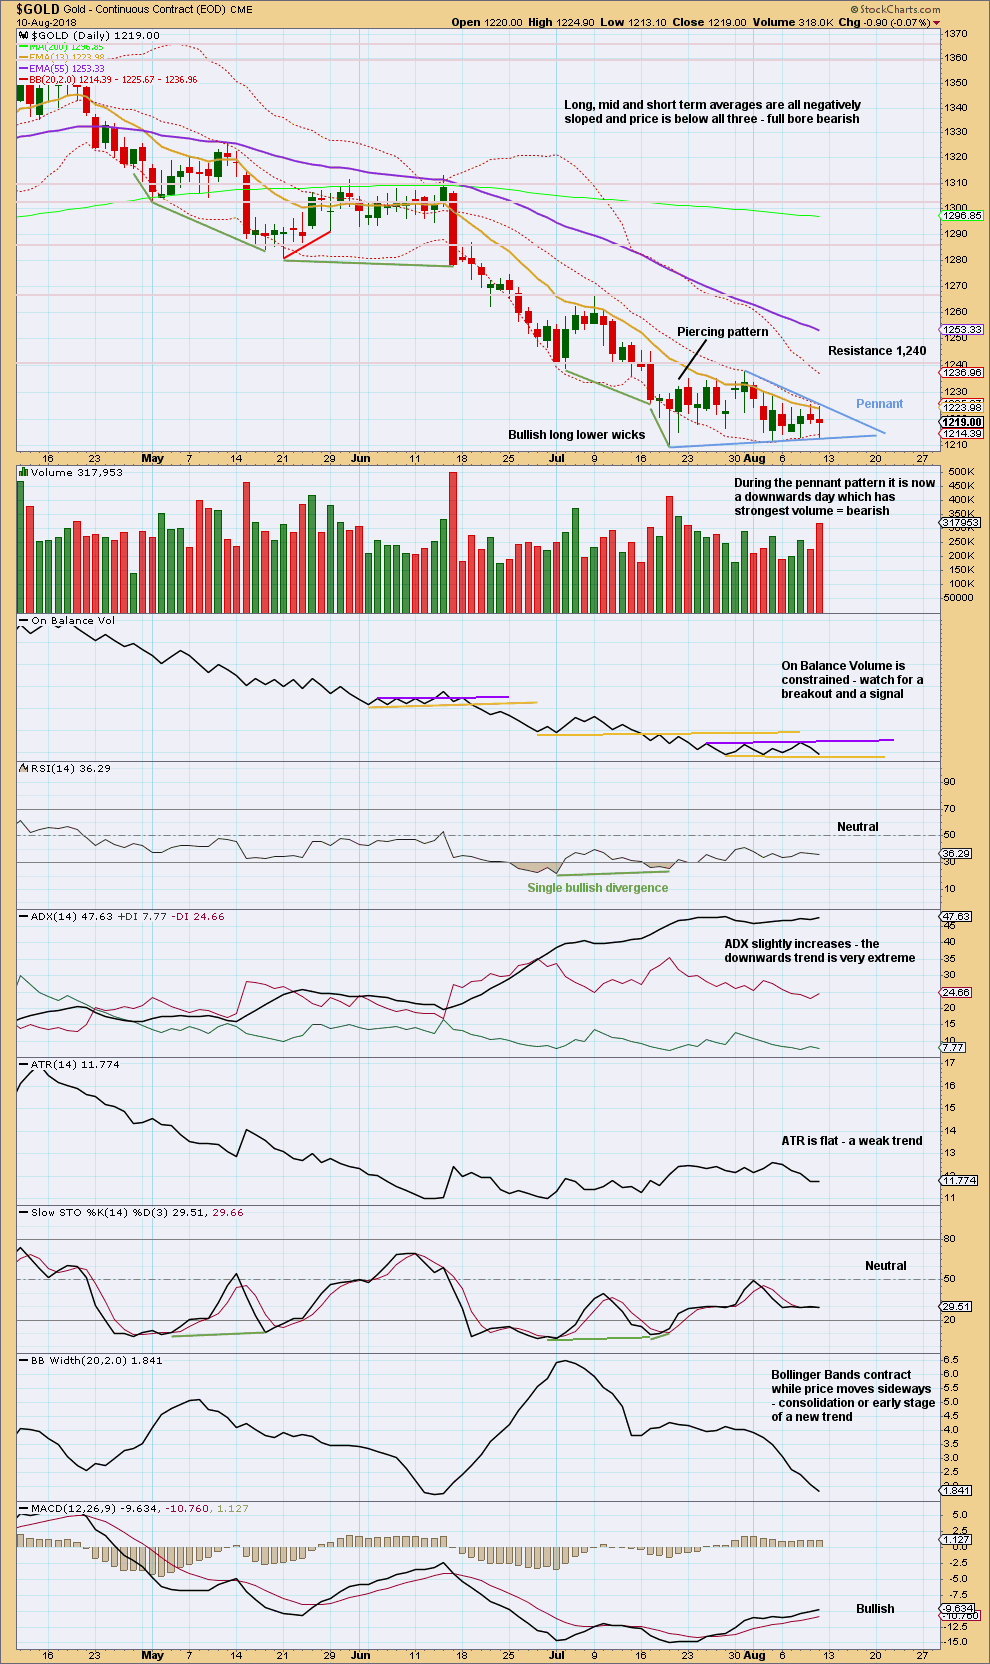
Click chart to enlarge. Chart courtesy of StockCharts.com.
A pennant pattern may have formed, which has now lasted 16 days. The best flags and pennants last less than 15 days, so this one is now a bit long lasting. The breakout should be downwards as pennants are continuation patterns.
Price moved lower and the balance of volume was downwards during Friday’s session. Also, volume supported downwards movement, which is now the strongest volume within the pennant pattern, and this supports the idea of a downwards breakout.
Support below is about 1,195 and then 1,125.
GDX WEEKLY CHART
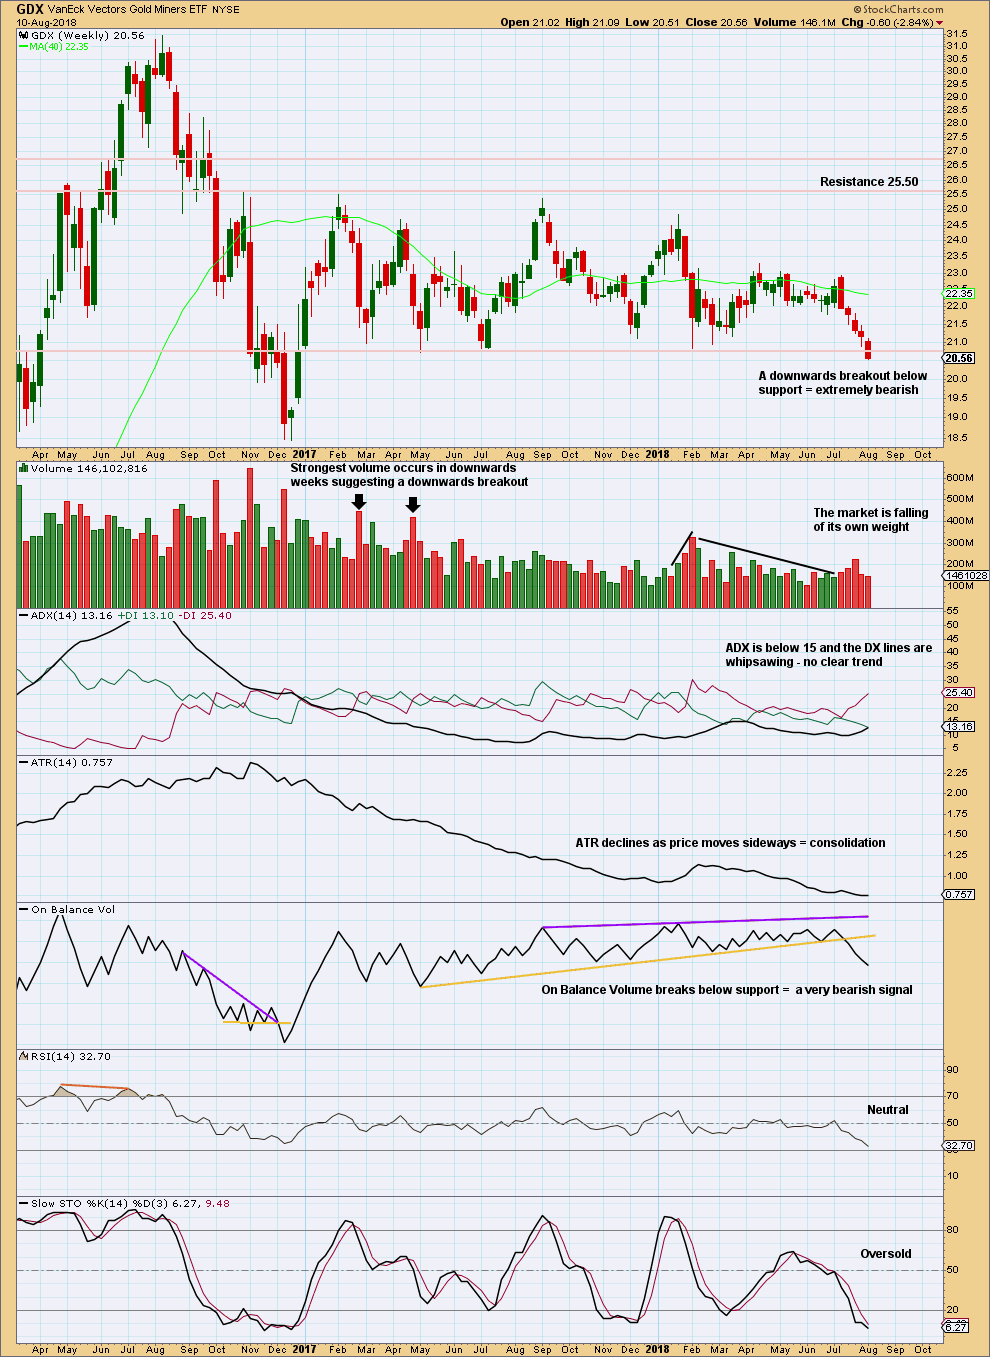
Click chart to enlarge. Chart courtesy of StockCharts.com.
GDX has been range bounce since January 2017. This is a very long sideways consolidation. The longer it continues, the more sustained the eventual breakout will be. Volume suggests the breakout may more likely be downwards.
Price this week closed below support, which was about 20.80. The close this week is the lowest price point for about a year and a half, which is extremely significant. A very long term downwards trend now looks very likely for GDX.
Next support is about 18.40.
GDX DAILY CHART
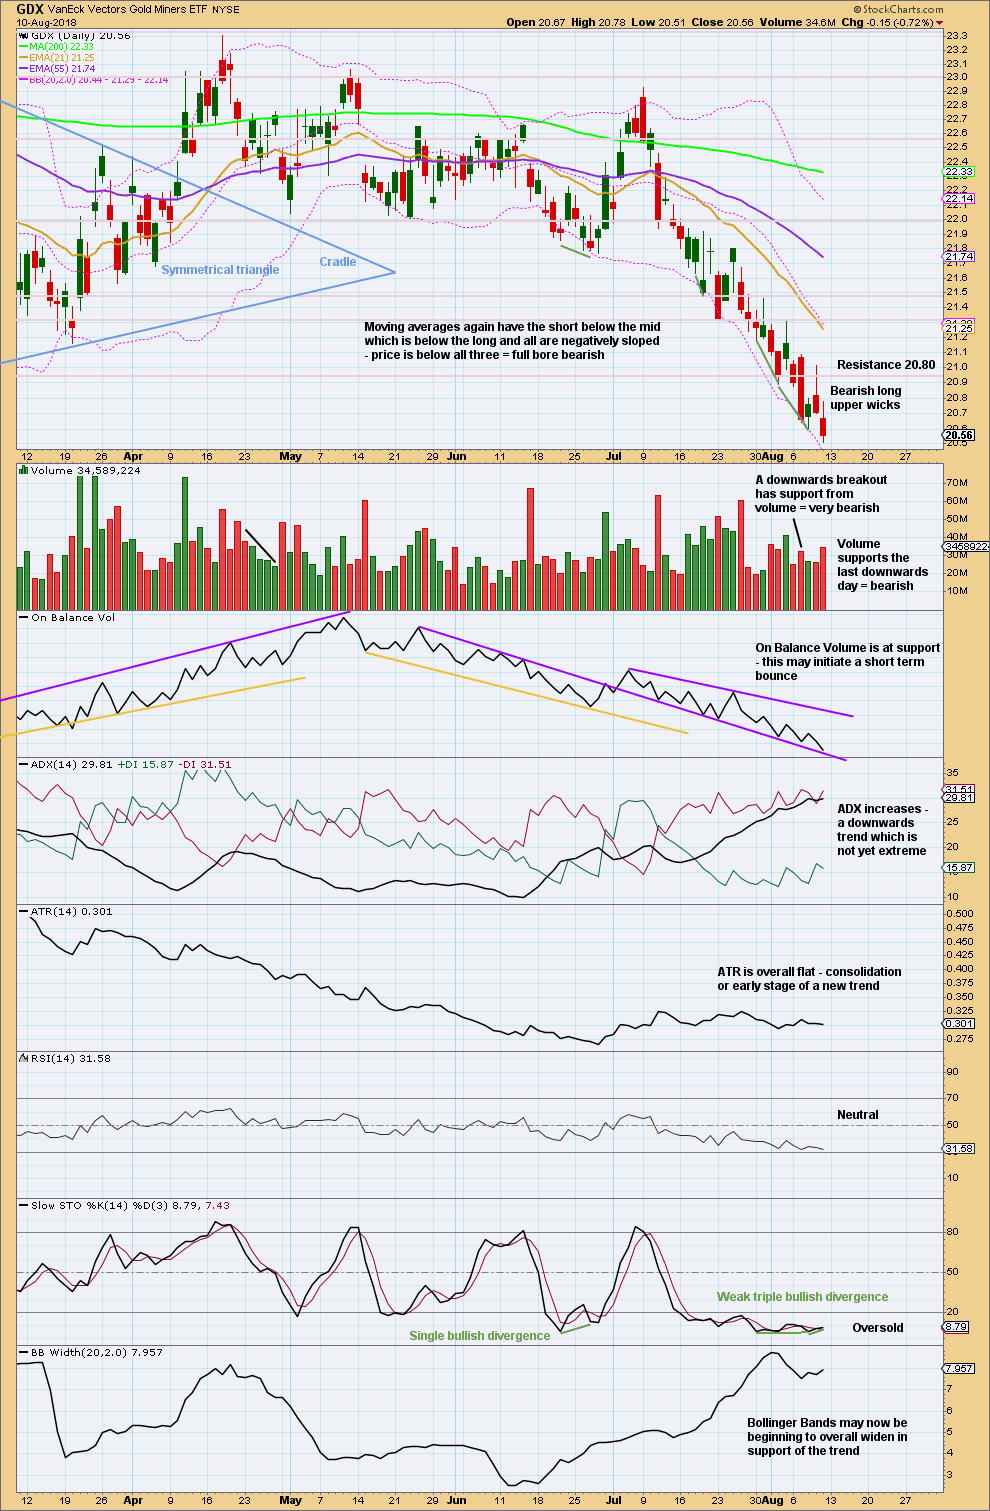
Click chart to enlarge. Chart courtesy of StockCharts.com.
GDX has now closed below support on a strong downwards day with support from volume. The low yesterday is the lowest low for GDX since December 2016, so this downwards day is extremely significant for GDX.
GDX is in a downwards trend. The short term picture now looks bearish.
Please remember to protect your trading accounts by careful risk management. Follow my two Golden Rules:
1. Always trade with stops.
2. Risk only 1-5% of equity on any one trade.
A possible target for this downwards trend to end may be now calculated using the measured rule, giving a target about 16.10.
While GDX and Gold are often positively correlated, this correlation is unreliable. Gold may still have a multi week shallow bounce and GDX may still move overall lower with smaller bounces along the way. The two wave counts, and indeed technical analysis for these two markets, cannot be reliably linked while the correlation is unreliable.
Published @ 08:26 p.m. EST on 11th August, 2018.
updated hourly chart:
minor 5 looking good, may now be in minute iv
when minor 5 is done and we see a good bounce, then a new high above its start would provide confidence now that a low is in place
because a new high above the start of minor 5 cannot be a second wave correction within minor 5, and so then minor 5 has to be over
Good morning, are we done with blue minor 5 yet?
I don’t think so..
Lara, great to hear this about your book “Then I’ve compiled tables of data for each type of correction, to see how common each type is, and common wave lengths and common total correction depth to the prior wave.”. That will really differentiate your book from F&P. Looking forward to it. Worth the wait 👍
Hi Lara,
Thank much for your response on US dollar and your book.
Though challenging for you, your book will be well worth the wait for many of us.
Thanks guys! Great to hear that there will be some who will find it useful.
My intention is for it to be a preferred EW text for learning EW.