
Again, downwards movement continues for both Gold and GDX as last analysis expected.
New targets are calculated for Gold and GDX. The long term target for GDX remains the same. Members are given some advice on how to manage short positions for GDX today.
Summary: With support from volume, GDX has effected a downwards breakout from a very long held consolidation (beginning December 2016). The long term target is at 16.02.
A new short term target for GDX is now at 18.17.
Measuring gaps may be used to adjust stops as they are rarely closed. Any longer term short positions for GDX which remain open may now have stops moved down to just above 19.74.
The target for Gold is now at 1,166. If price keeps falling through this target, then a classic analysis target is at 1,157. At about one of these targets a bounce is expected for a multi week throwback or consolidation.
Always trade with stops to protect your account. Risk only 1-5% of equity on any one trade.
New updates to this analysis are in bold.
Grand SuperCycle analysis is here.
Last historic analysis with monthly charts and several weekly alternates is here, video is here.
Weekly charts were last all reviewed here, with video here.
MAIN ELLIOTT WAVE COUNT
WEEKLY CHART – TRIANGLE
Click chart to enlarge.
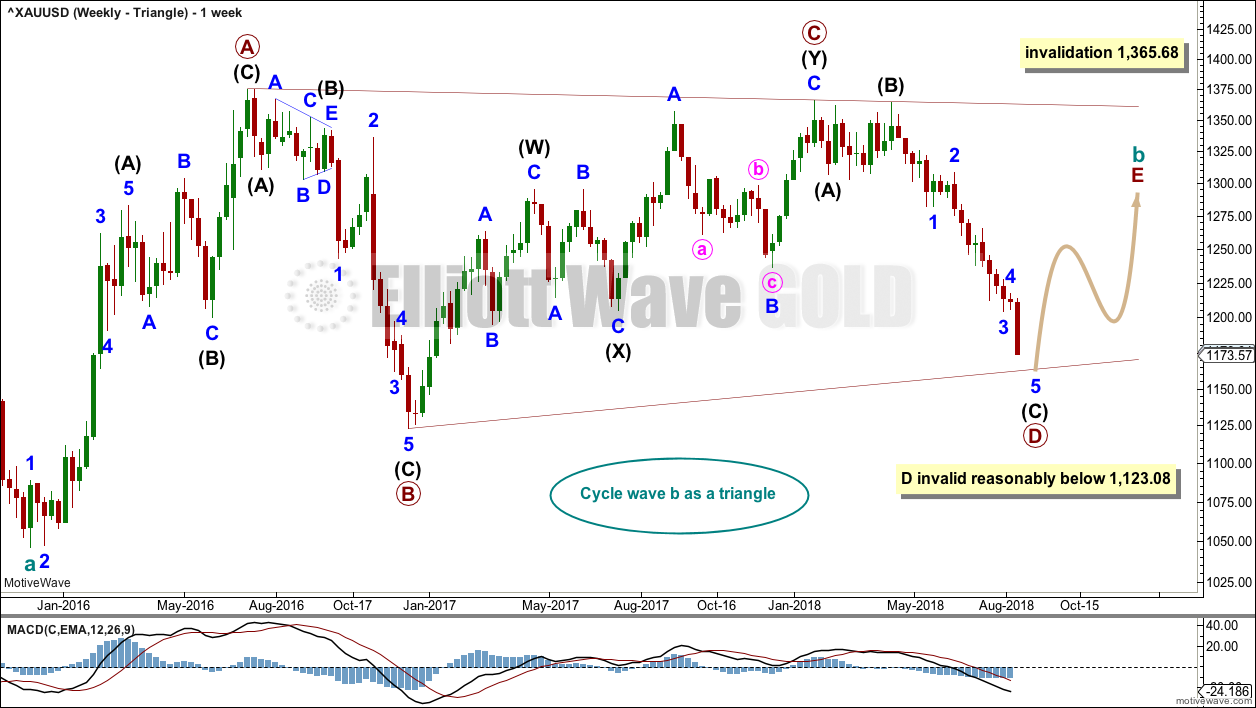
There are four remaining weekly wave counts at this time for cycle wave b: a triangle, flat, combination or double zigzag. Only one weekly chart shall be published Monday to Thursday and all four weekly charts will be reviewed at the end of the week after the close of Friday’s session.
While the direction does not diverge for these four weekly wave counts, only one weekly wave count shall be published on a daily basis, so that the analysis is manageable for me to publish and for members to digest. Note: This does not mean that the remaining three counts may not be correct.
The triangle so far has the best fit and look.
Cycle wave b may be an incomplete triangle. The triangle may be a contracting or barrier triangle, with a contracting triangle looking much more likely because the A-C trend line does not have a strong slope. A contracting triangle could see the B-D trend line have a stronger slope, so that the triangle trend lines converge at a reasonable rate. A barrier triangle would have a B-D trend line that would be essentially flat, and the triangle trend lines would barely converge.
Within a contracting triangle, primary wave D may not move beyond the end of primary wave B below 1,123.08. Within a barrier triangle, primary wave D may end about the same level as primary wave B at 1,123.08, so that the B-D trend line is essentially flat. Only a new low reasonably below 1,123.08 would invalidate the triangle.
Within both a contracting and barrier triangle, primary wave E may not move beyond the end of primary wave C above 1,365.68.
Four of the five sub-waves of a triangle must be zigzags, with only one sub-wave allowed to be a multiple zigzag. Primary wave C is the most common sub-wave to subdivide as a multiple, and this is how primary wave C for this example fits best.
Primary wave D must be a single structure, most likely a zigzag.
There are no problems in terms of subdivisions or rare structures for this wave count. It has an excellent fit and so far a typical look.
DAILY CHART – TRIANGLE
Click chart to enlarge.
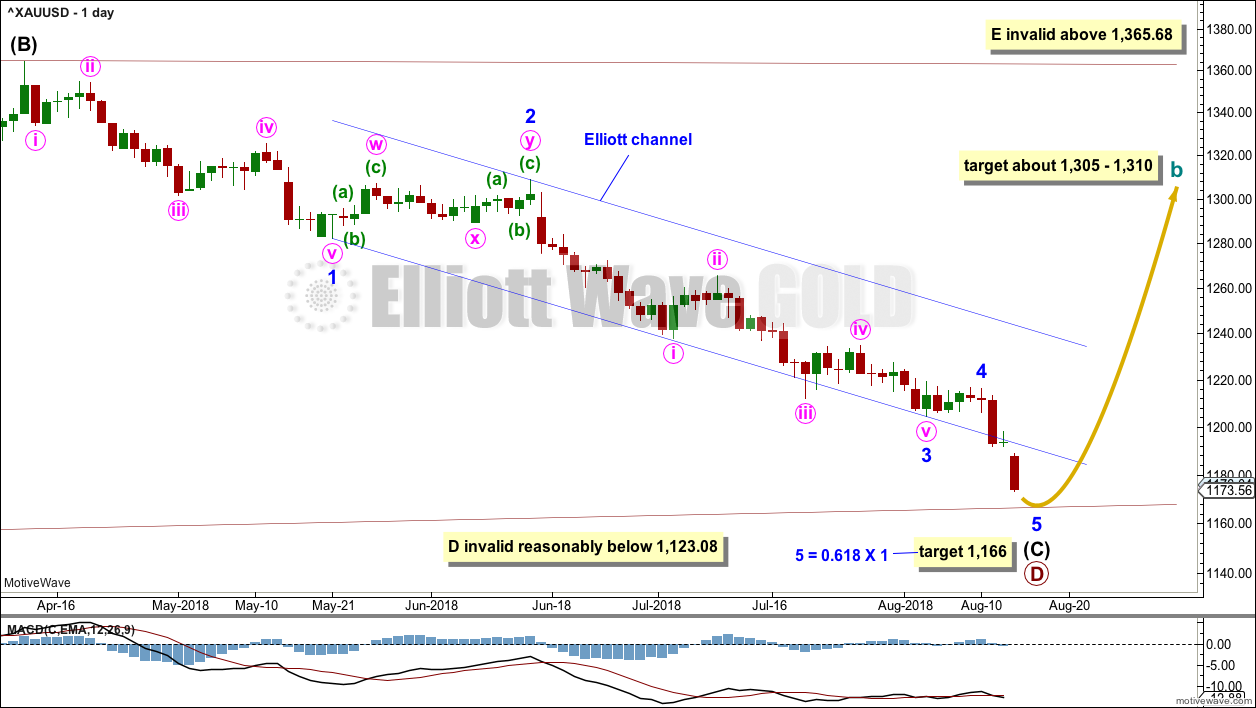
Primary wave D may now be close to completion with minor wave 5 completing.
Minor wave 5 has not found support at the lower edge of the blue Elliott channel; it has now slightly overshot the channel. Fifth waves for commodities do sometimes exhibit strength and do sometimes overshoot channels.
If price turns up and breaks above the upper edge of this channel, then that shall be a very strong indication that the downwards wave of intermediate wave (C) should be over and a new upwards wave should have begun.
Minor wave 4 looks like a complete triangle. Gold often exhibits surprisingly short fifth waves out of its fourth wave triangles. A new target is calculated today which expects minor wave 5 to still be relatively short.
Minor wave 4 may not move into minor wave 1 price territory above 1,282.20.
HOURLY CHART
Click chart to enlarge.
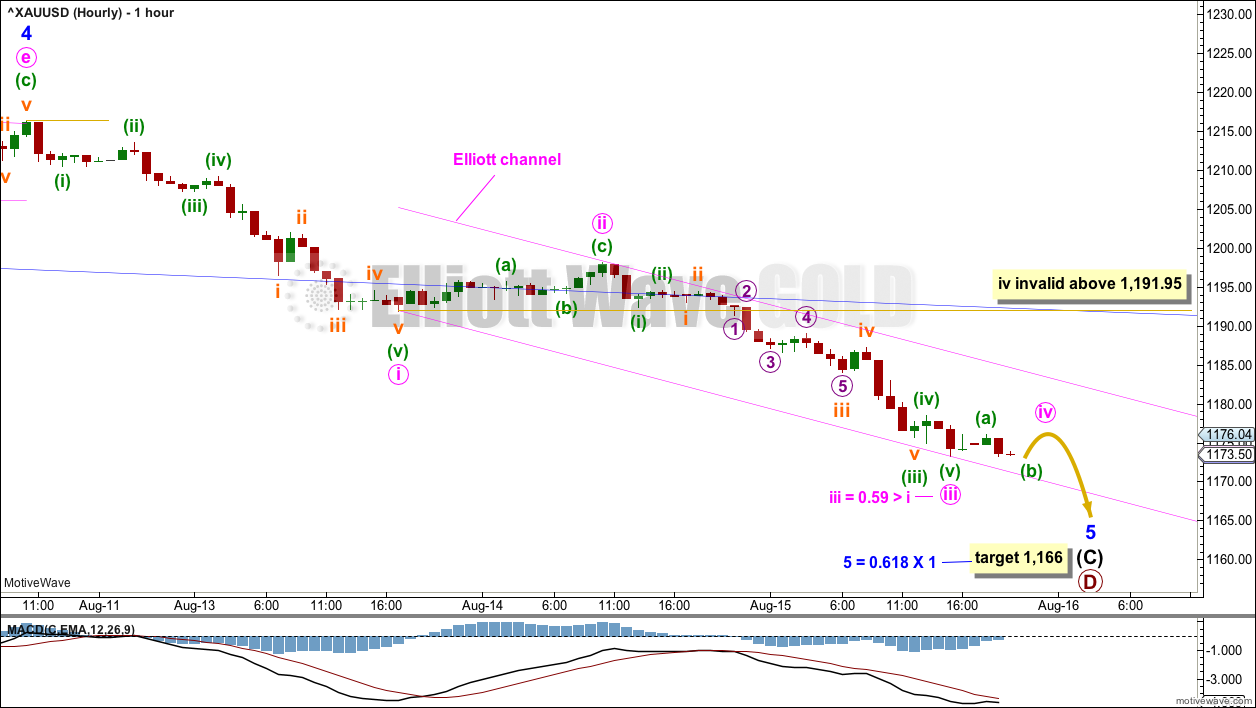
Minor wave 5 may be still an incomplete impulse.
Within the impulse, both minute waves i and iii are extended and have a Fibonacci ratio close to equality. Only one or two motive waves may extend within an impulse, not all three. Minute wave v may not extend in order for this core Elliott wave rule to be met.
Minute wave v should be expected to be shorter than minute waves i and iii, which were about 24 in length.
Minute wave ii was a shallow zigzag lasting 17 hours. Minute wave iv may be a little quicker; fourth waves for Gold do tend to be more brief than its second waves. Minute wave iv may be a shallow flat, combination or triangle to exhibit alternation in structure with minute wave ii.
A channel is drawn about minor wave 5 using Elliott’s technique. Look for minute wave iv to find resistance about the upper edge of this channel if it lasts that long.
The target remains at 1,166.
After new lows, if price turns up very strongly and breaks clearly above the upper edge of this narrow pink Elliott channel, that shall be the earliest indication of a low then in place.
At this stage, the structure of minor wave 5 is incomplete. Expect downwards movement to continue at least a little further.
TECHNICAL ANALYSIS
WEEKLY CHART
Click chart to enlarge. Chart courtesy of StockCharts.com.
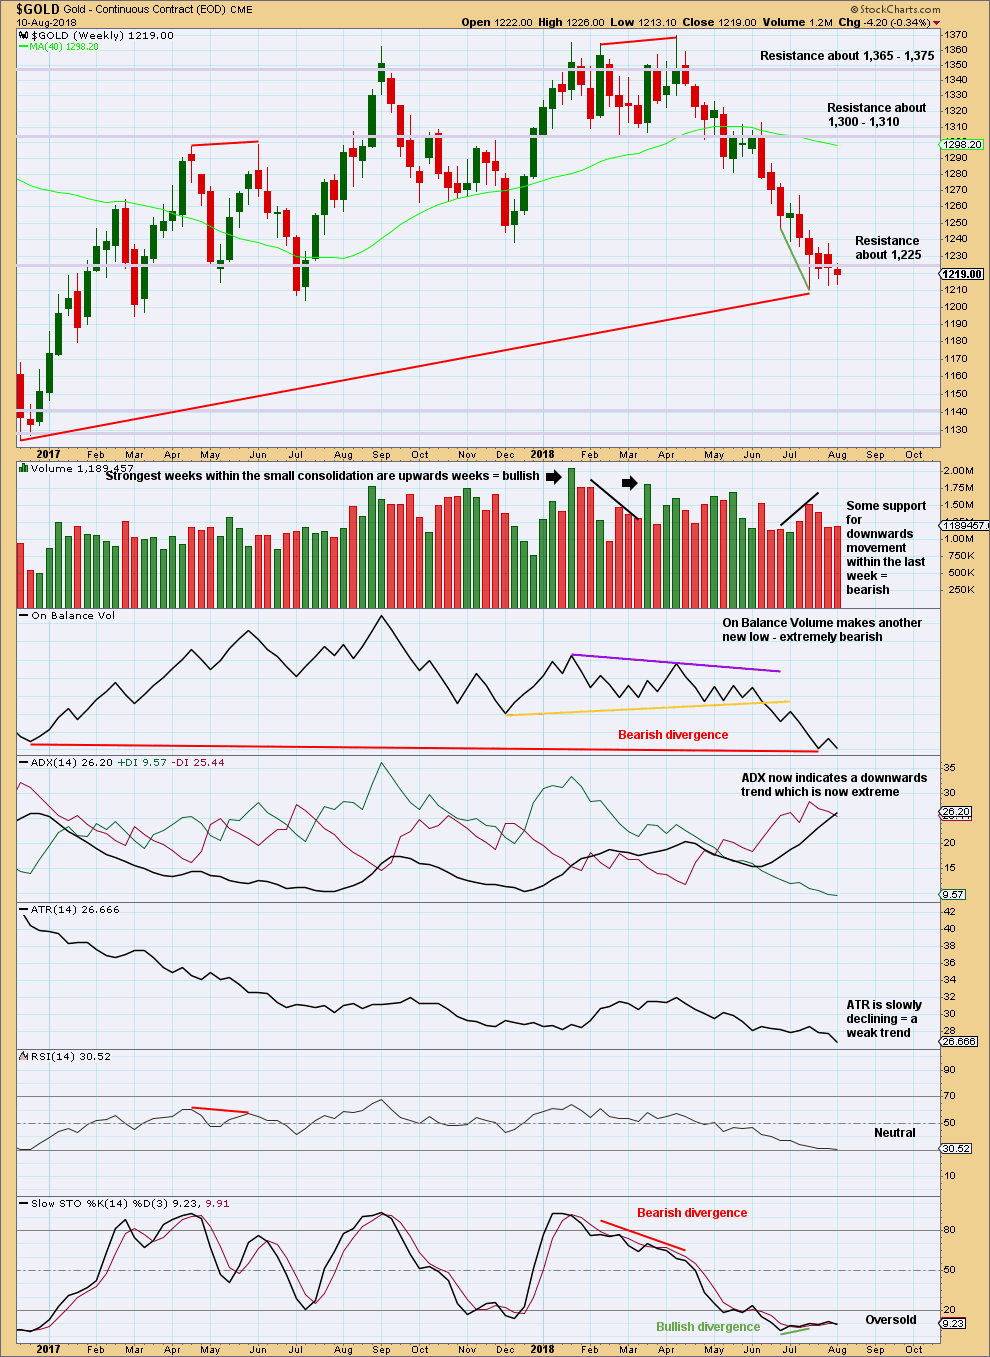
The long term picture for this chart is bearish due to the long term bearish divergence between price and On Balance Volume.
Short term bullishness may have now been resolved by some sideways movement.
For this market, when a strong trend is unfolding, ADX may reach very extreme and may continue as such for several weeks.
Low and declining ATR looks normal for a B wave, particularly a triangle.
DAILY CHART
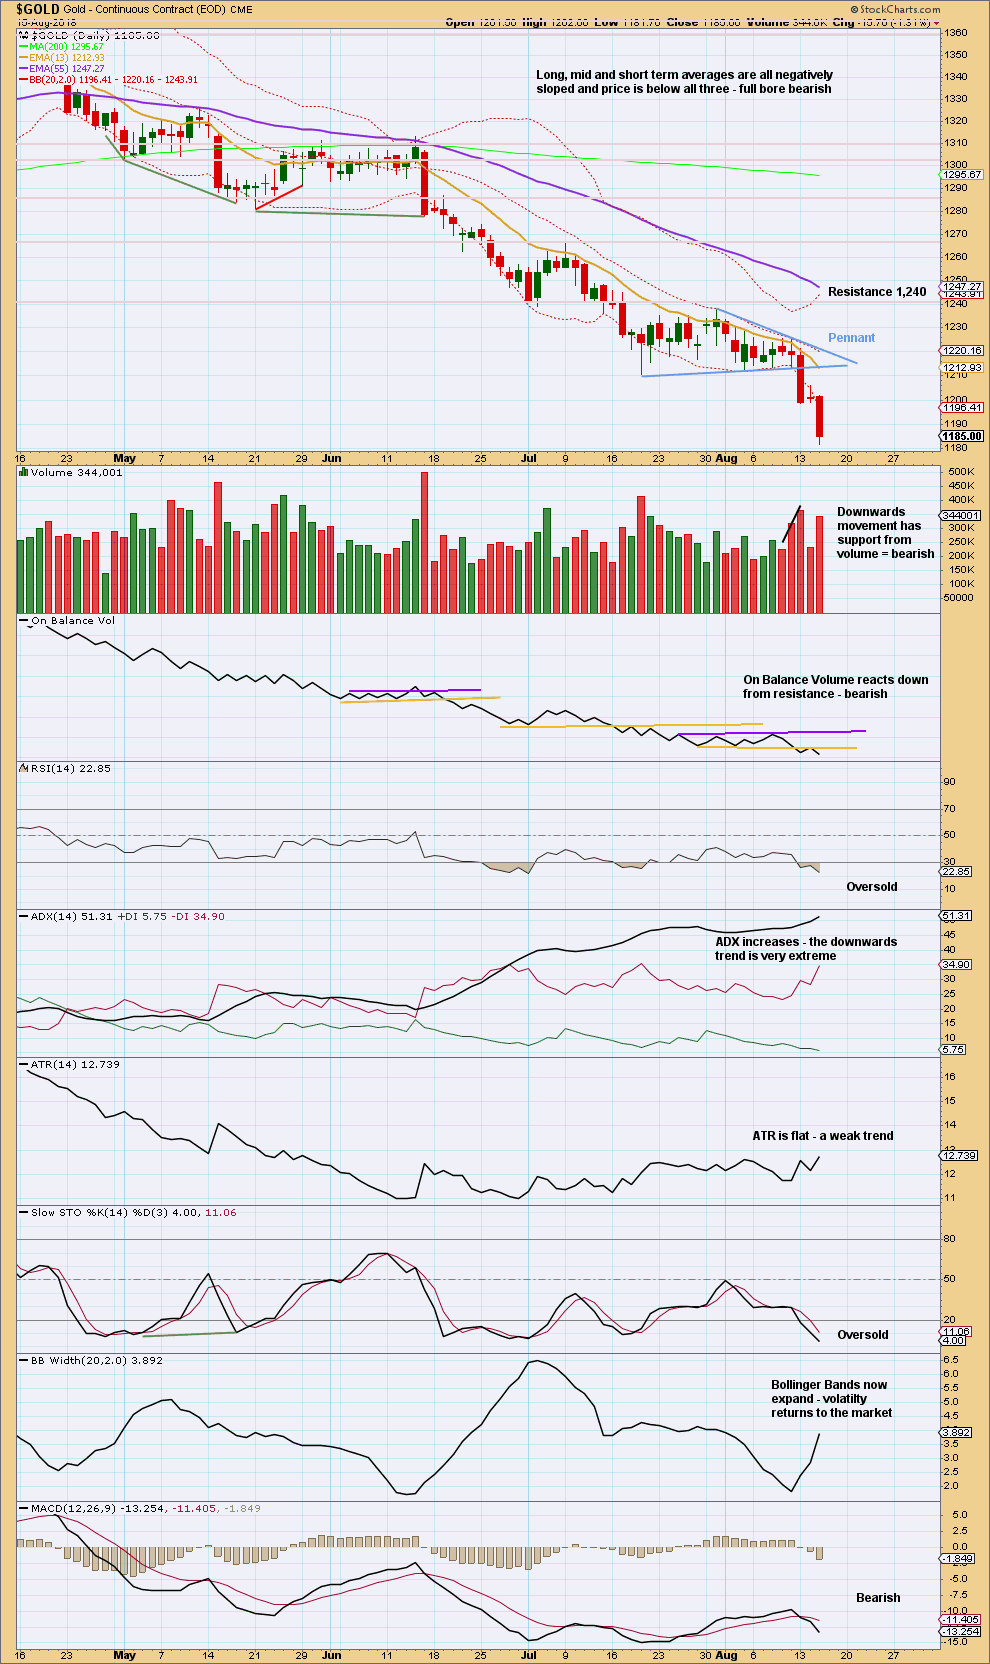
Click chart to enlarge. Chart courtesy of StockCharts.com.
A downwards breakout below the Pennant pattern has support from volume. The target using the length of the flagpole which precedes the Pennant is 1,157. This is still lower than the Elliott wave target, so use this classic target if price keeps on falling through the Elliott wave target.
Support below is now about 1,125.
This trend is still very extreme. Bullish divergence today between price and Stochastics and RSI has today disappeared.
Gold can sustain an extreme trend for a reasonable period of time. Look now for a clear bullish candlestick reversal pattern to indicate it could be over.
At this stage, there is no indication today that this extreme trend is over.
GDX WEEKLY CHART
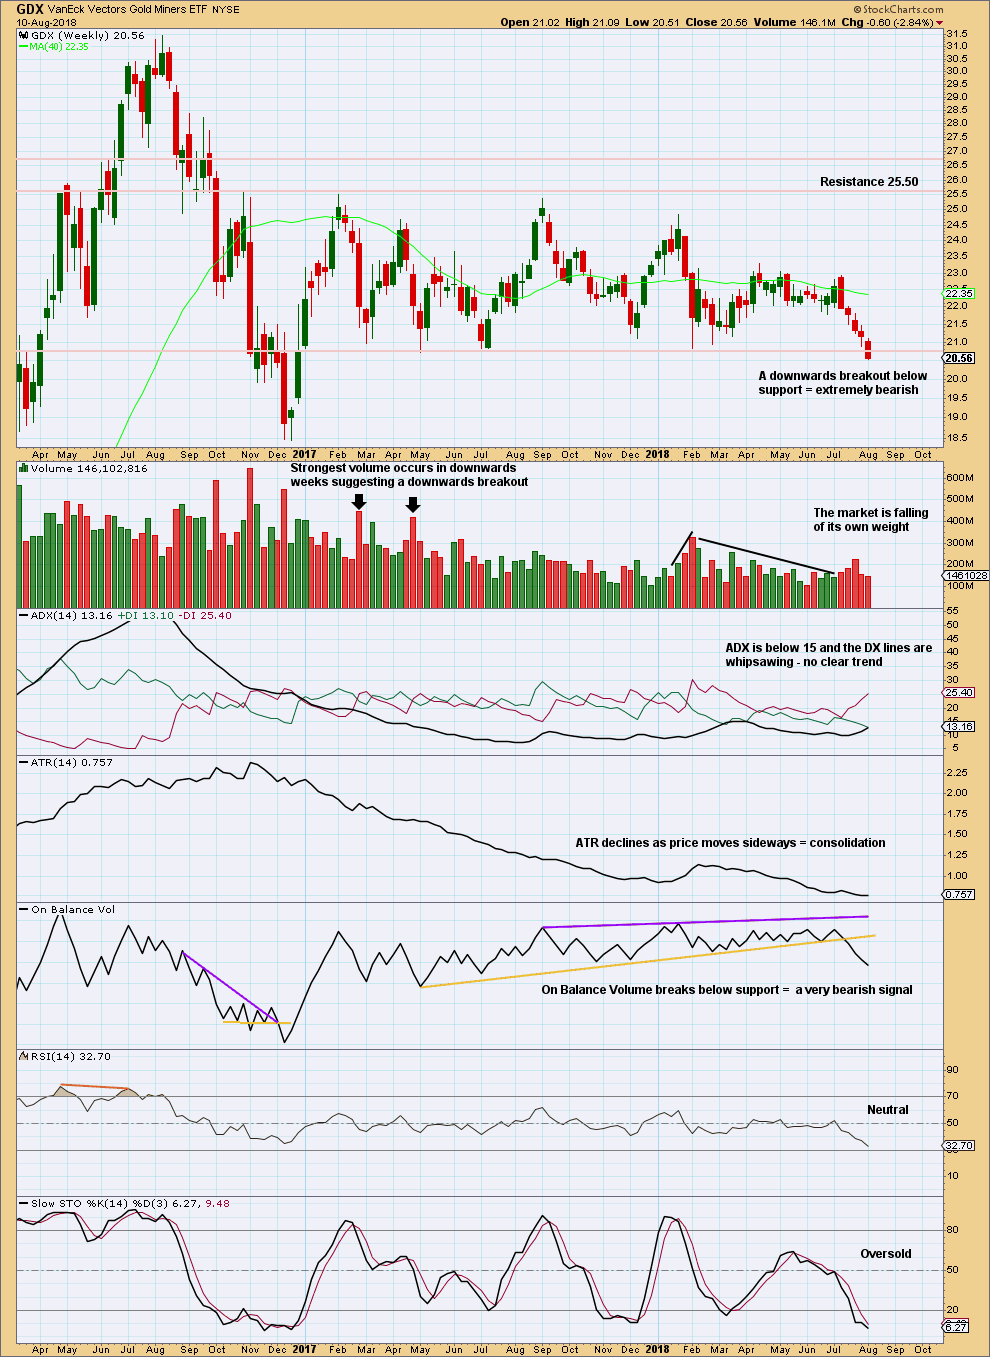
Click chart to enlarge. Chart courtesy of StockCharts.com.
GDX has been range bounce since January 2017. This is a very long sideways consolidation. The longer it continues, the more sustained the eventual breakout will be. Volume suggests the breakout may more likely be downwards.
Price last week closed below support, which was about 20.80. The close this week is the lowest price point for about a year and a half, which is extremely significant. A very long term downwards trend now looks very likely for GDX.
The long term target for the trend is at 16.02.
Next support is about 18.40.
GDX DAILY CHART
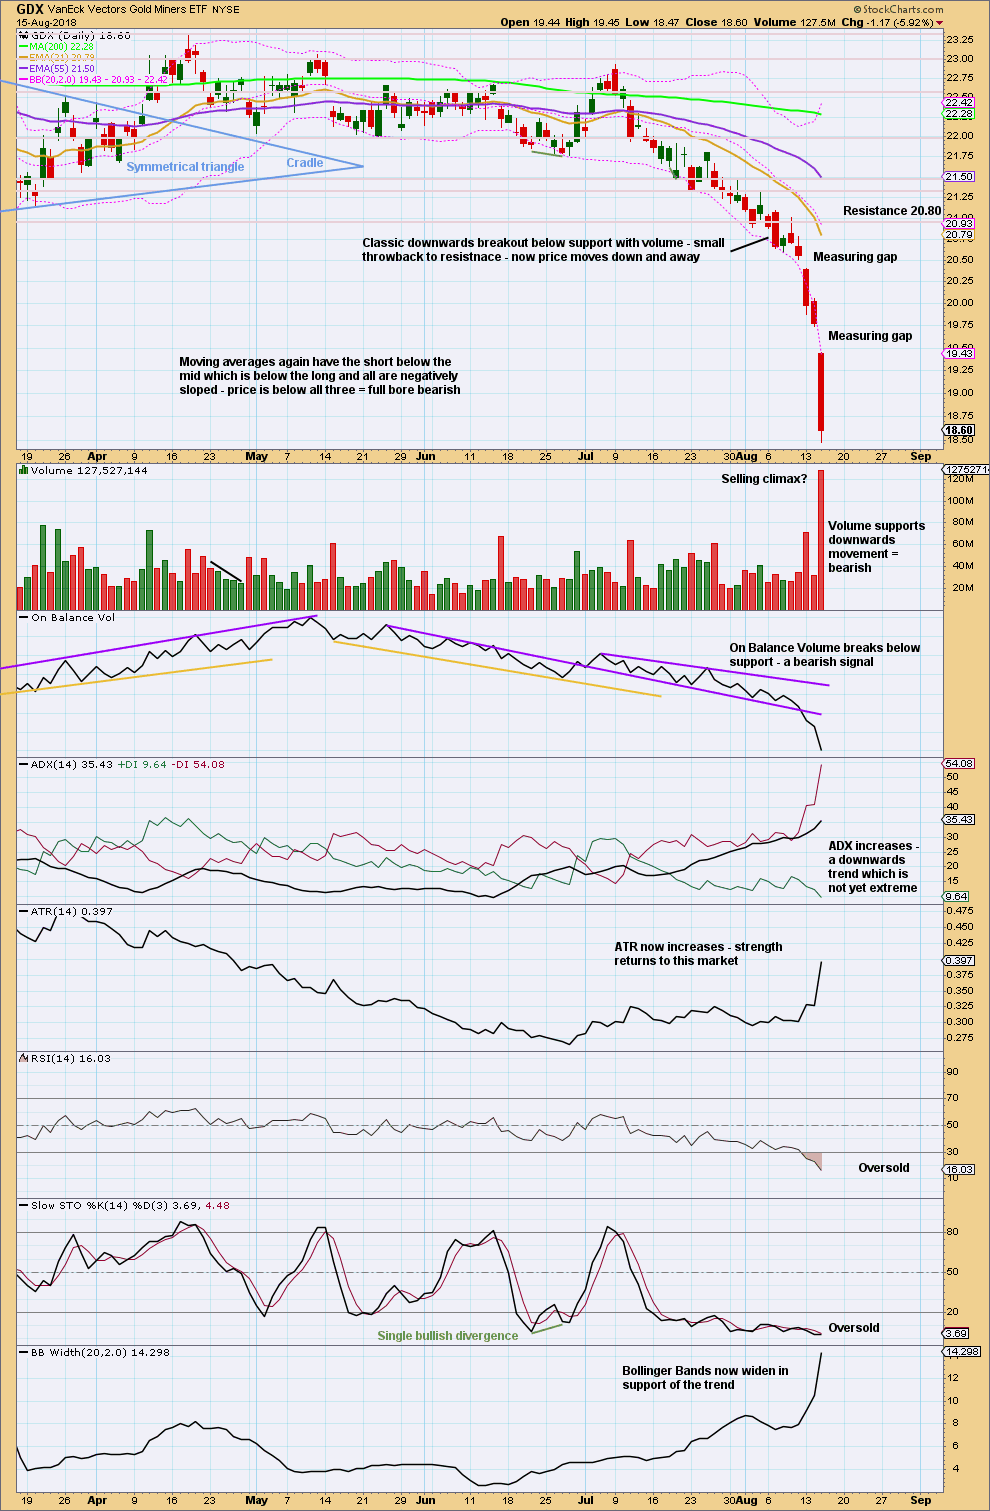
Click chart to enlarge. Chart courtesy of StockCharts.com.
GDX has now closed below support on a strong downwards day with support from volume. New lows are the lowest for GDX since December 2016. This is extremely significant for GDX.
GDX is in a downwards trend. The short term picture now looks bearish.
The last short term target using the last measuring gap was at 19.12, which has now been passed and well exceeded. A new short term target using the next measuring gap would be about 18.17, which is just below.
Please remember to protect your trading accounts by careful risk management. Follow my two Golden Rules:
1. Always trade with stops.
2. Risk only 1-5% of equity on any one trade.
A possible target for this downwards trend to end may be now calculated using the measured rule, giving a target about 16.10.
Published @ 08:55 p.m. EST.
hello Lara….
About the last three GDX counts that you gave us ( on oct 19th 2017) would you say that the only valid count is the first one? And are we on the middle of the third wave down? ….. how low can GDX go ?and for how long ?….. several Years maybe?
if this is the case…… then Gold is most likely going lower…..
Is there any possibility Now.. …… given the actual breakdown of the last low….for a bullish count on GDX?
Thank you…..
Thank you.
Hourly chart updated:
I have not adjusted the Elliott channel even though it looks like minute iii ended a little lower, because the upper edge nicely shows still where today’s upwards movement found resistance, so that looks right
the EW target is exceeded, so now use the classic target.
Lara: “The target remains at 1,166.
After new lows, if price turns up very strongly and breaks clearly above the upper edge of this narrow pink Elliott channel, that shall be the earliest indication of a low then in place.”
Gold is trading at 1179.7 after making low of 1160.
wave D must be over. Shorts watch out??
Lara, with the increase in volume, isn’t it possible that today’s gap in GDX is an exhaustion gap that will likely get filled soon?
Also possible.
IMO it’s best to assume it’s a measuring gap, until proven otherwise.
As soon as we can see some kind of candlestick reversal pattern for GDX, or at least a very long lower wick, I think it’s safest to assume that the downwards trend is most likely to continue.
Come on, gold, it’s time to form a very long hammer! If the low sticks, the beginning of the short squeeze should be very brutal! Short should cover here imho.
Keep going up, gold! I wanna see a meaningful hammer! Lol