
A new low invalidates the main daily Elliott wave count and confirms the alternate. A new target is calculated.
Summary: Expect now more downwards movement to a target at 1,196 with a limit at 1,194.52.
A classic analysis target is about 1,160.
Always trade with stops to protect your account. Risk only 1-5% of equity on any one trade.
New updates to this analysis are in bold.
Grand SuperCycle analysis is here.
Last historic analysis with monthly charts and several weekly alternates is here, video is here.
Last remaining four weekly wave counts were updated here, and video here.
MAIN ELLIOTT WAVE COUNT
WEEKLY CHART – TRIANGLE
Click chart to enlarge.
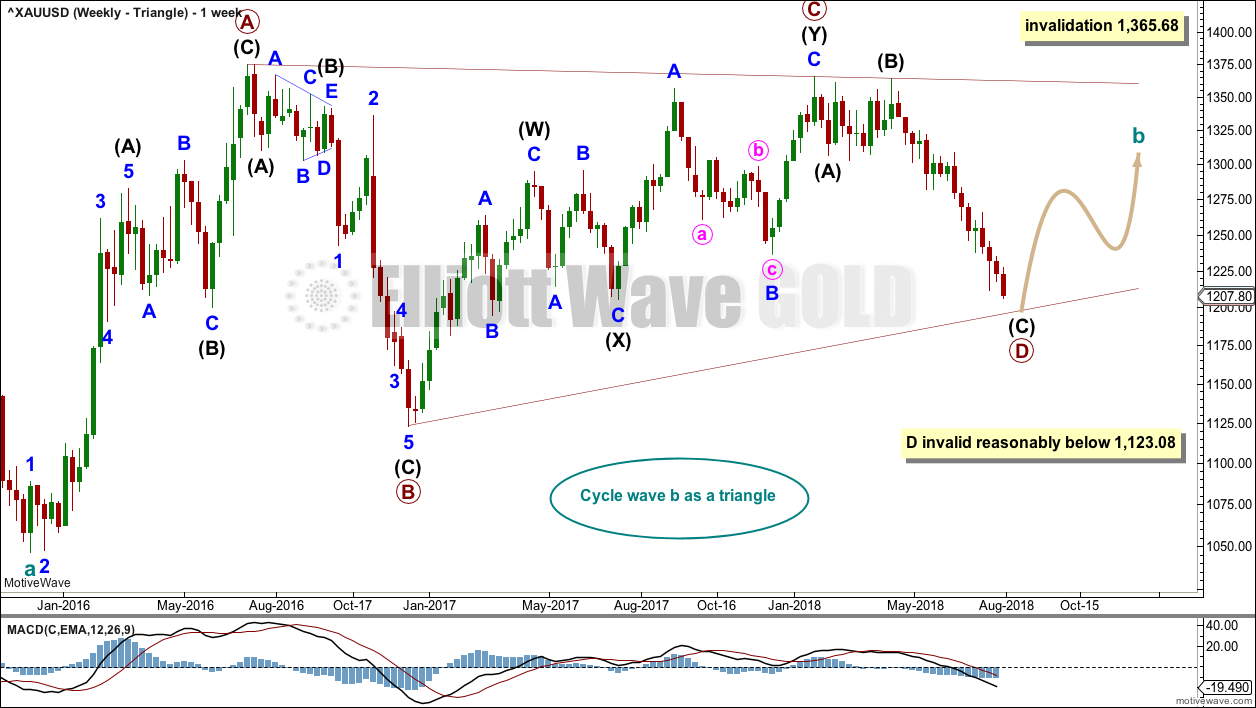
There are four remaining weekly wave counts at this time for cycle wave b: a triangle, flat, combination or double zigzag. At this stage, all four expect a bounce over the next few weeks, and the triangle has the best look.
While the direction does not diverge for these four weekly wave counts, only one weekly wave count shall be published on a daily basis, so that the analysis is manageable for me to publish and for members to digest. Note: This does not mean that the remaining three counts may not be correct.
The triangle so far has the best fit and look.
Cycle wave b may be an incomplete triangle. The triangle may be a contracting or barrier triangle, with a contracting triangle looking much more likely because the A-C trend line does not have a strong slope. A contracting triangle could see the B-D trend line have a stronger slope, so that the triangle trend lines converge at a reasonable rate. A barrier triangle would have a B-D trend line that would be essentially flat, and the triangle trend lines would barely converge.
Within a contracting triangle, primary wave D may not move beyond the end of primary wave B below 1,123.08. Within a barrier triangle, primary wave D may end about the same level as primary wave B at 1,123.08, so that the B-D trend line is essentially flat. Only a new low reasonably below 1,123.08 would invalidate the triangle.
Within both a contracting and barrier triangle, primary wave E may not move beyond the end of primary wave C above 1,365.68.
Four of the five sub-waves of a triangle must be zigzags, with only one sub-wave allowed to be a multiple zigzag. Primary wave C is the most common sub-wave to subdivide as a multiple, and this is how primary wave C for this example fits best.
Primary wave D must be a single structure, most likely a zigzag.
There are no problems in terms of subdivisions or rare structures for this wave count. It has an excellent fit and so far a typical look.
DAILY CHART – TRIANGLE
Click chart to enlarge.
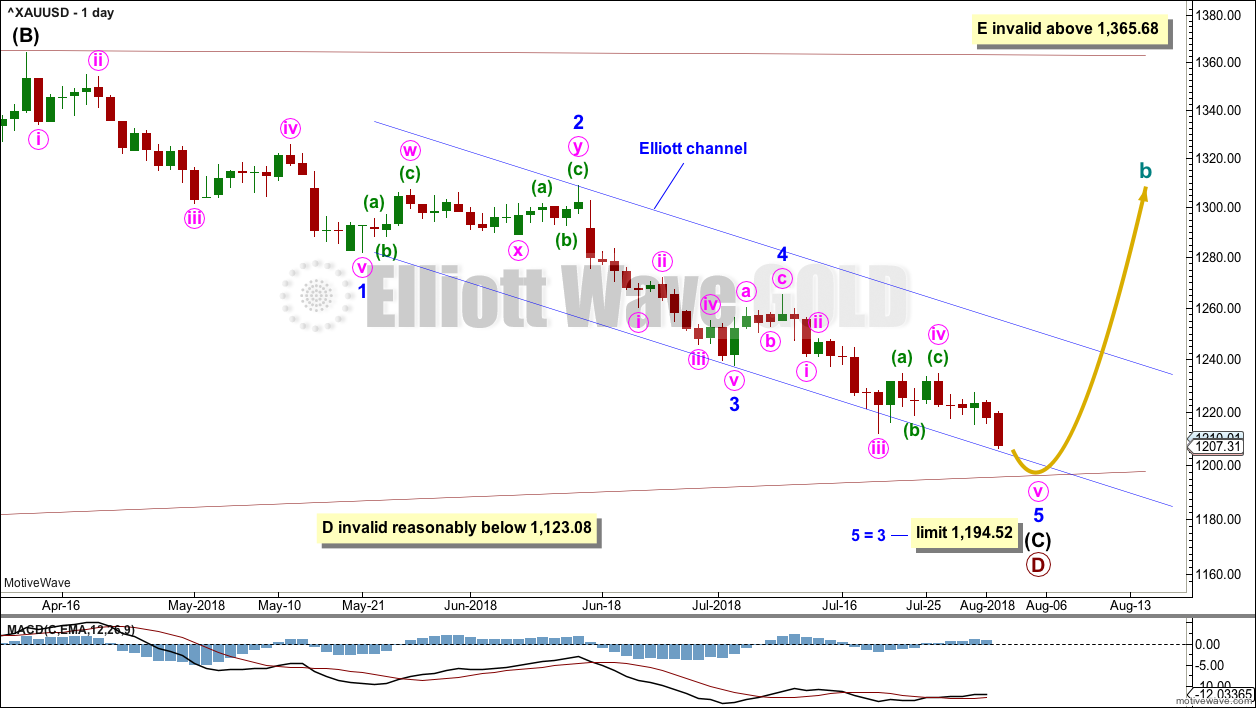
Primary wave D is not over.
Within the impulse of intermediate wave (C), minor wave 3 is shorter than minor wave 1. Therefore, minor wave 5 is limited to no longer than equality in length with minor wave 3, so that the core rule stating a third wave may not be the shortest wave would be met.
Minor wave 5 may be incomplete, and within it minute wave iv may now be a complete zigzag.
At the end of last week, On Balance Volume has made new lows at both the daily and weekly time frames, which when combined is a very bearish signal.
HOURLY CHART
Click chart to enlarge.
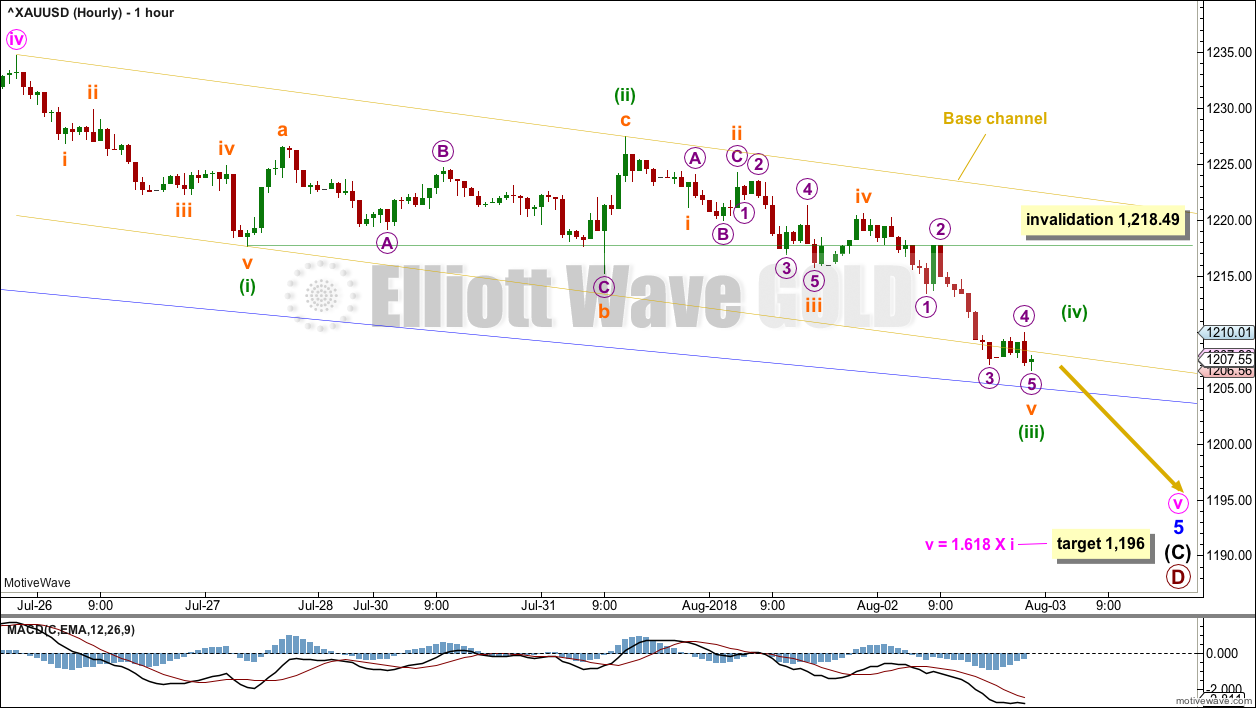
The hourly chart shows all of the structure of minor wave 5, which is unfolding as an impulse.
Within the impulse, minuette waves (i), (ii) and (iii) may now be complete. Some sideways movement now for minuette wave (iv) may be expected, which may not move into minuette wave (i) price territory above 1,218.49.
When minuette wave (iv) is complete, then a final wave down towards the target should be expected.
TECHNICAL ANALYSIS
WEEKLY CHART
Click chart to enlarge. Chart courtesy of StockCharts.com.
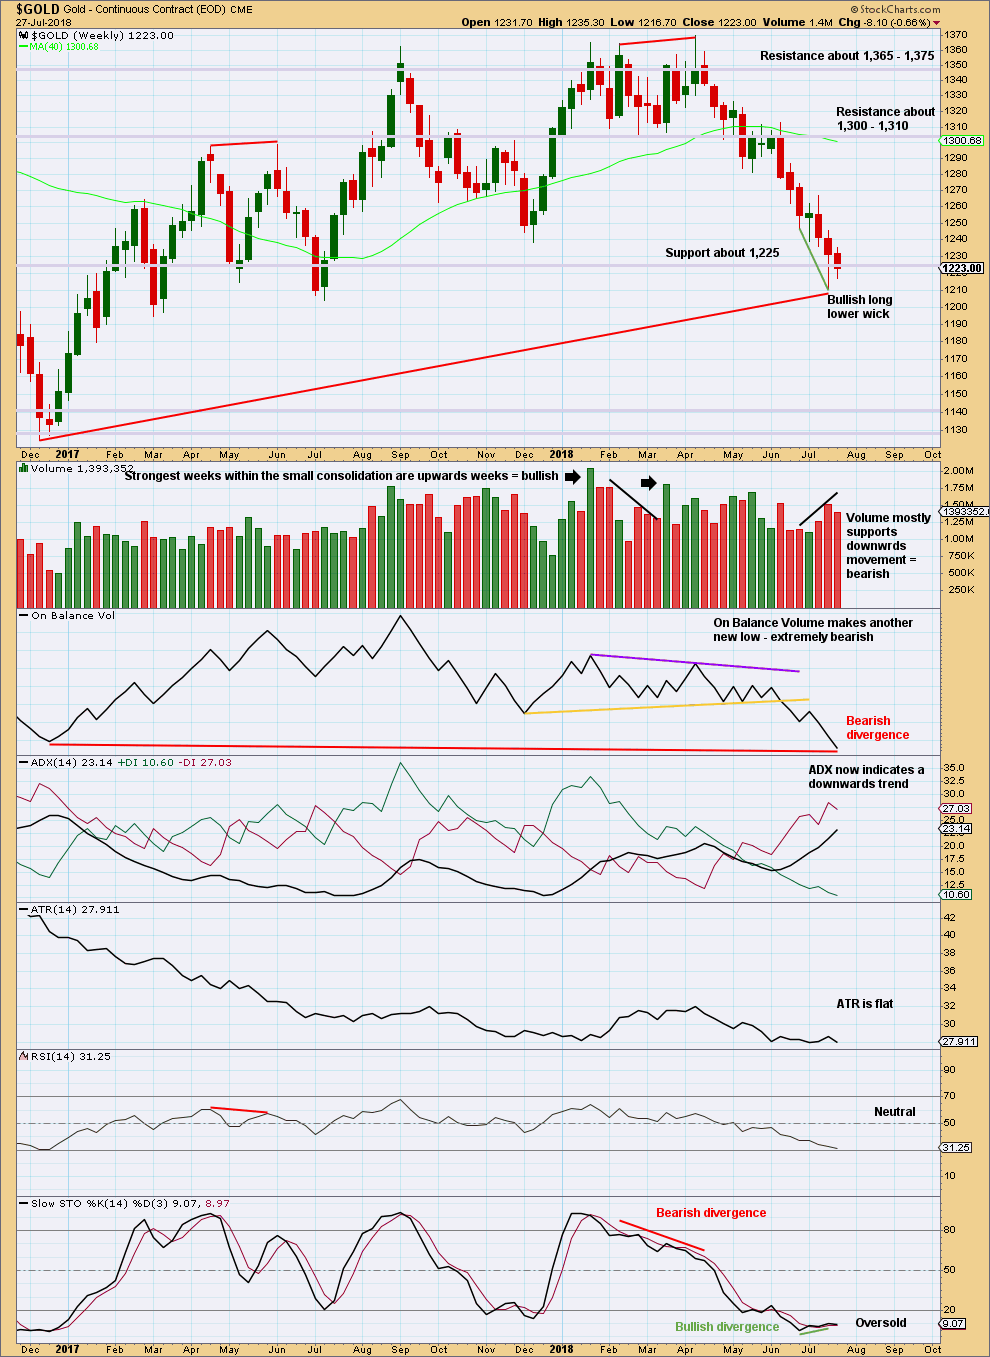
On Balance Volume last week makes another new low. This new low is below the prior low of the week beginning 12th of December, 2016. This divergence is bearish.
Slightly lighter volume for an inside week is very slightly bullish for the short term.
DAILY CHART
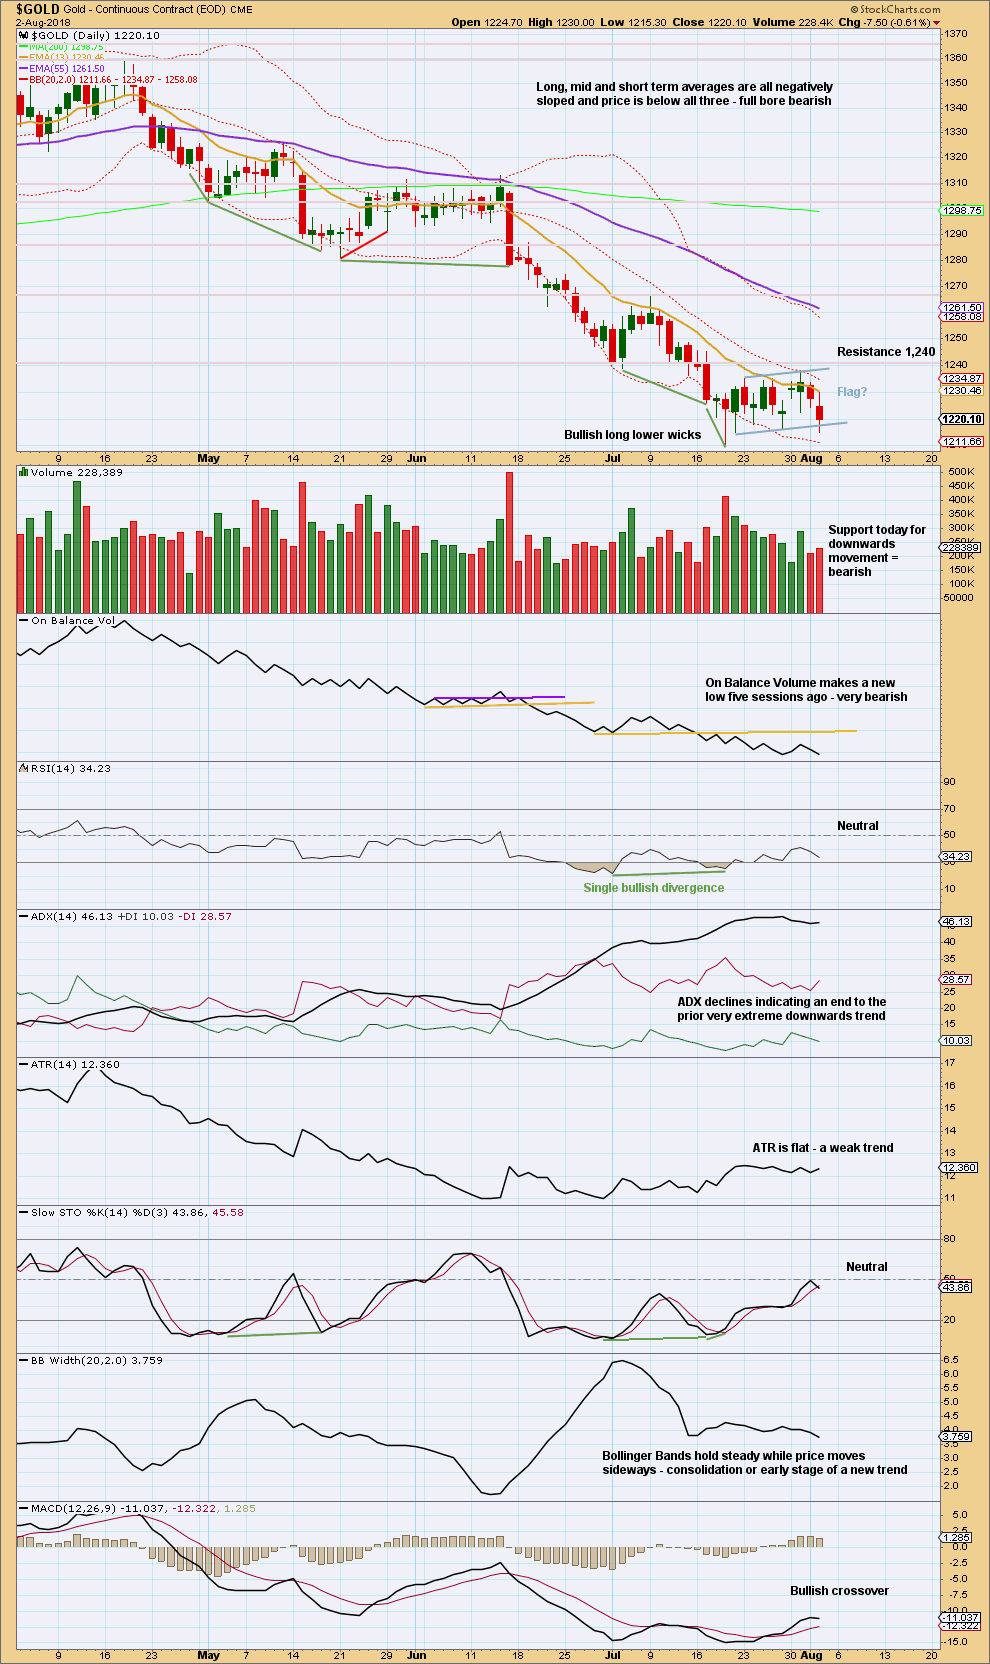
Click chart to enlarge. Chart courtesy of StockCharts.com.
A flag pattern may now be forming; these are reliable continuation patterns. Volume during the pattern though is strongest for an upwards day, contradicting the continuation implications of the pattern. A downwards breakout from the flat pattern has occurred after the New York session has closed today (StockCharts data is New York session only).
A target calculated from the flag pattern is at 1,162.
GDX WEEKLY CHART
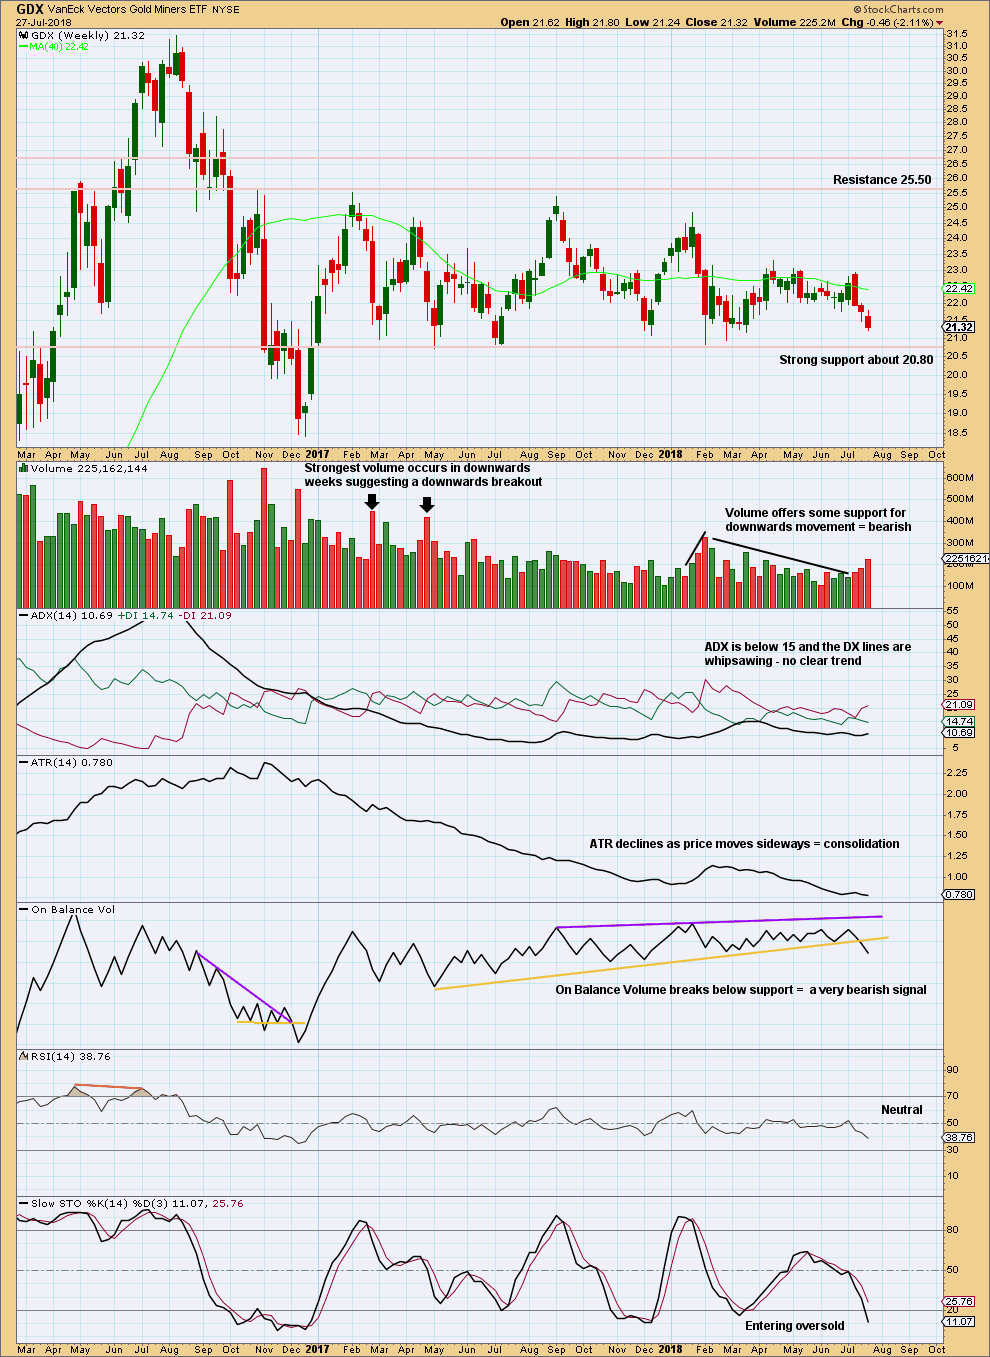
Click chart to enlarge. Chart courtesy of StockCharts.com.
GDX has been range bounce since January 2017. This is a very long sideways consolidation. The longer it continues, the more sustained the eventual breakout will be. Volume suggests the breakout may more likely be downwards.
Support about 20.80 has been tested about eight times and so far has held. The more often a support area is tested and holds, the more technical significance it has.
With a very bearish signal now from On Balance Volume and support from volume for falling price, look out not only for a test (again) of support about 20.80 but also for a possible break below this point. A close below 20.80 would be extremely bearish. Expect then to see GDX likely to continue in a strong downwards trend to new lows that may last over a year.
GDX DAILY CHART
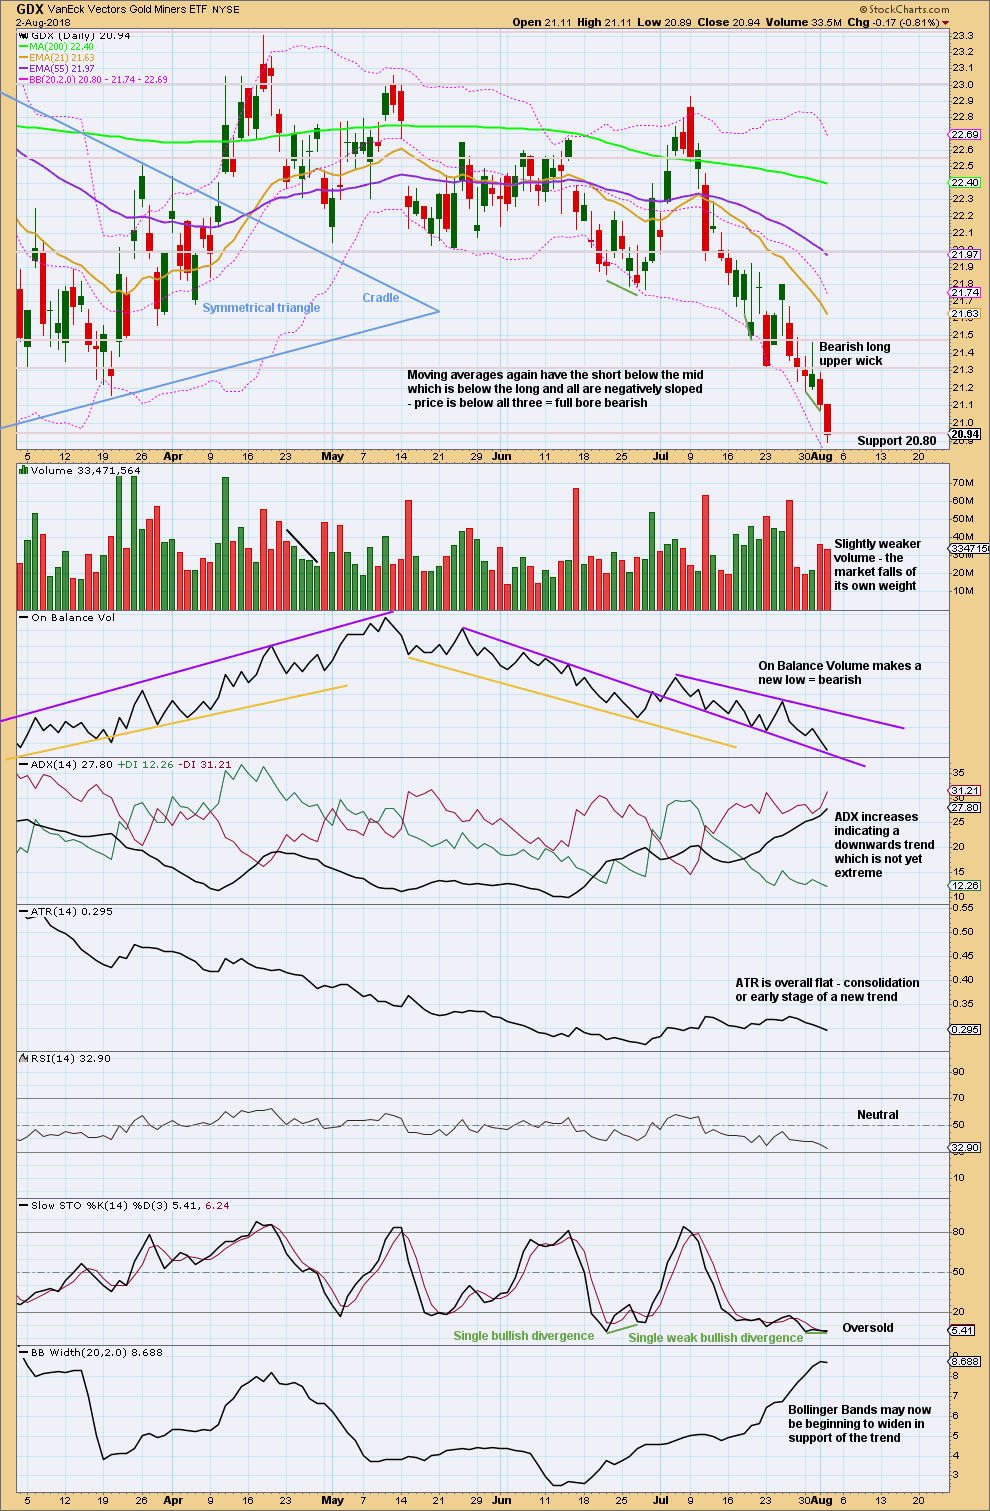
Click chart to enlarge. Chart courtesy of StockCharts.com.
Stochastics may remain oversold for reasonable periods of time during a trend. Currently, this market is trending downwards.
Price is now at support about 20.95. Below that look for very strong support about 20.80.
Published @ 11:12 p.m. EST.
It looks very much like a low is in place, and the target at 1,196 was too low. Invalidation of the hourly chart indicates the last wave down should be over.
This upwards bounce is extremely strong. If it has support from volume that would be very bullish.
Yippee 😀🙃😍
IKR! Finally!
this wave down was really hard.
I’m know you don’t agree with this method, due to the lack of a consistent negative correlation, but I found watching the $USD helpful. Once I identified the ending diagonal was near completion it seemed to fit well with your gold count.
I have an updated GDX count that I’ll share later. I believe it bottomed yesterday.
Dreamer, I agree with you. Sry, Lara.
Lara, you’ve now labeled Minute 4 as a sideways Combination, ZigZag – X – Expanded Flat. Is it normal in a sideways move for the Y wave to be so much “smaller” than the W wave and there be such a large distance between the end of Y and the end of W? Thanks,