
Downwards movement continued a little further as the main Elliott wave count expected, but fell 8.69 short of the target.
Summary: A low may again be in place. Confidence may be had with a new high above 1,265.59.
A target for a strong bounce here is about 1,304, which may be reached in several weeks. Along the way up, there may be either a sharp pullback or a sideways time consuming consolidation.
Always trade with stops to protect your account. Risk only 1-5% of equity on any one trade.
New updates to this analysis are in bold.
Grand SuperCycle analysis is here.
Last historic analysis with monthly charts and several weekly alternates is here, video is here.
MAIN ELLIOTT WAVE COUNT
WEEKLY CHART – TRIANGLE
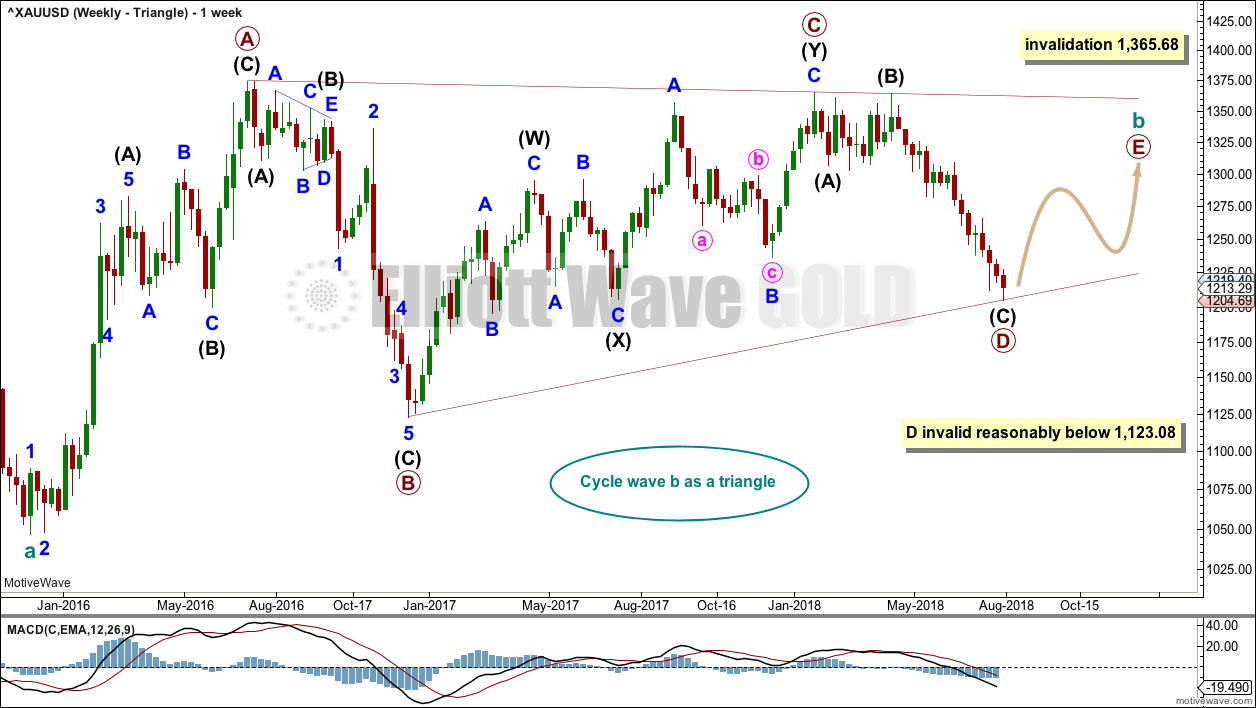
Click chart to enlarge.
There are four remaining weekly wave counts at this time for cycle wave b: a triangle, flat, combination or double zigzag. All four weekly charts will be reviewed in this analysis.
While the direction does not diverge for these four weekly wave counts, only one weekly wave count shall be published on a daily basis, so that the analysis is manageable for me to publish and for members to digest. Note: This does not mean that the remaining three counts may not be correct.
The triangle so far has the best fit and look.
Cycle wave b may be an incomplete triangle. The triangle may be a contracting or barrier triangle, with a contracting triangle looking much more likely because the A-C trend line does not have a strong slope. A contracting triangle could see the B-D trend line have a stronger slope, so that the triangle trend lines converge at a reasonable rate. A barrier triangle would have a B-D trend line that would be essentially flat, and the triangle trend lines would barely converge.
Within a contracting triangle, primary wave D may not move beyond the end of primary wave B below 1,123.08. Within a barrier triangle, primary wave D may end about the same level as primary wave B at 1,123.08, so that the B-D trend line is essentially flat. Only a new low reasonably below 1,123.08 would invalidate the triangle.
Within both a contracting and barrier triangle, primary wave E may not move beyond the end of primary wave C above 1,365.68.
Four of the five sub-waves of a triangle must be zigzags, with only one sub-wave allowed to be a multiple zigzag. Primary wave C is the most common sub-wave to subdivide as a multiple, and this is how primary wave C for this example fits best.
Primary wave D must be a single structure, most likely a zigzag.
There are no problems in terms of subdivisions or rare structures for this wave count. It has an excellent fit and so far a typical look.
DAILY CHART – TRIANGLE
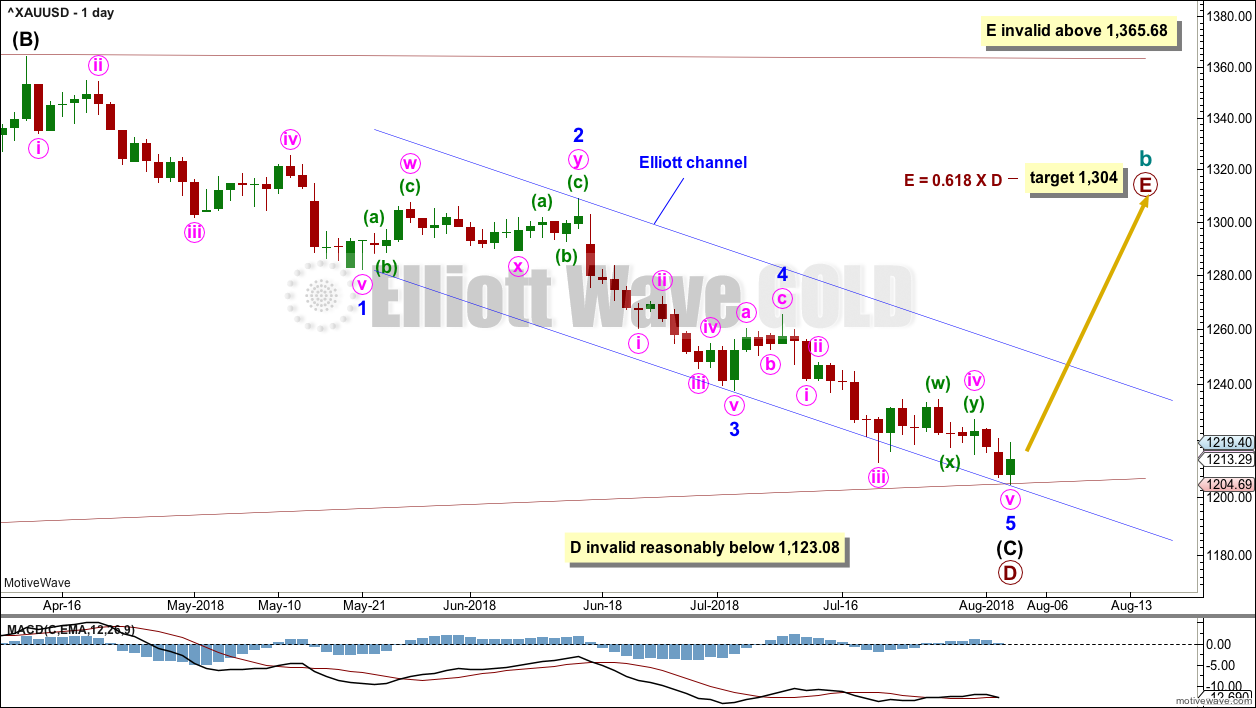
Click chart to enlarge.
Primary wave D may again be over at the end of this week. The structure may again be complete at all wave degrees.
Minor wave 5 may have ended almost exactly at the lower edge of the blue Elliott channel.
A target is calculated for primary wave E to end. Primary wave E must subdivide as a zigzag. It may last several weeks.
HOURLY CHART
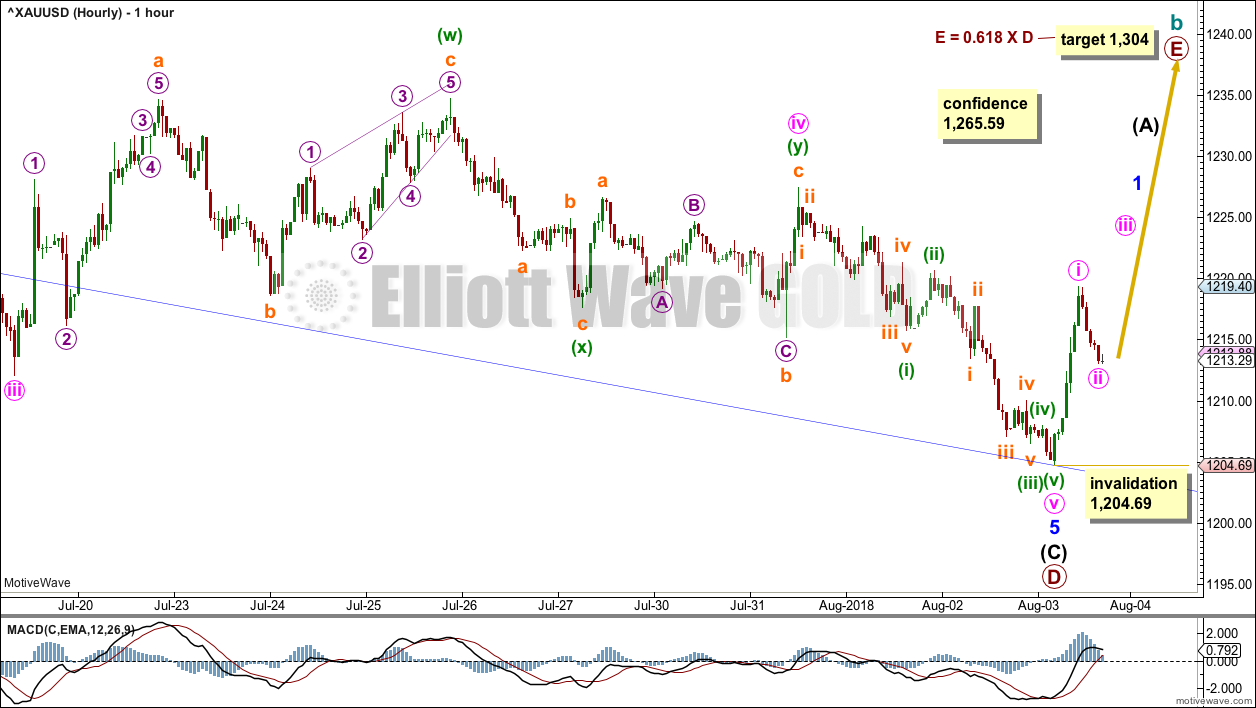
Click chart to enlarge.
Minute wave iv may have been a double combination. Minute wave v is a complete impulse.
The bounce up during Friday’s session is very strong and has good support from volume.
Within a new upwards trend, minute wave ii may not move beyond the start of minute wave i below 1,204.69.
A new high above the start of minor wave 5 at 1,265.59 would add confidence that a low is in place. At that stage, upwards movement may not be a correction within minor wave 5, so at that stage minor wave 5 would have to be over.
WEEKLY CHART – FLAT
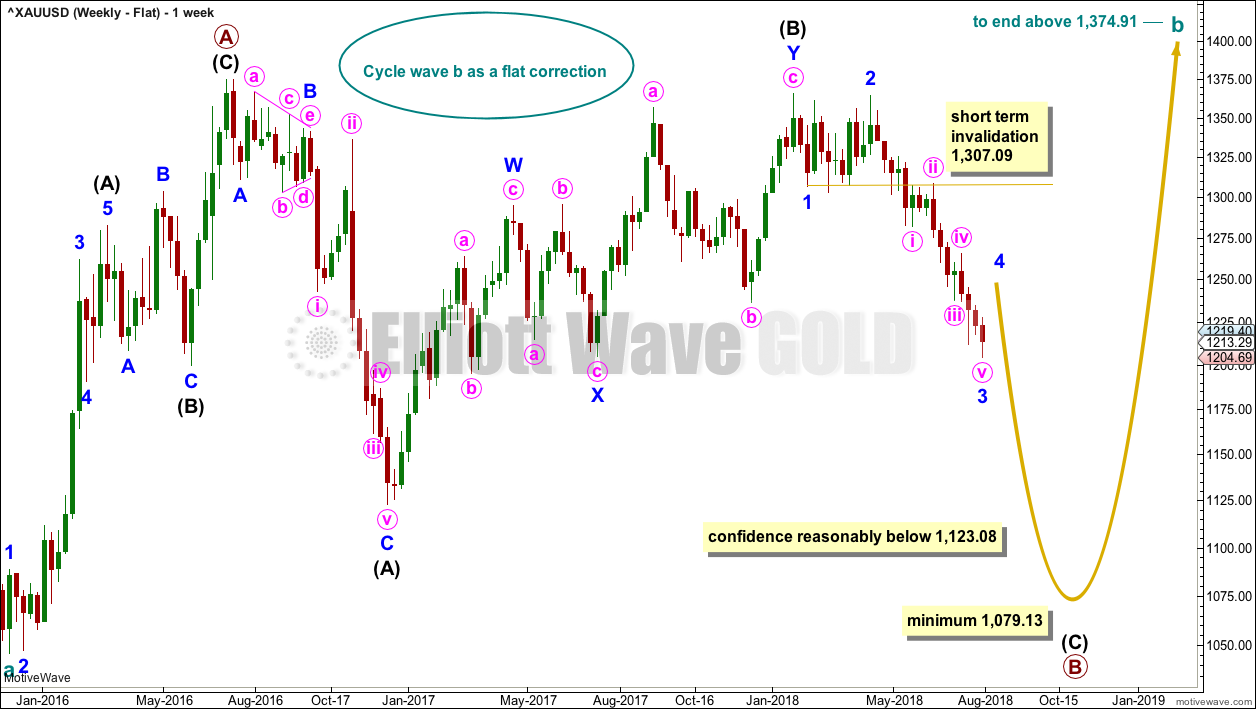
Click chart to enlarge.
It is possible that cycle wave b may be a flat correction. Within a flat correction, primary wave B must retrace a minimum 0.9 length of primary wave A at 1,079.13 or below. Primary wave B may make a new low below the start of primary wave A at 1,046.27 as in an expanded flat correction.
Only a new low reasonably below 1,123.08 would provide reasonable confidence in this wave count.
Intermediate wave (C) must subdivide as a five wave structure; it may be unfolding as an impulse. Within the impulse, minor waves 1, 2 and now 3 may be complete and minor wave 4 may not move into minor wave 1 price territory above 1,307.09.
Minor wave 2 was a double zigzag lasting nine weeks. To exhibit alternation and reasonable proportion minor wave 4 may be a flat, combination or triangle and may last a little longer than nine weeks as these types of corrections tend to be longer lasting than zigzags or zigzag multiples.
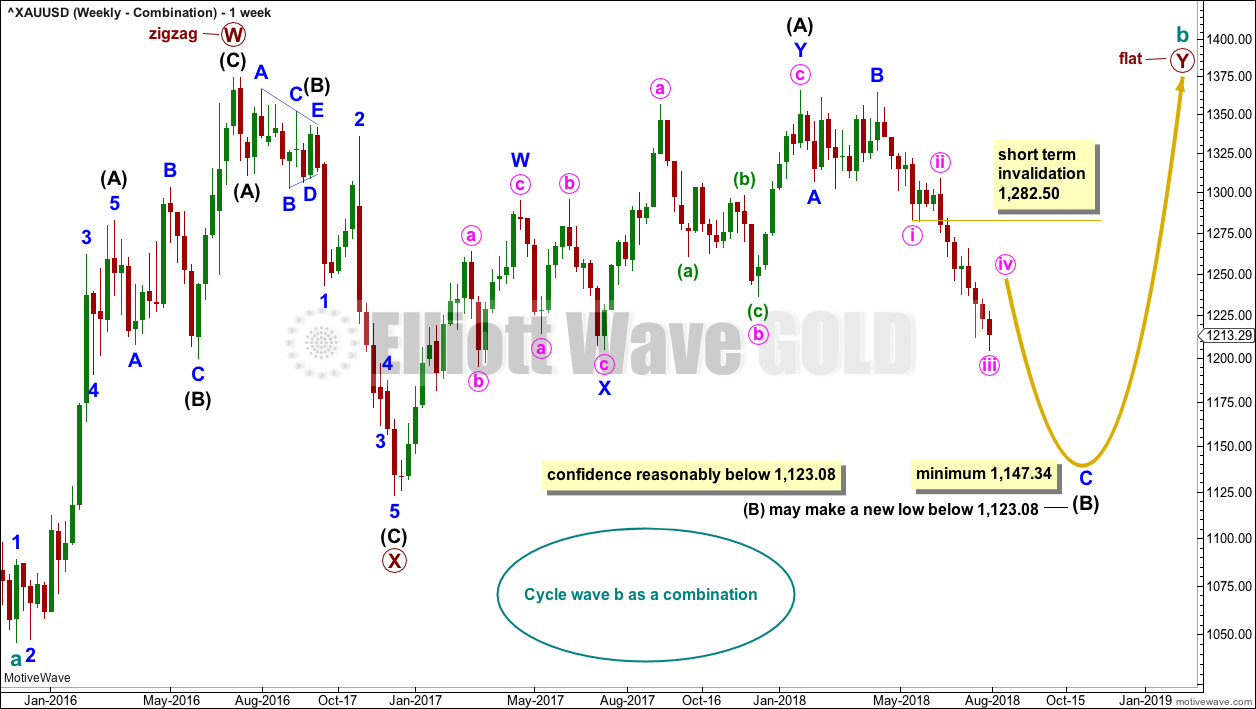
WEEKLY CHART – COMBINATION
Click chart to enlarge.
It is essential when a triangle is considered to always consider alternates. Too many times over the years I have labelled a triangle as unfolding or even complete, only for it to be invalidated and the structure turning out to be something else.
When a triangle is invalidated, then the most common structure the correction turns out to be is a combination.
If cycle wave b is a combination, then the first structure in a double may be a complete zigzag labelled primary wave W.
The double may be joined by a three in the opposite direction, a zigzag labelled primary wave X.
The second structure in the double may be a flat correction labelled primary wave Y. It may also be a triangle, but that would expect essentially the same movement as the weekly triangle chart and so shall not yet be considered while there is no divergence in the expected pathway for price.
Within a flat correction for primary wave Y, the current downwards wave of intermediate wave (B) may be a single or multiple zigzag; for now it shall be labelled as a single. Intermediate wave (B) must retrace a minimum 0.9 length of intermediate wave (A) at 1,147.34. Intermediate wave (B) may move beyond the start of intermediate wave (A) as in an expanded flat.
Within the zigzag of intermediate wave (B), minor waves A and B may be complete. Minor wave C must subdivide as a five wave structure; at this stage, it may be an incomplete impulse. Within minor wave C, minute waves i and ii and now iii may be complete. Minute wave iv may not move into minute wave i price territory above 1,282.50.
When intermediate wave (B) is complete, then intermediate wave (C) would be expected to make at least a slight new high above the end of intermediate wave (A) at 1,365.68 to avoid a truncation. Primary wave Y would be most likely to end about the same level as primary wave W at 1,374.91, so that the whole structure takes up time and moves price sideways, as that is the purpose of double combinations.
While double combinations are very common, triples are extremely rare. When the second structure in a double is complete, then it is extremely likely that the whole correction is over.
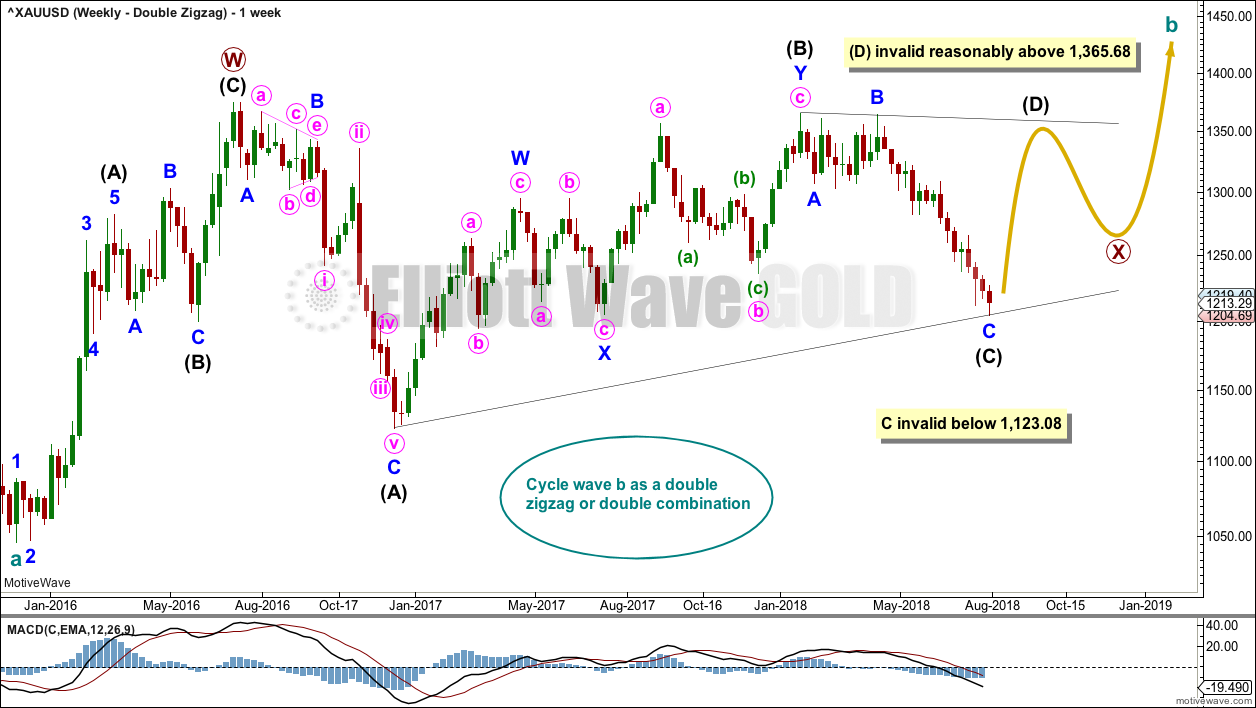
WEEKLY CHART – DOUBLE ZIGZAG
Click chart to enlarge.
Finally, it is also possible that cycle wave b may be a double zigzag or a double combination.
The first zigzag in the double is labelled primary wave W. This has a good fit.
The double may be joined by a corrective structure in the opposite direction, a triangle labelled primary wave X. The triangle would be only a little over halfway through.
Within the triangle of primary wave X, intermediate wave (C) may now be complete. If it continues any lower, then it may not move beyond the end of intermediate wave (A) below 1,123.08.
This wave count may now expect choppy overlapping movement in an ever decreasing range for several more months. After the triangle is complete, then an upwards breakout would be expected from it.
Primary wave Y would most likely be a zigzag because primary wave X would be shallow; double zigzags normally have relatively shallow X waves.
Primary wave Y may also be a flat correction if cycle wave b is a double combination, but combinations normally have deep X waves. This would be less likely.
This wave count has good proportions and no problems in terms of subdivisions.
TECHNICAL ANALYSIS
WEEKLY CHART
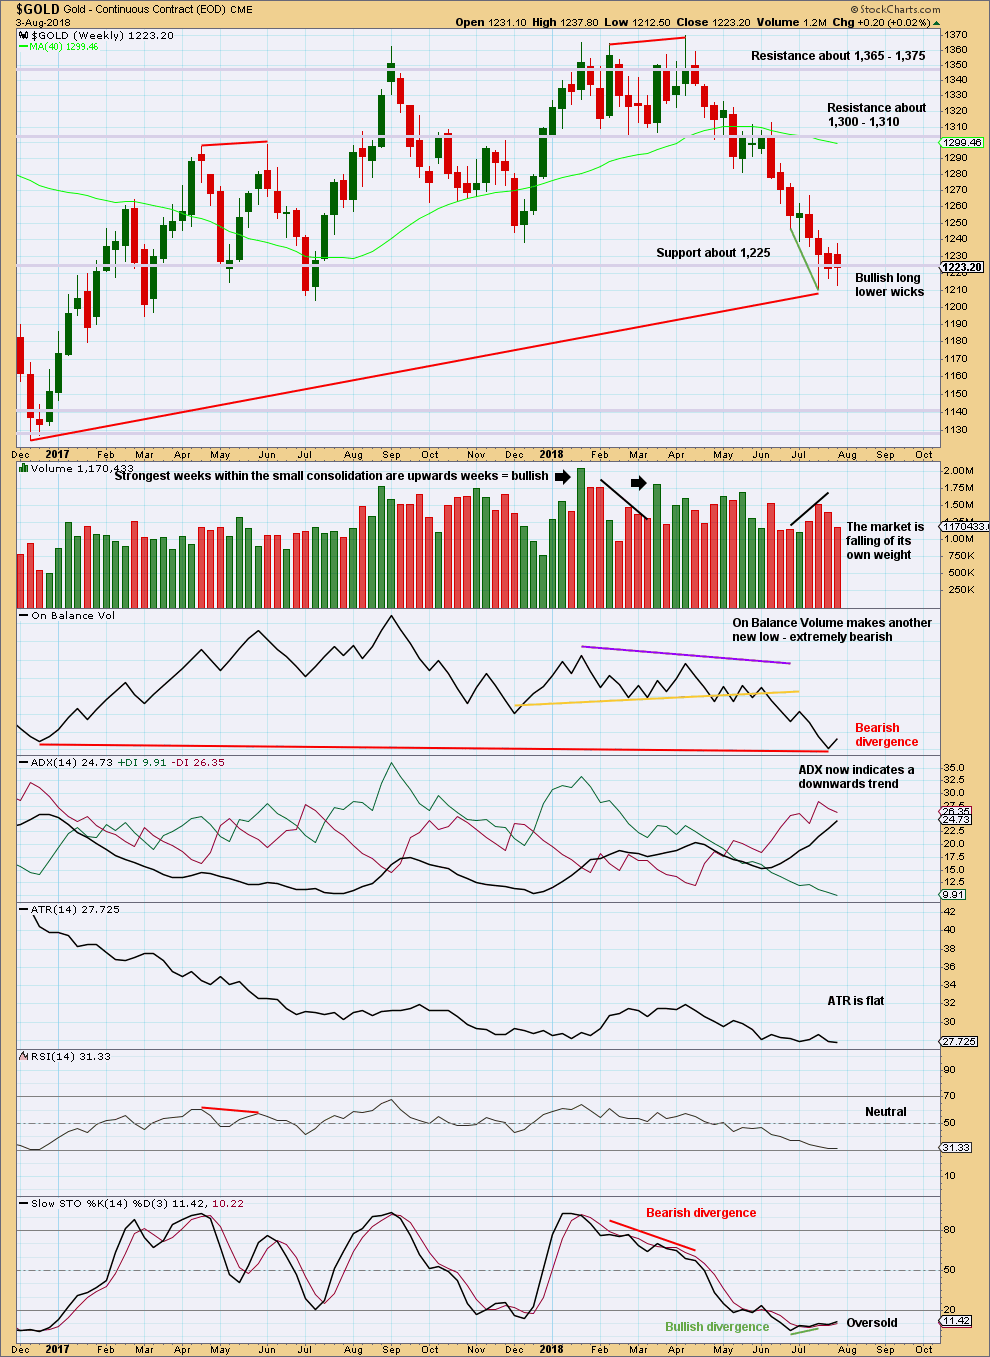
Click chart to enlarge. Chart courtesy of StockCharts.com.
At the end of this week, BarChart data has made a new low but StockCharts data has not.
The long term picture for this chart is bearish due to the long term bearish divergence between price and On Balance Volume. The short term is bullish due to long lower candlestick wicks and single short term divergence between price and Stochastics at last lows.
DAILY CHART
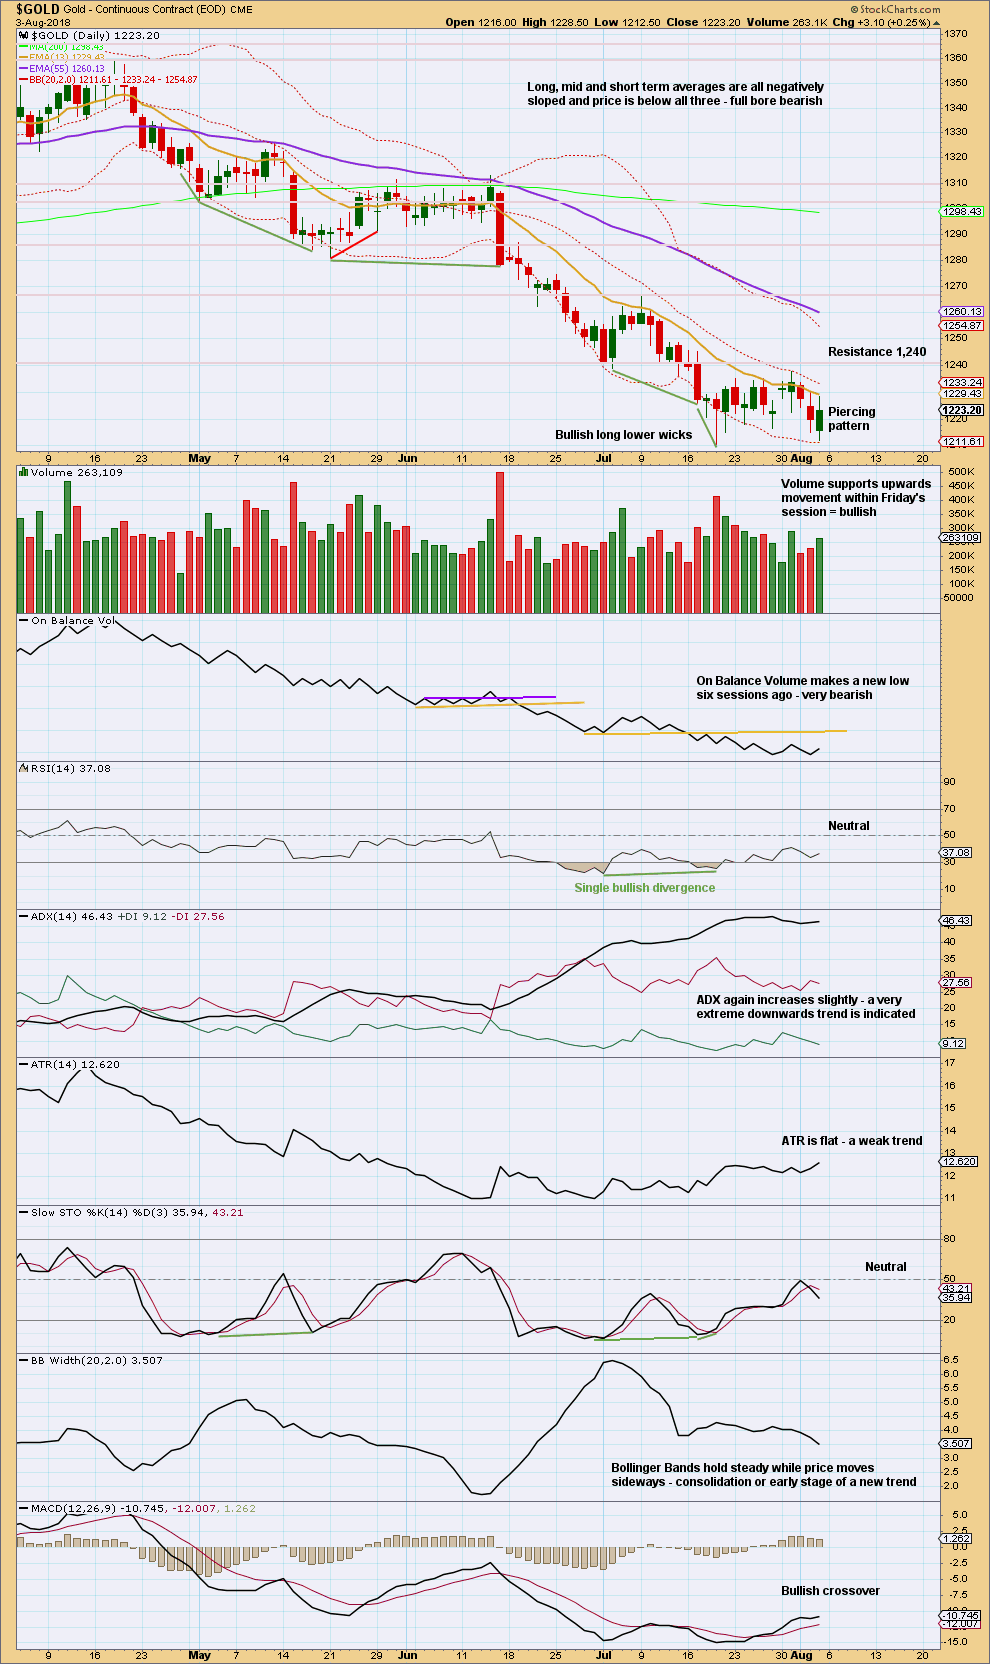
Click chart to enlarge. Chart courtesy of StockCharts.com.
While yesterday it looked like a downwards breakout from a flag pattern may have been underway, the flag pattern is today no longer evident and a downwards breakout has not happened. Friday’s session has closed back into what would be a flag pattern, finding no resistance at the lower edge. That does not look right for a downwards breakout.
Friday’s candlestick is fairly bullish.
GDX WEEKLY CHART
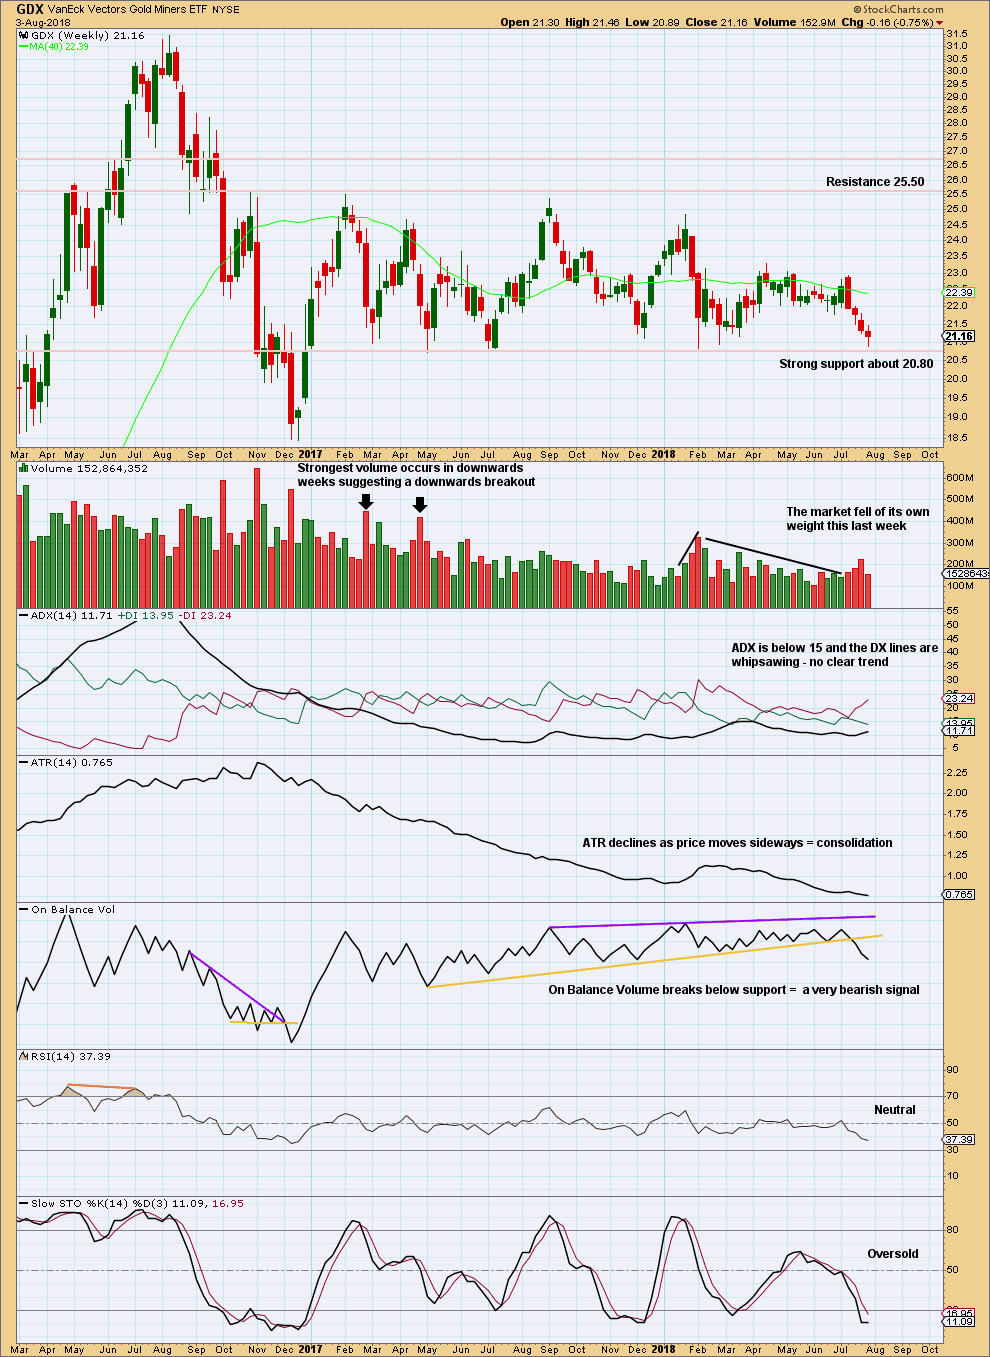
Click chart to enlarge. Chart courtesy of StockCharts.com.
GDX has been range bounce since January 2017. This is a very long sideways consolidation. The longer it continues, the more sustained the eventual breakout will be. Volume suggests the breakout may more likely be downwards.
Support about 20.80 has been tested about eight times and so far has held. The more often a support area is tested and holds, the more technical significance it has.
Price is now almost at support about 20.80. Stochastics is now oversold. Normally, it would be reasonable to expect that downwards movement may end here and an upwards swing may develop. But the very bearish signal from On Balance Volume suggests a downwards breakout may be about to happen.
A downwards breakout would require a close below support. If it has support from volume, it would be very bearish; but that is not necessary for a downwards breakout, because the market may fall of its own weight.
GDX DAILY CHART
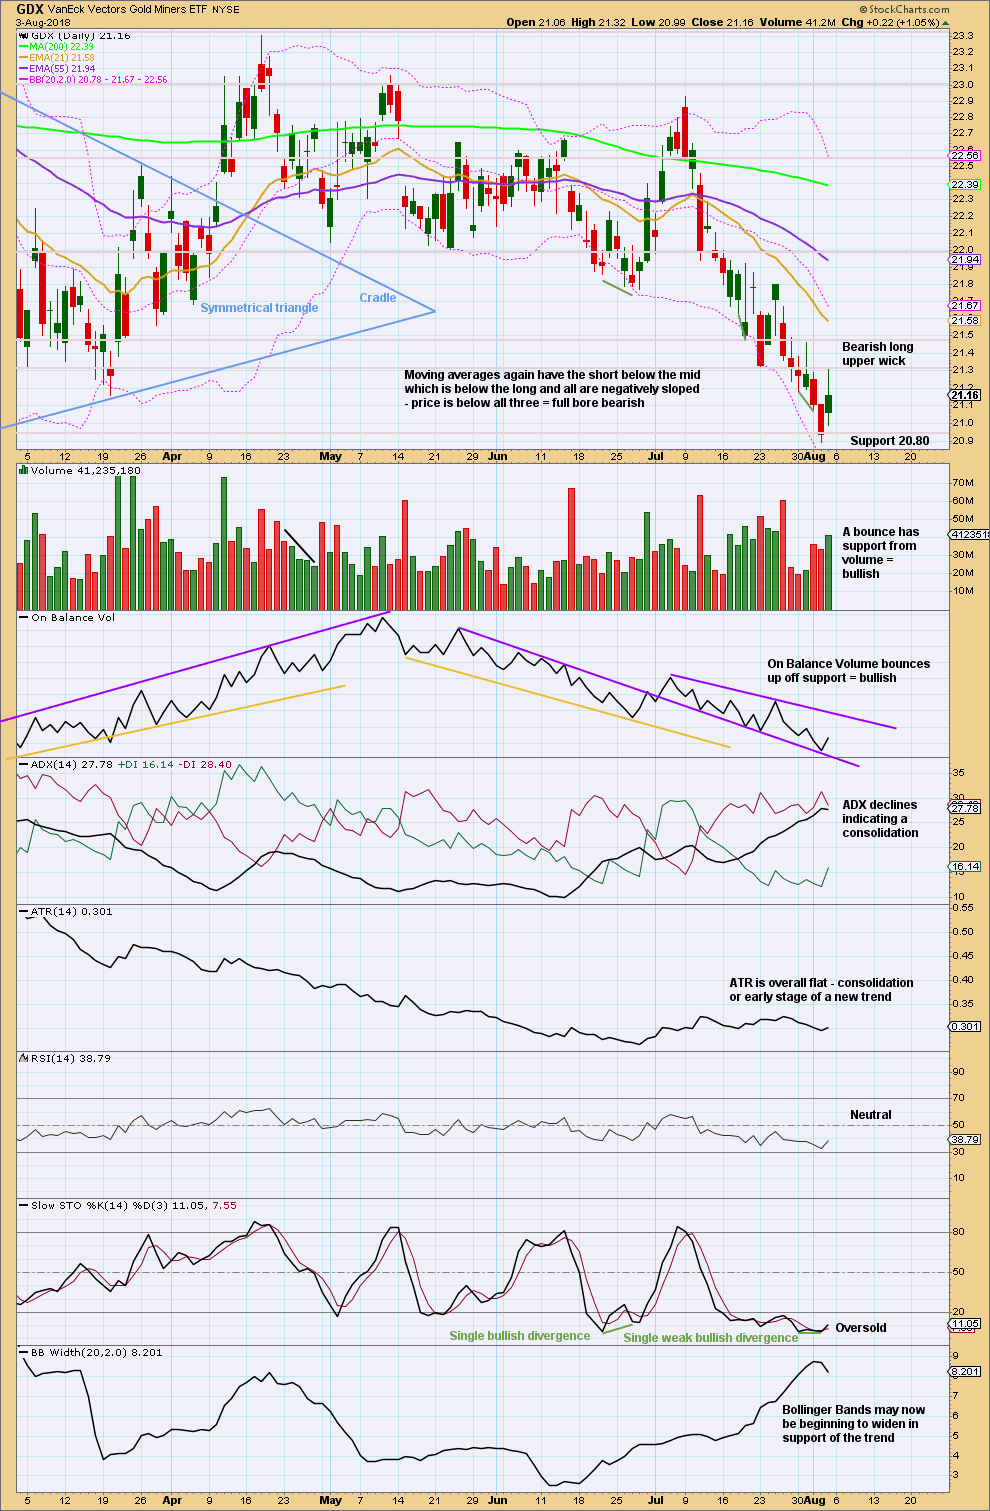
Click chart to enlarge. Chart courtesy of StockCharts.com.
Price is now at very strong support. In the first instance, at least expect some bounce here to relieve oversold conditions. Thereafter, look out for a possible downwards breakout.
Published @ 07:54 p.m. EST on 4th August, 2018.
updated hourly chart:
I’m very concerned that there is a clear five down today for this last small pullback. that means the pullback isn’t over. price is close to the invalidation point.
now, it could be this wave count is correct, the first of a series of second wave corrections in a new trend for Gold is usually very deep indeed.
or it could be that the low is not yet quite in.
so I started again with a clean chart for minute v, moved minute iv back up to the prior swing high (you may like the look of this better Dreamer, it’s now a single zigzag) and then looked at the structure of minute v.
it could be an ending diagonal. the diagonal would be expanding so the minimum requirement is for minuette (v) to be at least slightly longer than minuette (iii)
Yes, I was concerned about the look of Minute 4. Gold sure isn’t making the recent structure easy to decode.
Any chance today’s move down is a double ZZ? I do agree it looks like a 5 though
Yes, it could be a double ZZ.
But….
It really really does look so much like a five.
Only a new high above it’s start at 1,219.40 is going to tell us if it’s over and then what it was.
$USD is very close to a top, but not quite there, keeping pressure on gold
Gold price is possibly in oversold territory but imo no signs of a reversal just yet. Got the low to 1208-1199 range that I was looking for earlier (the droids at work?) and still expect a break below 1206 for 1199 and possible break below there as long as the upside remains restricted to under 1216-18 to adjust weekly RSI back above 30 (stop at 1225?). Lets see if it works. Inside week so far. Gold price could be winding up for an upside break? 🙂
We must be close to a bottom. The dumping of naked short contracts is becoming absurd.
Positive divergences at these lows persist despite the smack downs.
I am also thinking of Double Zigzag. The monthly chart just had back test of breakout. If gold price start moving higher from here optimism may return in PM sector.
Price projection could be around 1500 the Breakdown of support from April 2013.
I am glad several counts will continue to be watched till price invalidates many above 1365.
Thanks Dreamer.
Just wondering (and I don’t want to assume) if the numbers 1 to 5 (blue) on your chart are supposed to be an EW count? Because… that doesn’t make sense.
So it could be something else?
I think I’ll be reviewing all valid weekly charts at least once a week, and possibly more often if necessary, at this time. They’re starting to diverge a little. Not in direction, but in the size of the next movement.
We’re coming up to the end of cycle wave b…. possibly… soon.
Oh how I look forward so much to the end of this horrible b wave.
Numbering are not EW waves. These represents the turning points only (by Rambus) .
Okay, I thought that was so. Thanks Papudi.
Yes, I like the look of the breakout and backtest.
Lara, EW ? please… you’ve now labeled Minute 4 as a sideways Combination, ZigZag – X – Expanded Flat. Is it normal in a sideways move for the Y wave to be so much “smaller” than the W wave and there be such a large distance between the end of Y and the end of W? Thanks,
Not normal, not. But it does sometimes happen.
It’s still a sideways move, almost like a triangle except for the spike down for subminuette wave b. So overall IMO it looks okay.
And wave X is deep.
OK. Thanks
So Lara, I am still leaning toward a possible bullish outcome to the triangle for Gold, your last count, labeled WEEKLY CHART – DOUBLE ZIGZAG.
In support of this, I have what I believe are Bull counts for both GDX and GDXJ that fit very well. They have some similarities, but are also unique. They are also very close to invalidation, so if they are correct, the bottom is in.
Note that during the 2 years of sideways consolidation, the highest volume weeks are DOWN weeks. This would suggest a downwards breakout, no?
But wait, not so simple. Two years is a long time. On the monthly chart, the highest volume month is an UP month! Wouldn’t the monthly chart be a stronger indicator and therefore an upwards breakout may be higher in probability?
Thoughts on this and the counts?
https://www.tradingview.com/x/QEonk11u/
It’s a very long time period. I’d be looking at daily chart volume bars actually in the first instance. If there are more than two, and preferably three or four, that are strongest in the same direction then that would be a strong indicator of a possible breakout direction.
But this trick does not always work. The last consolidation for Gold which ended on 1st May had strongest volume for upwards days, yet it broke out downwards.
The trick works more often than it fails, but it’s not certain.
Your wave counts look good, they are both valid.
For GDX, could cycle X be a triangle itself? A really huge one? I think that would fit. Doesn’t really make much difference though, it’d still be expecting an upwards breakout. Only more quickly now.
For GDXJ, motive wave will do a nine wave triangle. You could put that in there.
Great. Thanks.
For GDX, a bullish triangle doesn’t look right for the whole structure based on the way the trendlines converge. That said, a bearish triangle does work for the whole structure, so will need to watch for that possibility for sure.
For GDXJ, Trading view doesn’t offer the 9 wave triangle, so I show it like this. Also for GDXJ, a bear triangle for the whole structure doesn’t seem to work based on how the trendlines converge.
These triangles are so tricky. Ultimately will need to watch for breakouts.
Tricksy triangles.
That’s made a great T-shirt IMO!