

S&P 500
Another upwards day fits expectations for the short term picture.
At the end of this week, strong signals from the AD line reinforce the long term Elliott wave count.
Summary: Overall, it still looks most likely that a small Elliott wave triangle may complete early next week with a final small pullback to end above 2,802.49. Thereafter, the upwards trend should resume to new all time highs, which may be made next week or the week after.
The bigger picture remains extremely bullish.
The mid to longer term target is at 2,922 (Elliott wave) or 3,045 (classic analysis). Another multi week to multi month correction is expected at one of these targets.
The final target for this bull market to end remains at 3,616.
Always practice good risk management. Always trade with stops and invest only 1-5% of equity on any one trade.
The biggest picture, Grand Super Cycle analysis, is here.
Last historic analysis with monthly charts is here, video is here.
ELLIOTT WAVE COUNT
WEEKLY CHART
Click chart to enlarge.
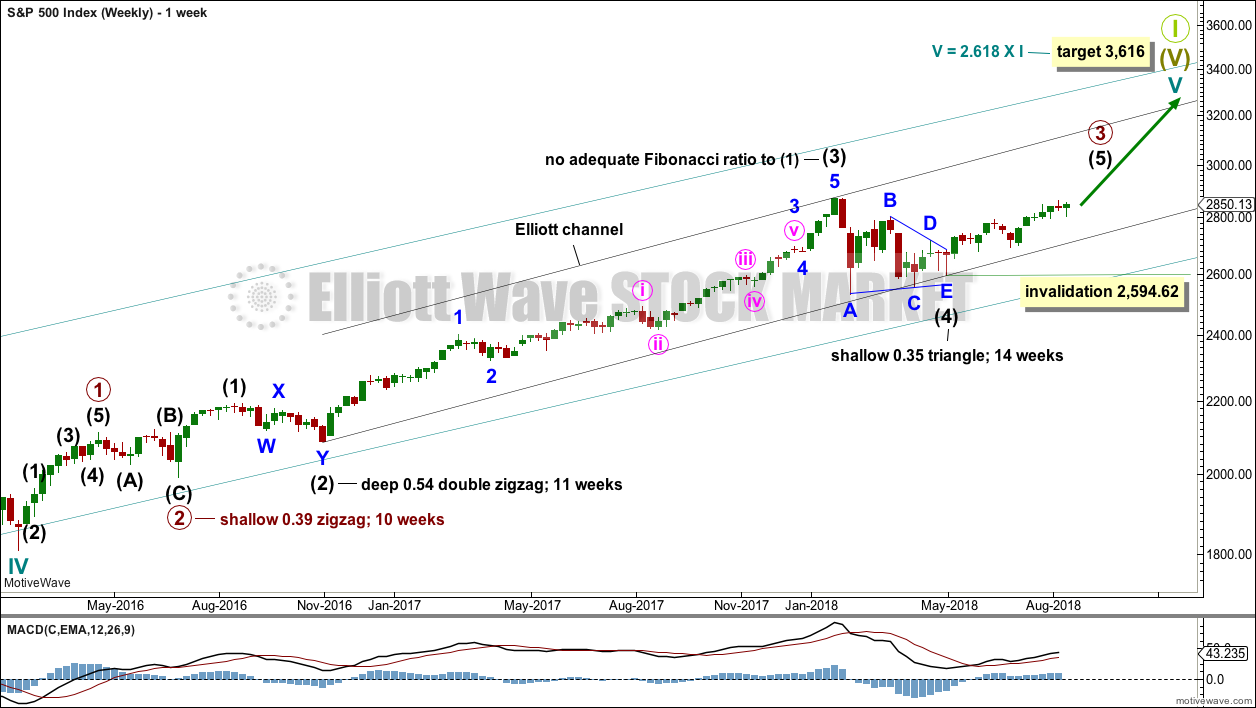
Cycle wave V must complete as a five structure, which should look clear at the weekly chart level and also now at the monthly chart level. It may only be an impulse or ending diagonal. At this stage, it is clear it is an impulse.
Within cycle wave V, the third waves at all degrees may only subdivide as impulses.
Intermediate wave (4) has breached an Elliott channel drawn using Elliott’s first technique. The channel is redrawn using Elliott’s second technique: the first trend line from the ends of intermediate waves (2) to (4), then a parallel copy on the end of intermediate wave (3). Intermediate wave (5) may end either midway within the channel, or about the upper edge.
Intermediate wave (4) may now be a complete regular contracting triangle lasting fourteen weeks, one longer than a Fibonacci thirteen. There is perfect alternation and excellent proportion between intermediate waves (2) and (4).
Within intermediate wave (5), no second wave correction may move beyond the start of its first wave below 2,594.62. However, the lower edge of the black Elliott channel drawn across the ends of intermediate degree waves should provide very strong support for any deeper pullbacks, holding price well above the invalidation point while intermediate wave (5) unfolds.
At this stage, the expectation is for the final target to me met in October 2019. If price gets up to this target and either the structure is incomplete or price keeps rising through it, then a new higher target would be calculated.
A multi week to multi month consolidation for primary wave 4 is expected on the way up to the final target.
The last bullish fifth wave of minor wave 5 to end intermediate wave (3) exhibited commodity like behaviour. It was strong and sustained. It is possible that the upcoming wave of minor wave 5 to end intermediate wave (5) to end primary wave 3 may exhibit similar behaviour, so we should be on the lookout for this possibility.
DAILY CHART
Click chart to enlarge.
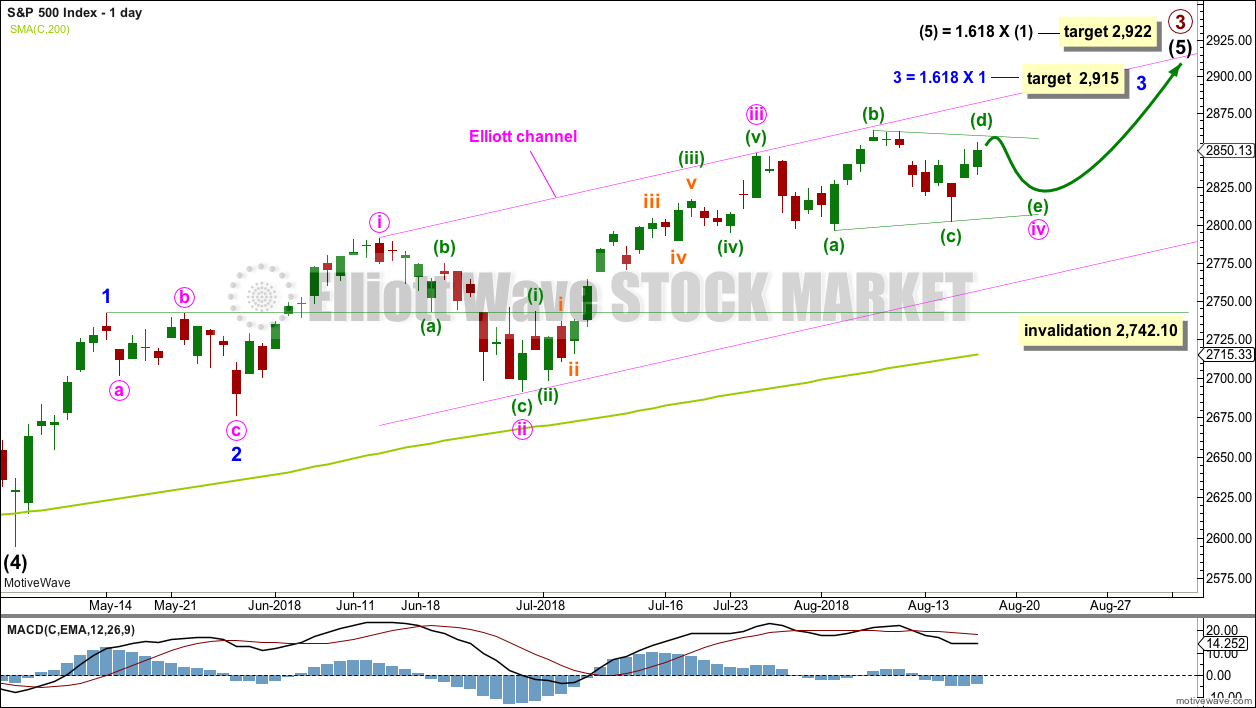
Intermediate wave (5) would be very likely to make at least a slight new high above the end of intermediate wave (3) at 2,872.87 to avoid a truncation.
Intermediate wave (3) exhibits no Fibonacci ratio to intermediate wave (1). It is more likely then that intermediate wave (5) may exhibit a Fibonacci ratio to either of intermediate waves (1) or (3). The most common Fibonacci ratio would be equality in length with intermediate wave (1), but in this instance that would expect a truncation. The next common Fibonacci ratio is used to calculate a target for intermediate wave (5) to end.
Intermediate wave (5) is unfolding as an impulse, and within it minor waves 1 and 2 are complete.
Minor wave 3 may only subdivide as an impulse. A target is calculated for minor wave 3 to end, which expects to see the most common Fibonacci ratio to minor wave 1. Minor wave 3 may last several weeks in total and should look like an impulse at the daily chart level. When it is complete, then minor wave 4 may last about one to two weeks in order for it to exhibit reasonable proportion to minor wave 2. Minor wave 4 may not move into minor wave 1 price territory below 2,742.10.
Within minor wave 3, minute waves i, ii and iii all look complete and minute wave iv may still be incomplete. If minute wave iv were to continue further, then it would have better proportion to minute wave ii and would exhibit alternation in structure. This idea also has support from classic technical analysis.
It looks most likely now minute wave iv may be a running contracting triangle that may be almost complete. Minuette wave (e) of the triangle may fall reasonably short of the (a)-(c) trend line with a small pullback early next week; this is the most common look for E waves of triangles.
It is also possible that minute wave iv was over at the last low and minor wave 3 was over at the last high. A new low below 2,791.47 could not be a continuation of minute wave iv, so the correction at that stage would be labelled minor wave 4.
The channel is drawn using Elliott’s first technique. The upper edge has provided resistance.
If price makes a new low below 2,791.47 and keeps on falling, then look for strong support about the lower edge of the Elliott channel on this daily chart; the pullback may end there.
TECHNICAL ANALYSIS
WEEKLY CHART
Click chart to enlarge. Chart courtesy of StockCharts.com.
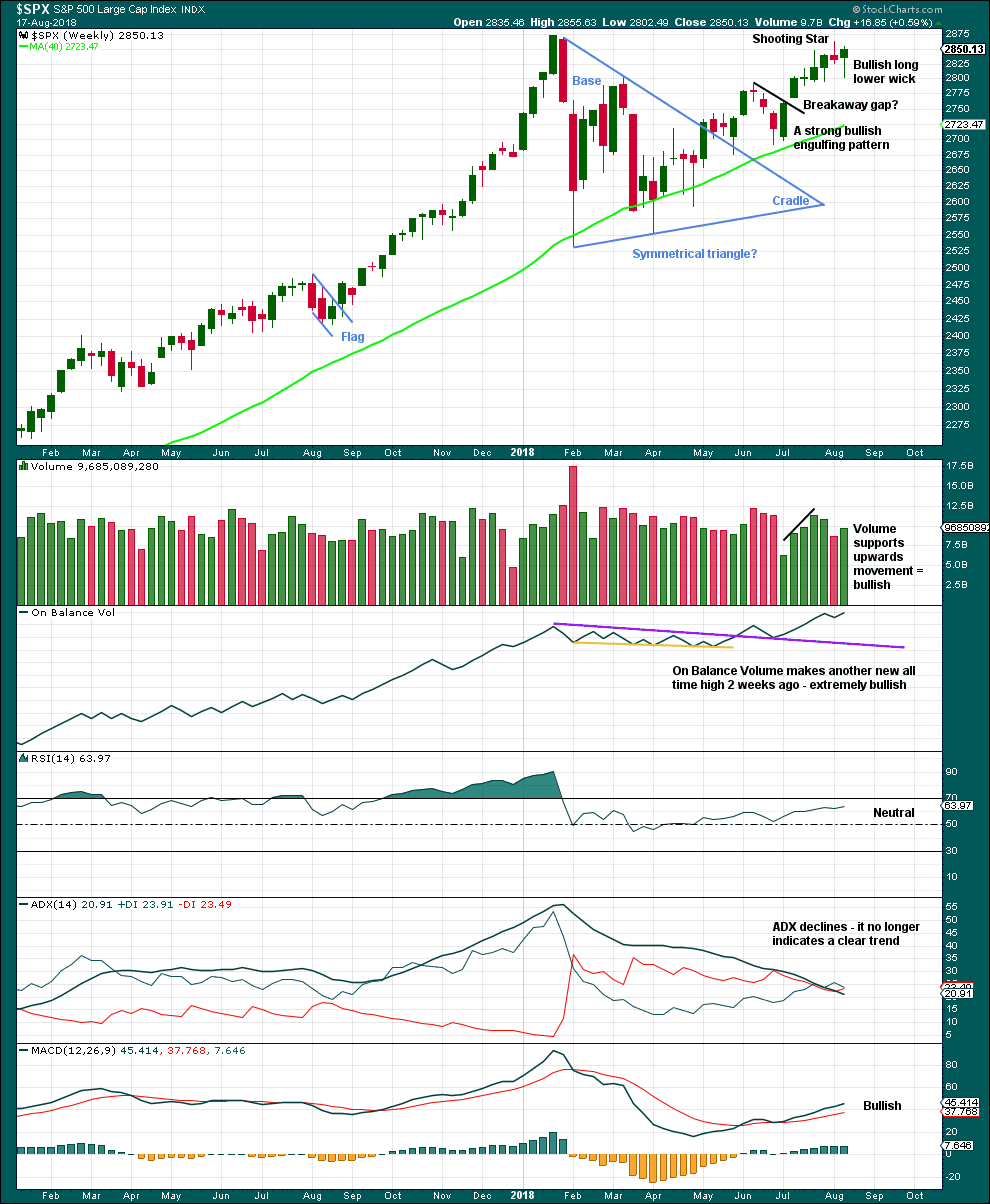
The Shooting Star candlestick reversal pattern has been followed by a downwards week. It may yet be followed by more downwards movement, but the strength of this last weekly candlestick suggests it may not.
Price moved lower this week, but the balance of volume was upwards and the candlestick closed green. Upwards movement during the week has support from volume, but for clarity we should look inside the week at daily volume bars.
The long lower wick and a close very close to highs suggests a little more upwards movement next week.
DAILY CHART
Click chart to enlarge. Chart courtesy of StockCharts.com.
The symmetrical triangle may now be complete. The base distance is 340.18. Added to the breakout point of 2,704.54 this gives a target at 3,044.72. This is above the Elliott wave target at 2,922, so the Elliott wave target may be inadequate.
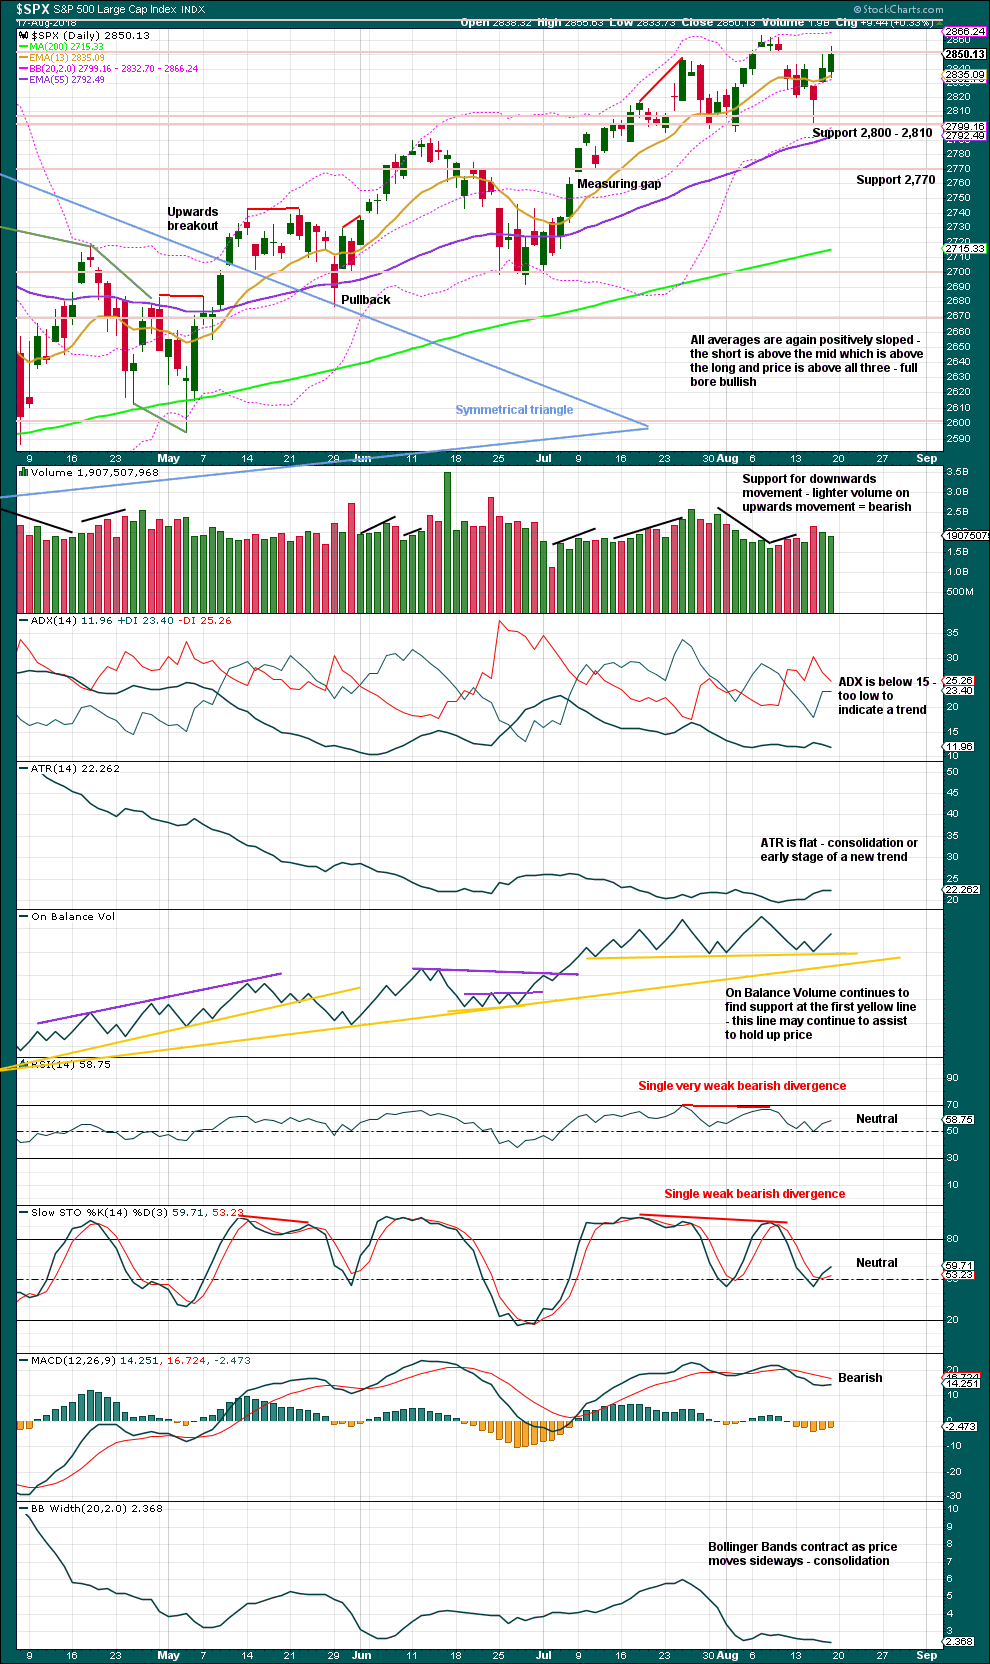
Since the low on the 2nd of April, 2018, price has made a series of higher highs and higher lows. This is the definition of an upwards trend. But trends do not move in perfectly straight lines; there are pullbacks and bounces along the way.
Support about 2,800 remains very strong with three recent tests and no close below this point. Each test of this support area strengthens its technical significance.
Support at the first yellow line for On Balance Volume has now been tested five times. This line now has very reasonable technical significance. It looks like a small consolidation may complete. Expect support at 2,800 is very likely now to hold.
The bigger picture remains extremely bullish with another new all time high from On Balance Volume as recently as the 7th of August.
If On Balance Volume breaks below first support, there is a new support line which may allow for another one or two days of downwards movement. Both support lines have reasonable technical significance.
VOLATILITY – INVERTED VIX CHART
WEEKLY CHART
Click chart to enlarge. Chart courtesy of StockCharts.com. So that colour blind members are included, bearish signals
will be noted with blue and bullish signals with yellow.
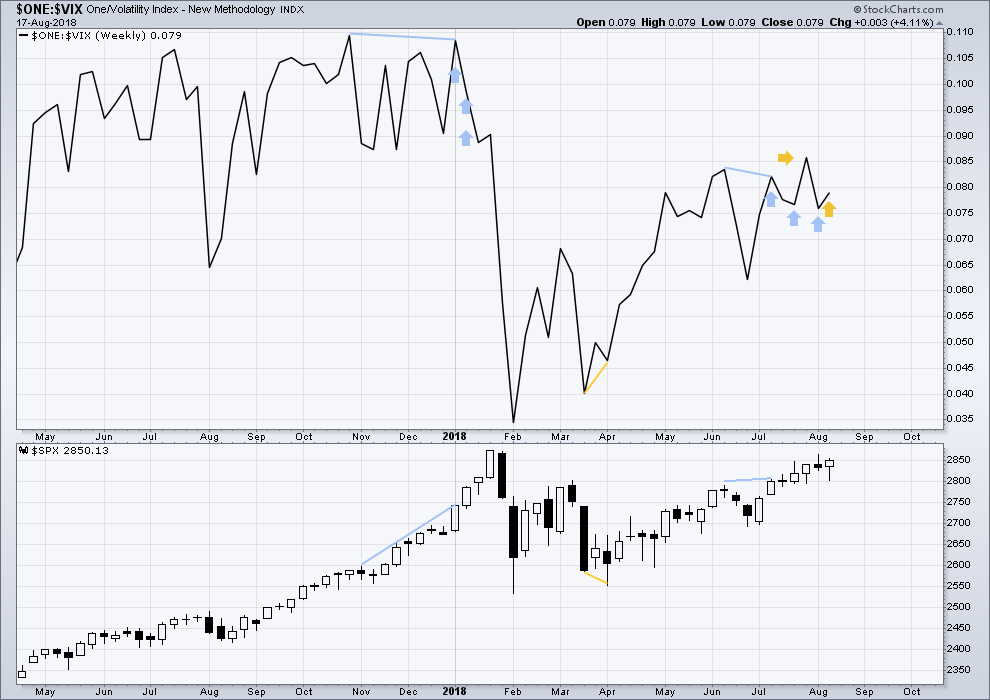
To keep an eye on the all time high for inverted VIX a weekly chart is required at this time.
Notice how inverted VIX has very strong bearish signals four weeks in a row just before the start of the last large fall in price. At the weekly chart level, this indicator may be useful again in warning of the end of primary wave 3.
Some bearish divergence was noted at the end of last week’s analysis. This has now been followed by a downwards week, so it may now be resolved.
Price moved lower for the last week, but inverted VIX moved higher. This divergence is bullish.
Inverted VIX is still some way off from making a new all time high.
DAILY CHART
Click chart to enlarge. Chart courtesy of StockCharts.com. So that colour blind members are included, bearish signals
will be noted with blue and bullish signals with yellow.
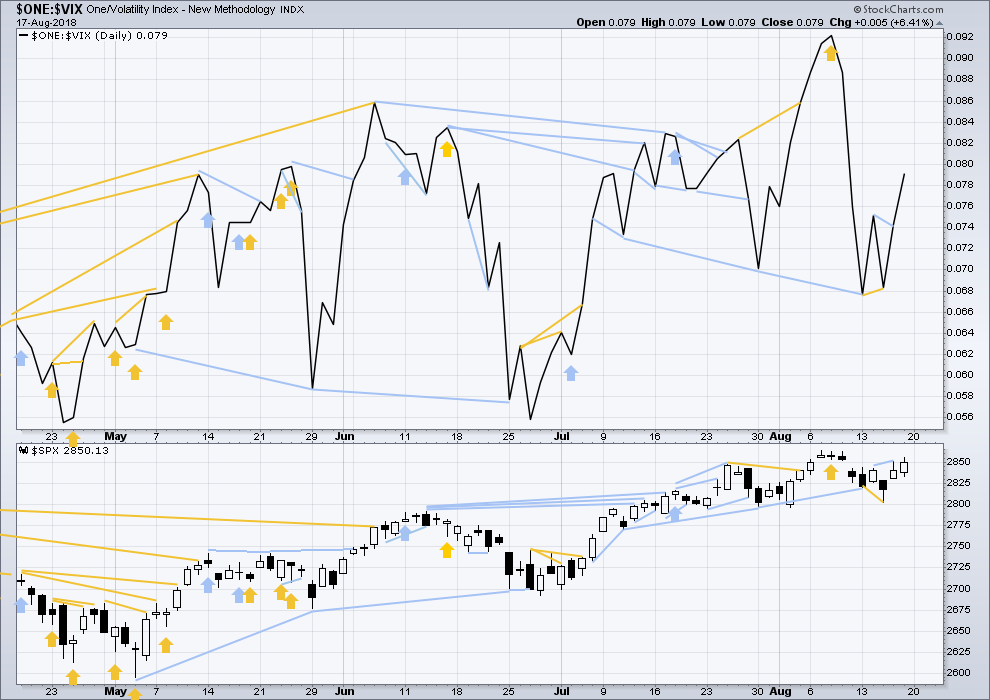
Normally, volatility should decline as price moves higher and increase as price moves lower. This means that normally inverted VIX should move in the same direction as price.
Last noted mid term bearish divergence has not been followed yet by more downwards movement. It may still indicate downwards movement ahead as there is now a cluster of bearish signals from inverted VIX.
Short term bearish divergence noted in last analysis has been followed by upwards movement, so it is considered to have failed. There is no new divergence.
BREADTH – AD LINE
WEEKLY CHART
Click chart to enlarge. Chart courtesy of StockCharts.com.
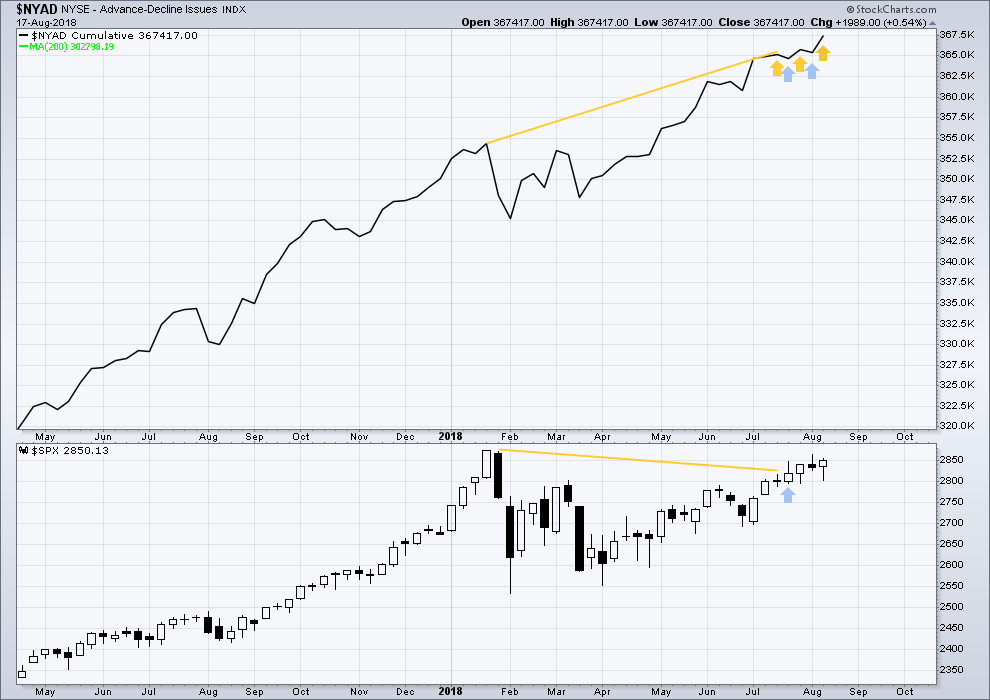
When primary wave 3 comes to an end, it may be valuable to watch the AD line at the weekly time frame as well as the daily.
At this stage, there is very strong bullish divergence between price and the AD line at the weekly time frame. With the AD line making new all time highs, expect price to follow through with new all time highs in coming weeks.
Another new all time high from the AD line this week is extremely bullish.
DAILY CHART
Click chart to enlarge. Chart courtesy of StockCharts.com.
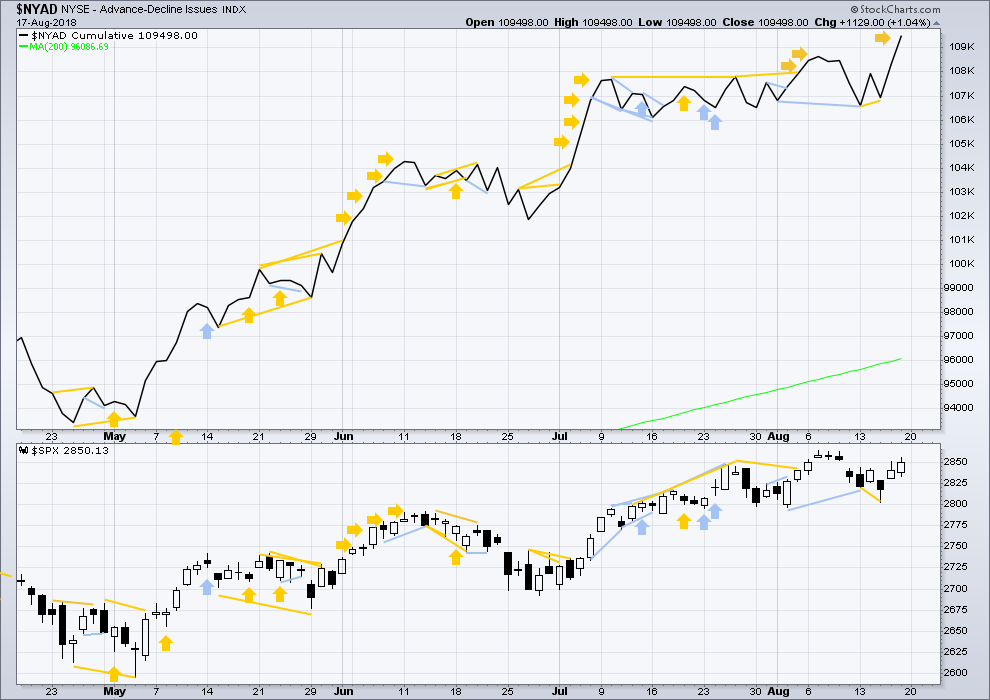
There is normally 4-6 months divergence between price and market breadth prior to a full fledged bear market. This has been so for all major bear markets within the last 90 odd years. With no longer term divergence yet at this point, any decline in price should be expected to be a pullback within an ongoing bull market and not necessarily the start of a bear market. New all time highs from the AD line means that any bear market may now be an absolute minimum of 4 months away. It may of course be a lot longer than that. My next expectation for the end of this bull market may now be October 2019.
Breadth should be read as a leading indicator.
The AD line has made a new all time high at the daily chart level as well as the weekly. This is extremely bullish.
Small caps made another new all time high on Friday. Mid caps have made new all time highs on the 7th of August. Only large caps have to follow through; they do usually lag in the latter stages of a bull market.
DOW THEORY
The following lows need to be exceeded for Dow Theory to confirm the end of the bull market and a change to a bear market:
DJIA: 23,360.29.
DJT: 9,806.79.
S&P500: 2,532.69.
Nasdaq: 6,630.67.
Only Nasdaq at this stage is making new all time highs, with another new all time high on the 25th of July. DJIA and DJT need to make new all time highs for the ongoing bull market to be confirmed.
GOLD
GDX and Gold both continued lower for the week as expected.
With Gold now having developed an extreme downwards trend, candlestick reversal patterns may be used as warnings that the trend may either end or be interrupted by a consolidation to relieve extreme conditions.
Summary: With support from volume, GDX has effected a downwards breakout from a very long held consolidation (beginning December 2016). The long term target is at 16.02.
For the short term, look for a possible bounce or consolidation next week for GDX. In the fist instance, expect resistance at 19.74 to hold.
It is again possible for Gold that a low may be in place, but this needs some confirmation with a new high above 1,216.30.
Always trade with stops to protect your account. Risk only 1-5% of equity on any one trade.
Grand SuperCycle analysis is here.
Last historic analysis with monthly charts and several weekly alternates is here, video is here.
Weekly charts will all again be reviewed at the end of this week.
MAIN ELLIOTT WAVE COUNT
WEEKLY CHART – TRIANGLE
Click chart to enlarge.
There are four remaining weekly wave counts at this time for cycle wave b: a triangle, flat, combination or double zigzag. Only one weekly chart shall be published Monday to Thursday and all four weekly charts will be reviewed again at the end of this week.
While the direction does not diverge for these four weekly wave counts, only one weekly wave count shall be published on a daily basis, so that the analysis is manageable for me to publish and for members to digest. Note: This does not mean that the remaining three counts may not be correct.
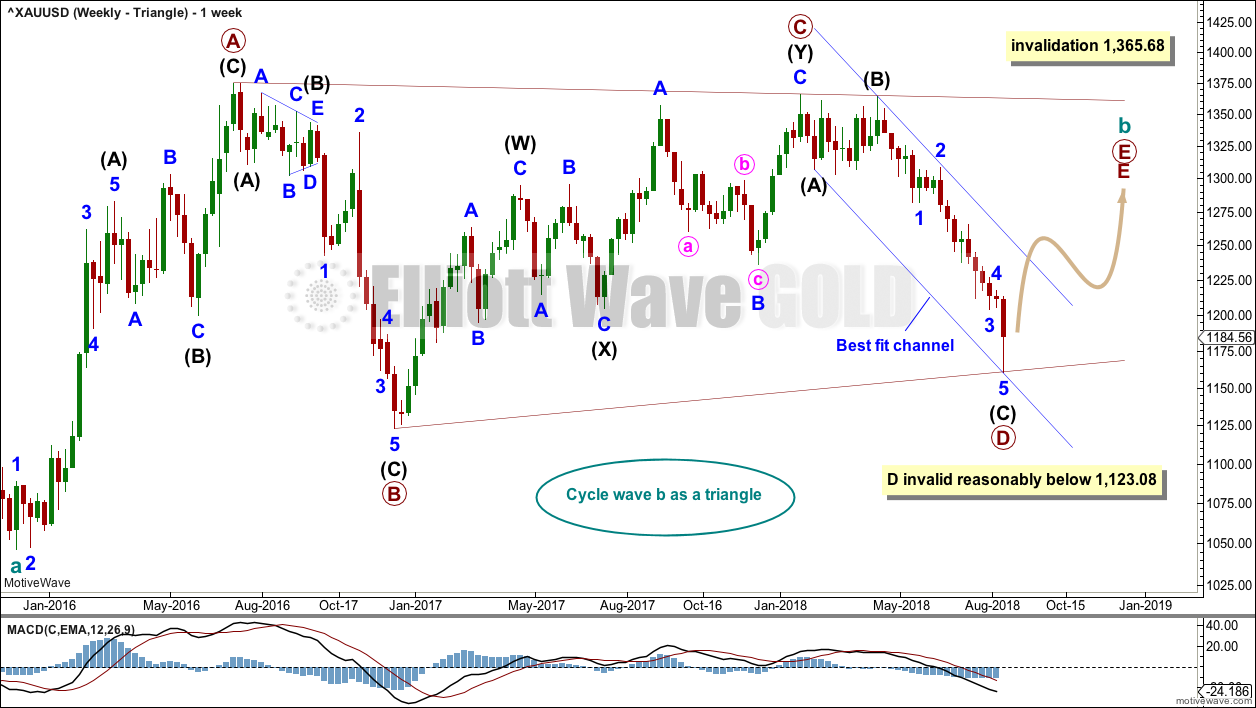
The triangle so far has the best fit and look.
Cycle wave b may be an incomplete triangle. The triangle may be a contracting or barrier triangle, with a contracting triangle looking much more likely because the A-C trend line does not have a strong slope. A contracting triangle could see the B-D trend line have a stronger slope, so that the triangle trend lines converge at a reasonable rate. A barrier triangle would have a B-D trend line that would be essentially flat, and the triangle trend lines would barely converge.
Within a contracting triangle, primary wave D may not move beyond the end of primary wave B below 1,123.08. Within a barrier triangle, primary wave D may end about the same level as primary wave B at 1,123.08, so that the B-D trend line is essentially flat. Only a new low reasonably below 1,123.08 would invalidate the triangle.
Within both a contracting and barrier triangle, primary wave E may not move beyond the end of primary wave C above 1,365.68.
Four of the five sub-waves of a triangle must be zigzags, with only one sub-wave allowed to be a multiple zigzag. Primary wave C is the most common sub-wave to subdivide as a multiple, and this is how primary wave C for this example fits best.
Primary wave D must be a single structure, most likely a zigzag.
There are no problems in terms of subdivisions or rare structures for this wave count. It has an excellent fit and so far a typical look.
A new channel is drawn on all charts about the downwards wave of primary wave D. Here, it is labelled a best fit channel. If this channel is breached by upwards movement, that may provide reasonable confidence in this weekly triangle wave count and put serious doubt on the other three weekly wave counts.
This wave count now expects a consolidation for primary wave E to back test resistance at prior support, and then a significant new downwards wave for cycle wave C. For the long term, this is the most bearish wave count.
DAILY CHART – TRIANGLE
Click chart to enlarge.
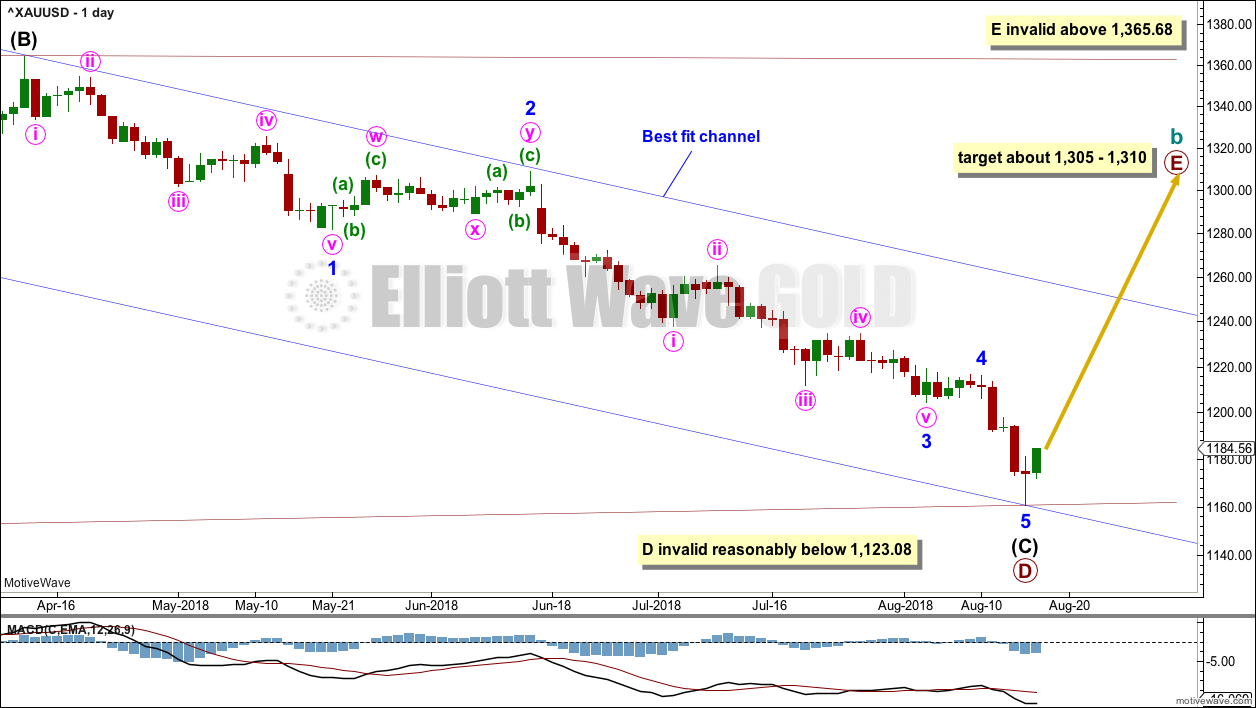
Primary wave D may again be complete. For Barchart data, there is a Morning Doji Star candlestick reversal pattern at the low.
A new high above 1,216.30 would be required for reasonable confidence that a low is in place. This price point is the start of minor wave 5. A new high above the start of minor wave 5 may not be a second wave correction within minor wave 5, so at that stage minor wave 5 should be over.
While price remains below 1,216.30, it will remain possible that primary wave D could continue lower. However, primary wave D for this triangle wave count should end here or very soon, so that the B-D trend line has a reasonable slope ensuring the triangle trend lines converge at a reasonable rate. If primary wave D were to continue much lower, the B-D trend line would have too shallow a slope for a normal looking Elliott wave triangle.
A target for primary wave E is the strong zone of resistance about 1,305 to 1,310. Primary wave E must subdivide as a zigzag, and it should last at least a Fibonacci 13 weeks. Primary wave E may not move beyond the end of primary wave C above 1,365.68.
WEEKLY CHART – FLAT
Click chart to enlarge.
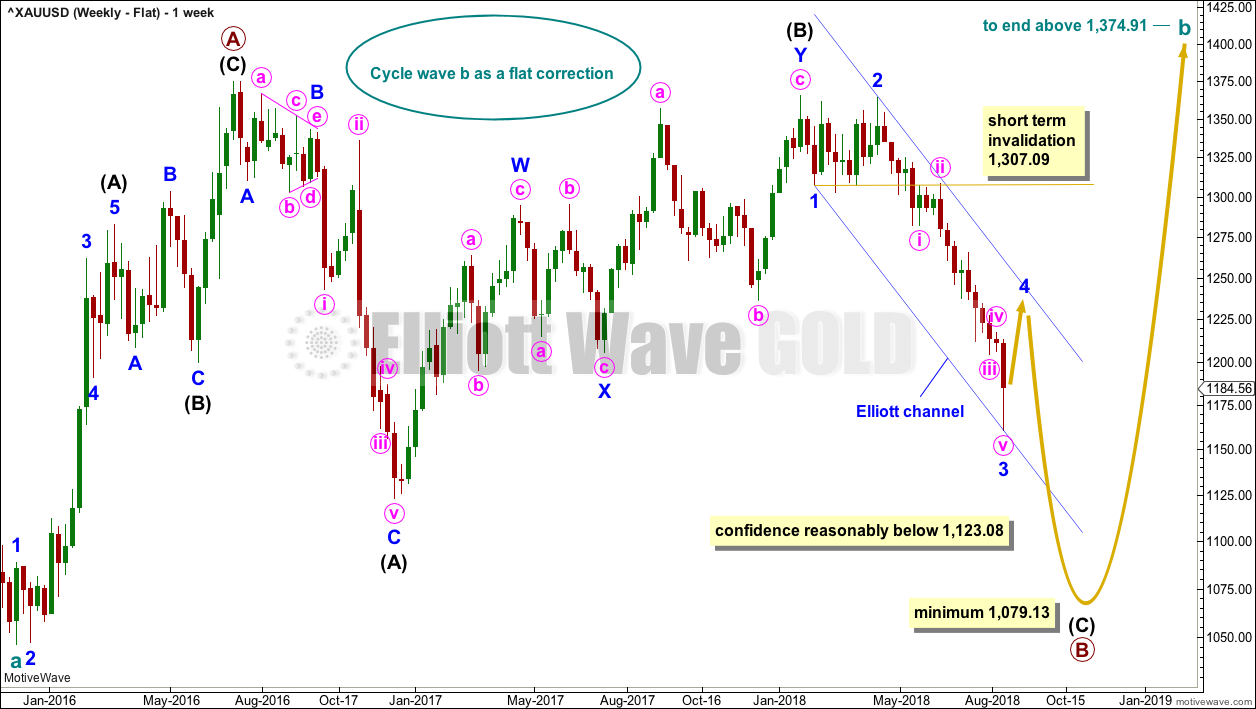
It is possible that cycle wave b may be a flat correction. Within a flat correction, primary wave B must retrace a minimum 0.9 length of primary wave A at 1,079.13 or below. Primary wave B may make a new low below the start of primary wave A at 1,046.27 as in an expanded flat correction.
Only a new low reasonably below 1,123.08 would provide reasonable confidence in this wave count.
Intermediate wave (C) must subdivide as a five wave structure; it may be unfolding as an impulse. Within intermediate wave (C), minor waves 1, 2 and now 3 may be complete. A consolidation to last about 5 to 13 weeks may now develop for minor wave 4. Minor wave 4 may not move into minor wave 1 price territory above 1,307.09.
The blue channel here is drawn using Elliott’s first technique. Minor wave 4 would be most likely to remain contained within this channel, and may find resistance about the upper edge if it gets there. A strong breach of this channel by upwards movement would reduce the probability of this wave count.
Minor wave 2 was a double zigzag lasting nine weeks. To exhibit alternation and reasonable proportion minor wave 4 may be a flat, combination or triangle and may last a little longer than nine weeks as these types of corrections tend to be longer lasting than zigzags or zigzag multiples.
WEEKLY CHART – COMBINATION
Click chart to enlarge.
It is essential when a triangle is considered to always consider alternates. Too many times over the years I have labelled a triangle as unfolding or even complete, only for it to be invalidated and the structure turning out to be something else.
When a triangle is invalidated, then the most common structure the correction turns out to be is a combination.
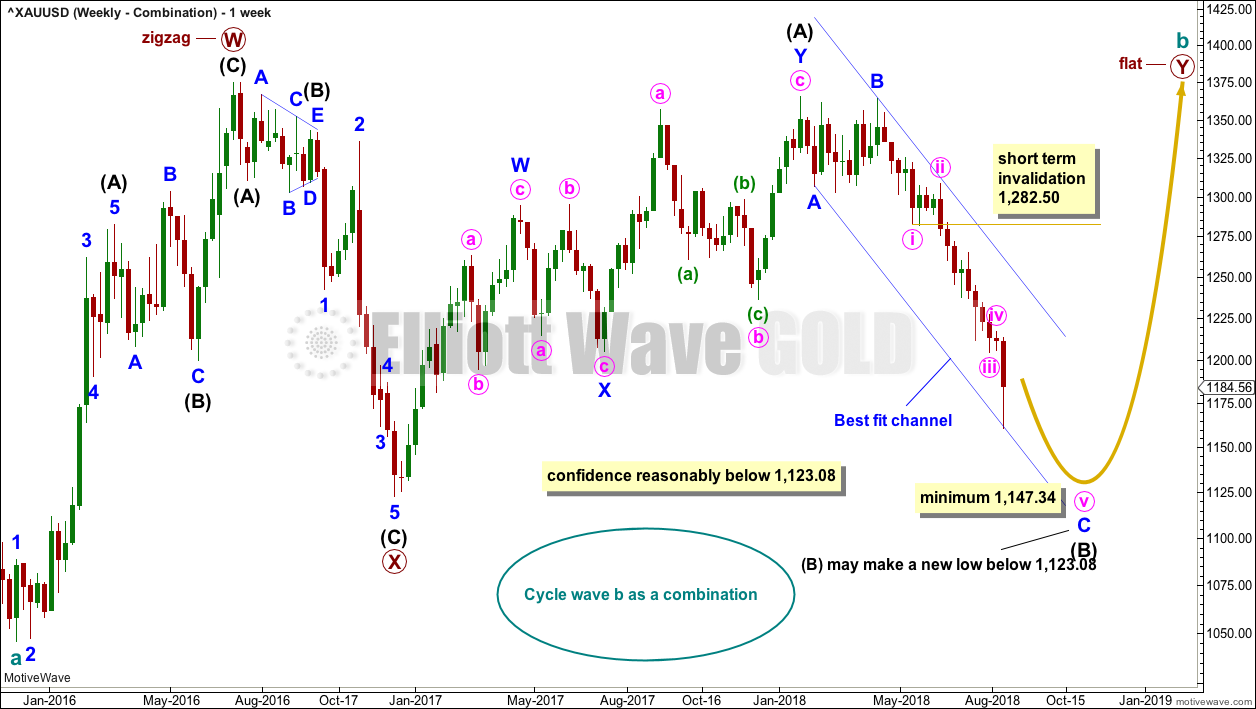
If cycle wave b is a combination, then the first structure in a double may be a complete zigzag labelled primary wave W.
The double may be joined by a three in the opposite direction, a zigzag labelled primary wave X.
The second structure in the double may be a flat correction labelled primary wave Y. My research on Gold so far has found that the most common two structures in a double combination are one zigzag and one flat correction. I have found only one instance where a triangle unfolded for wave Y. The most likely structure for wave Y would be a flat correction by a very wide margin, so that is what this wave count shall expect.
Within a flat correction for primary wave Y, the current downwards wave of intermediate wave (B) may be a single or multiple zigzag; for now it shall be labelled as a single. Intermediate wave (B) must retrace a minimum 0.9 length of intermediate wave (A) at 1,147.34. Intermediate wave (B) may move beyond the start of intermediate wave (A) as in an expanded flat.
Because the minimum requirement for intermediate wave (B) is not yet met, this wave count requires that minute wave v of minor wave C of intermediate wave (B) continues lower next week. This is the most immediately bearish of all four weekly wave counts.
When intermediate wave (B) is complete, then intermediate wave (C) would be expected to make at least a slight new high above the end of intermediate wave (A) at 1,365.68 to avoid a truncation. Primary wave Y would be most likely to end about the same level as primary wave W at 1,374.91, so that the whole structure takes up time and moves price sideways, as that is the purpose of double combinations.
While double combinations are very common, triples are extremely rare. I have found no examples of triple combinations for Gold at daily chart time frames or higher back to 1976. When the second structure in a double is complete, then it is extremely likely (almost certain) that the whole correction is over.
WEEKLY CHART – DOUBLE ZIGZAG
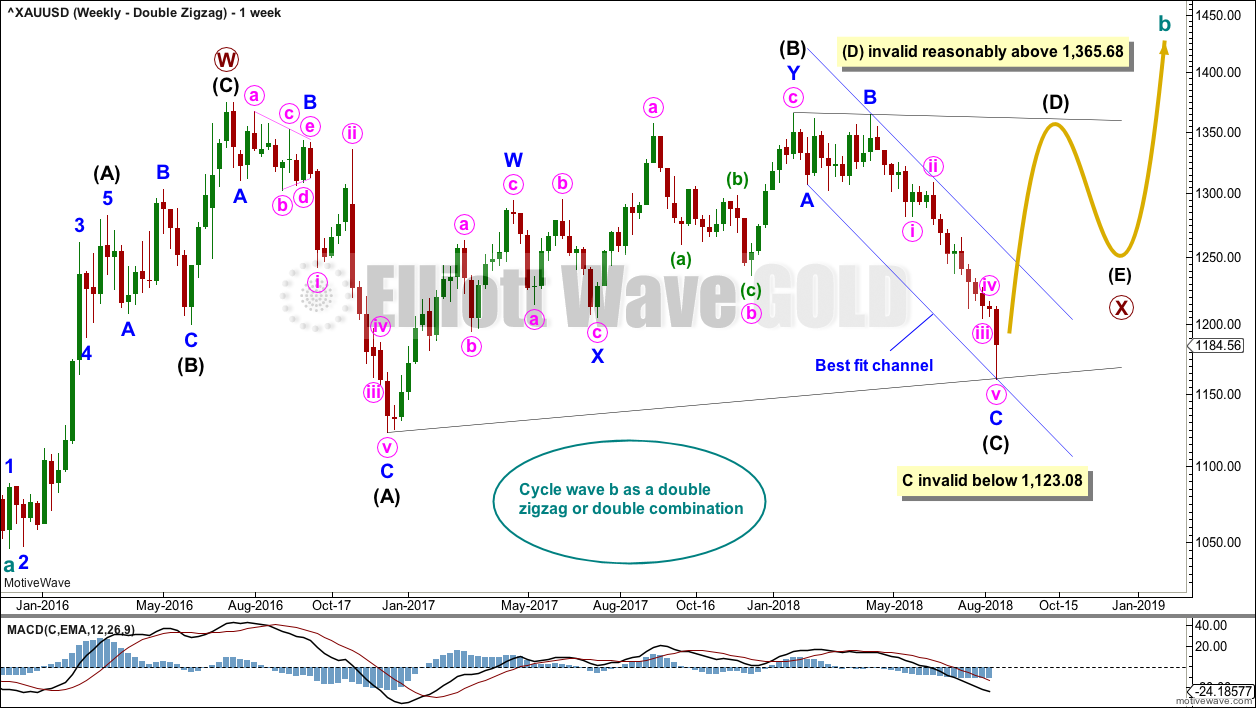
Click chart to enlarge.
Finally, it is also possible that cycle wave b may be a double zigzag or a double combination.
The first zigzag in the double is labelled primary wave W. This has a good fit.
The double may be joined by a corrective structure in the opposite direction, a triangle labelled primary wave X. The triangle would be about two thirds complete.
Within the triangle of primary wave X, intermediate wave (C) may now be complete. It may not move beyond the end of intermediate wave (A) below 1,123.08. The A-C trend line for both a barrier and contracting triangle should have some reasonable slope. For the triangle of primary wave X to have the right look, intermediate wave (C) should end here or very soon indeed.
This wave count may now expect choppy overlapping movement in an ever decreasing range for several more months. After the triangle is complete, then an upwards breakout would be expected from it.
Primary wave Y would most likely be a zigzag because primary wave X would be shallow; double zigzags normally have relatively shallow X waves.
Primary wave Y may also be a flat correction if cycle wave b is a double combination, but combinations normally have deep X waves. This would be less likely.
This wave count has good proportions and no problems in terms of subdivisions.
TECHNICAL ANALYSIS
WEEKLY CHART
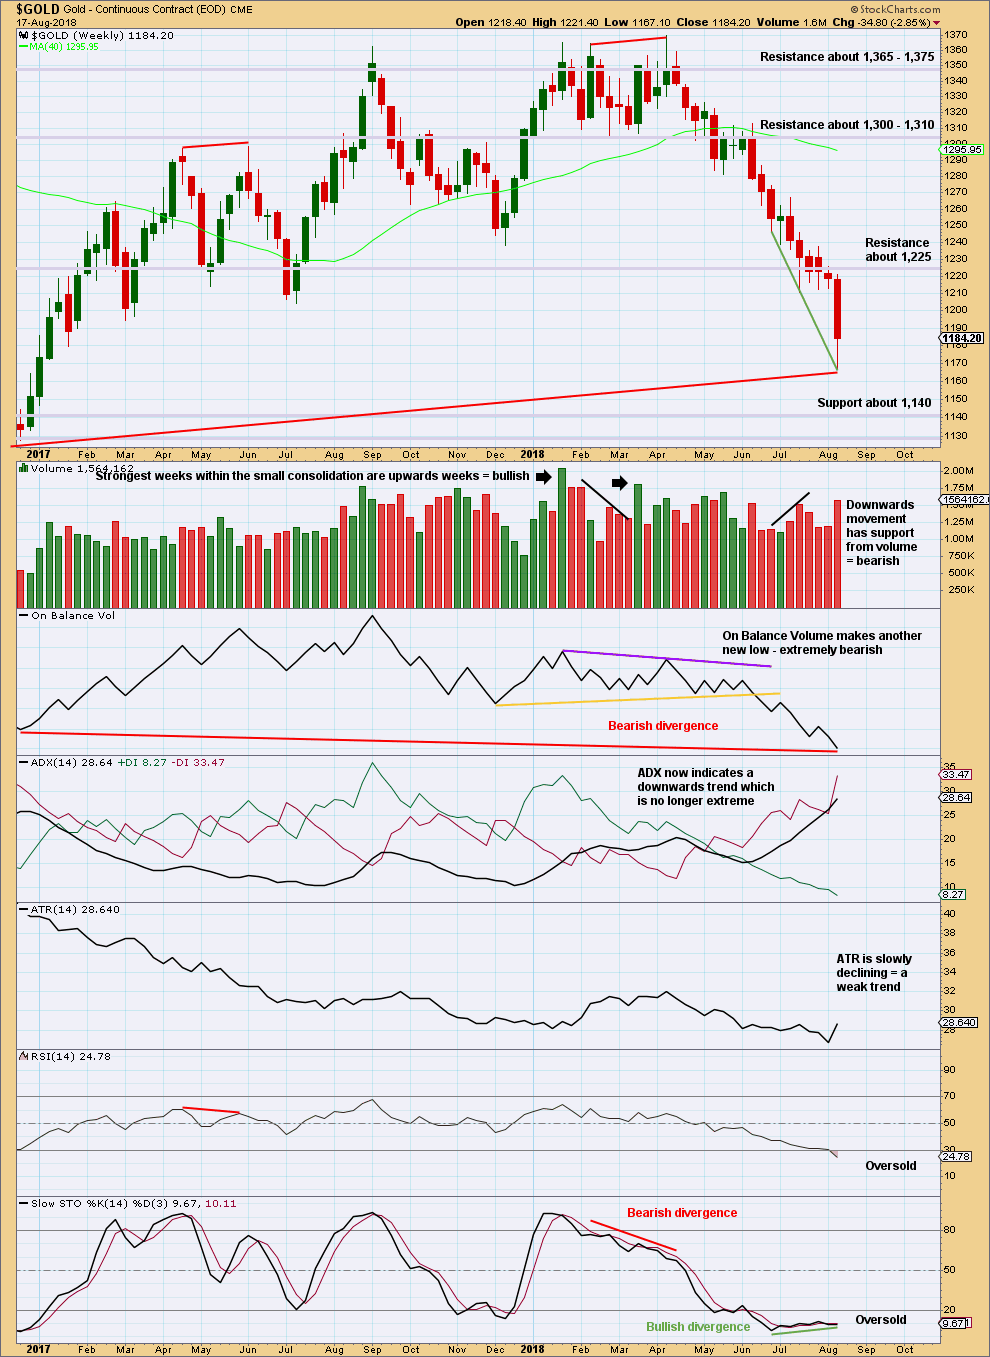
Click chart to enlarge. Chart courtesy of StockCharts.com.
On Balance Volume is lower than its prior point at the end of November 2015. This divergence is extremely bearish but does not rule out a consolidation unfolding here; the divergence does strongly support the Triangle wave count, which expects a consolidation or bounce up to test resistance now and then a continuation of a major bear market.
The long lower wick on this weekly candlestick is bullish, but that does not mean price can’t move a little lower next week. There is no bullish candlestick reversal pattern on the weekly chart at this time.
When Gold has a strong trend, ADX may remain very extreme for long periods of time and RSI can move more deeply into oversold. However, most recent lows since November 2015 were all found when RSI just reached oversold, so some caution here in looking out for a possible consolidation or trend change would be reasonable.
If price does continue lower next week, then look for next support about 1,140.
DAILY CHART
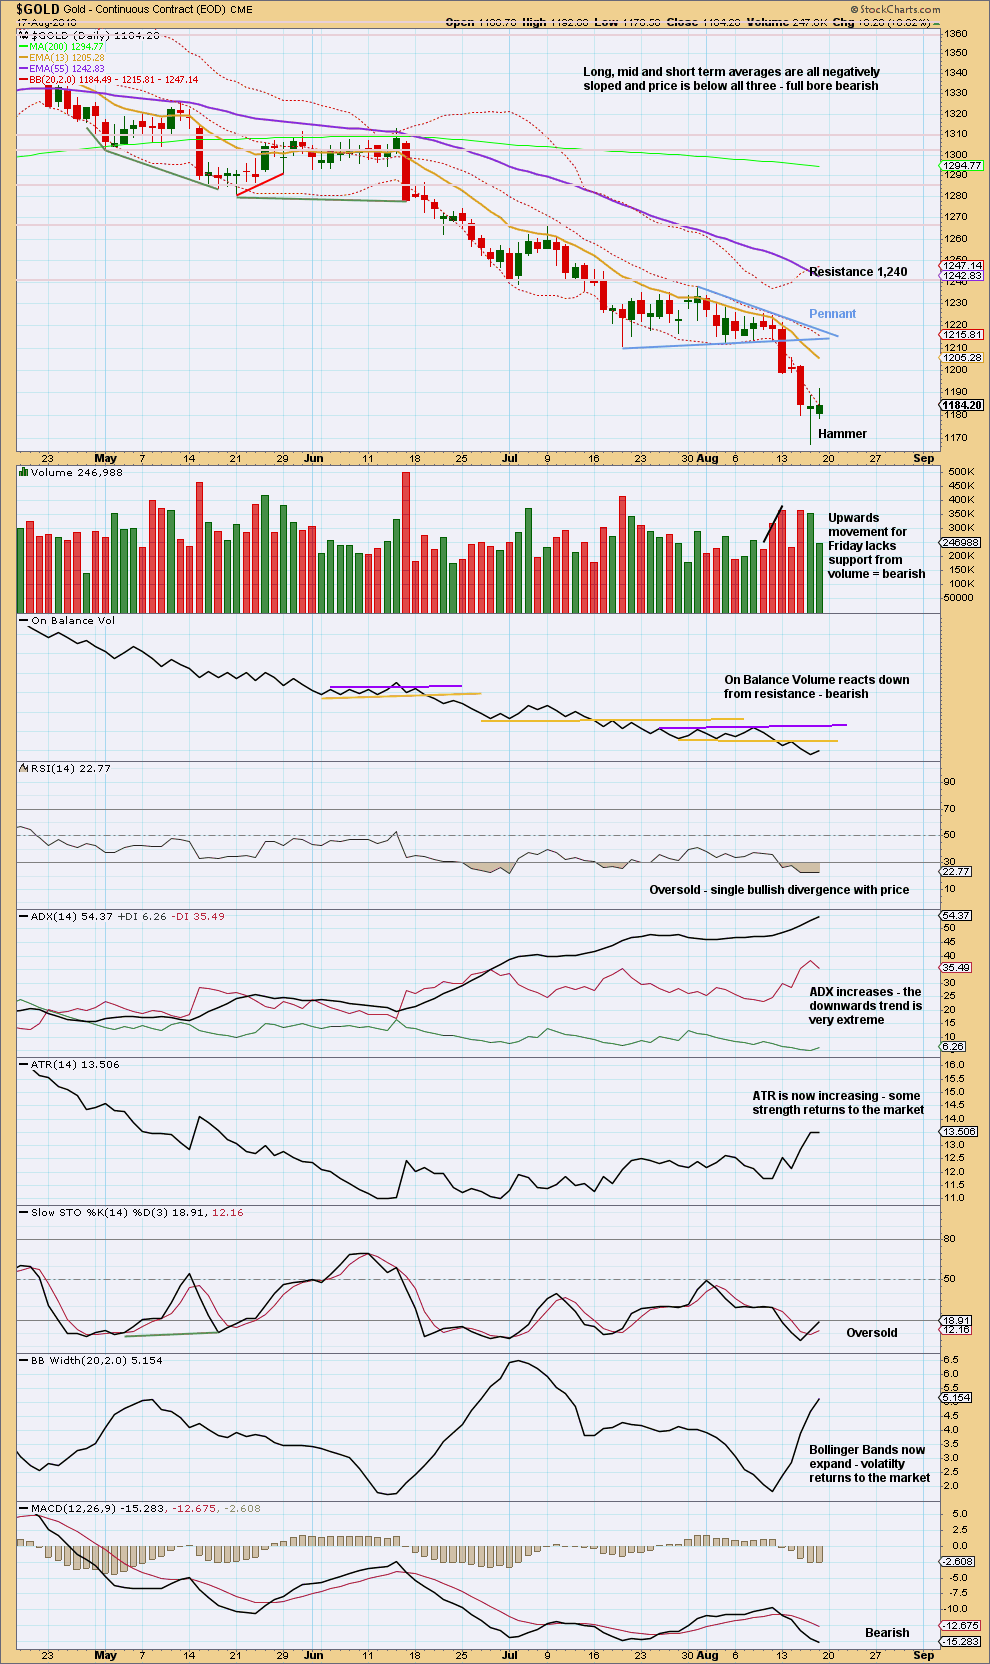
Click chart to enlarge. Chart courtesy of StockCharts.com.
A downwards breakout below the Pennant pattern has support from volume. The target using the length of the flagpole which precedes the Pennant is 1,157.
Support below is now about 1,140.
Gold can sustain an extreme trend for a reasonable period of time. Look now for a clear bullish candlestick reversal pattern to indicate it could be over. There is now a clear Hammer candlestick reversal pattern. After a good downwards trend, this is an indication a low may be in place. For StockCharts data, Friday’s candlestick does not close well into the real body of Wednesday’s candlestick; there is no Morning Doji Star, which is clearly evident on Barchart data.
The Hammer reversal pattern is a strong warning that the downwards trend may be over and a sideways consolidation or new upwards trend may develop from here.
GDX WEEKLY CHART
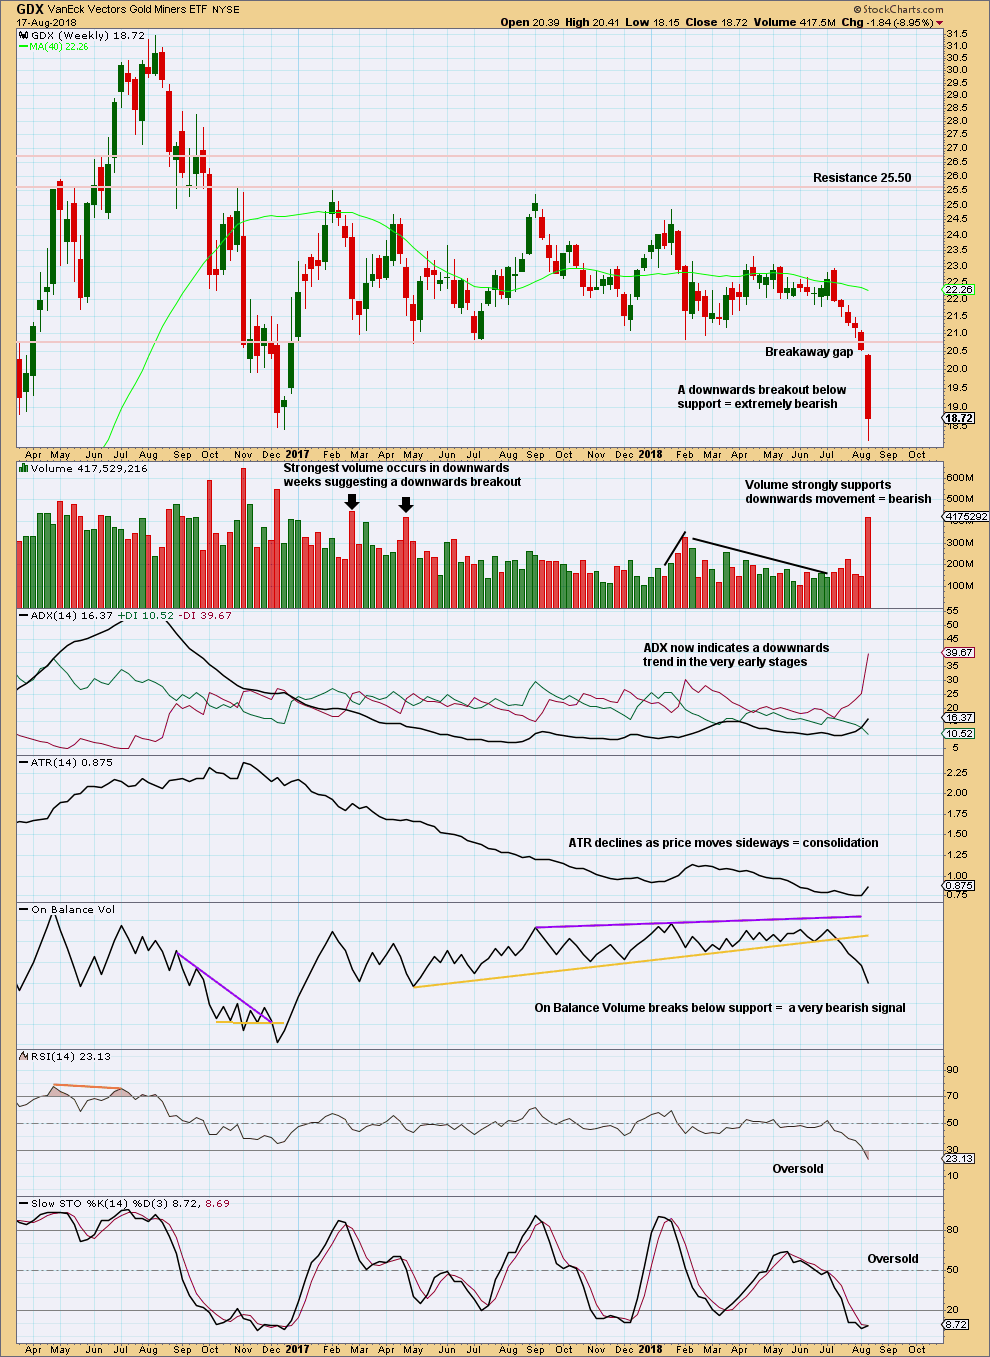
Click chart to enlarge. Chart courtesy of StockCharts.com.
GDX is now moving lower exactly as expected.
After a breakout, a technical principle is the longer that price consolidates sideways the longer the resulting trend may be expected to be. Also, the longer that price meanders sideways the more energy may be released after a breakout. This is what is happening now for GDX.
The target for this downwards trend to end is calculated using the measured rule. The widest part of the consolidation is added to the breakout point at 20.80 giving a target at 16.02. That is not yet met.
At the weekly chart level, there is a clear downwards breakout with a breakaway gap. As breakaway gaps should not be closed, they may be used to set stops that may be set just above a downwards breakaway gap.
GDX DAILY CHART
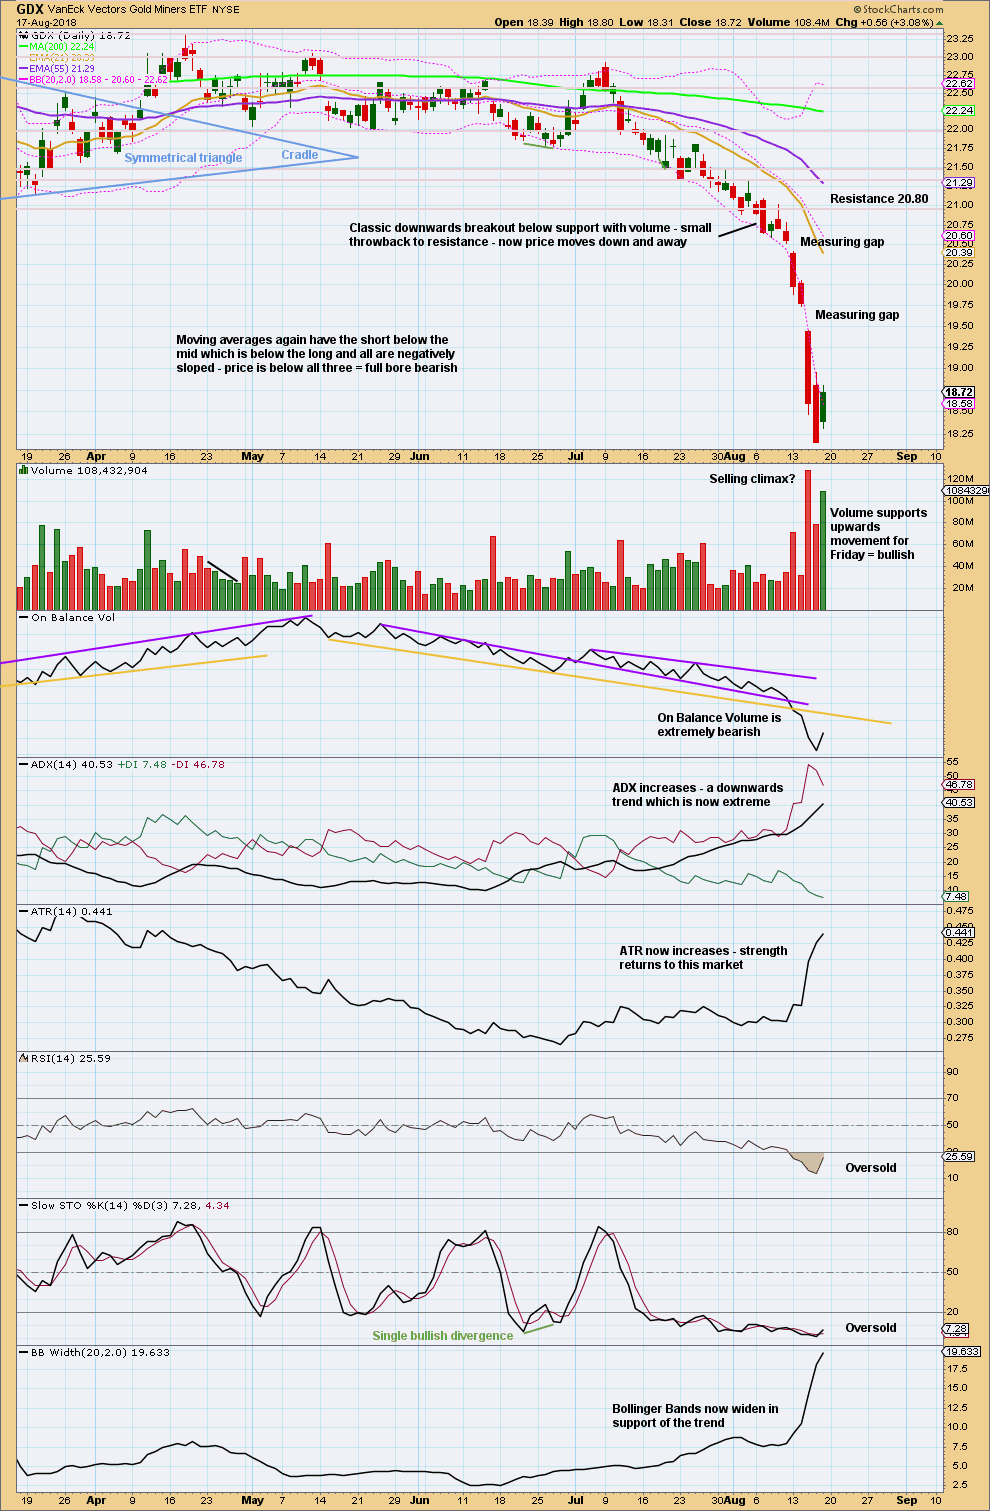
Click chart to enlarge. Chart courtesy of StockCharts.com.
GDX has now closed below support on a strong downwards day with support from volume. New lows are the lowest for GDX since December 2016. This is extremely significant for GDX.
GDX is in a downwards trend.
The very short term picture looks bullish, so a small bounce or consolidation may develop here. The last measuring gap may provide resistance. A closure of this gap with a new high above 19.74 would be significant; at that stage, it would not be a measuring gap but an exhaustion gap. Assume it is a measuring gap, until proven otherwise.
Please remember to protect your trading accounts by careful risk management. Follow my two Golden Rules:
1. Always trade with stops.
2. Risk only 1-5% of equity on any one trade.
A possible target for this downwards trend to end may be now calculated using the measured rule, giving a target about 16.02.
US OIL
Downwards movement was expected for the last week, which is exactly what has happened.
Summary: This consolidation may end next week. It should remain above 55.24. The target is about 61.22 to 61.12.
After one more low below 64.22, look for a candlestick reversal pattern to indicate the consolidation is over. The upwards trend may then resume.
Always practice good risk management as the most important aspect of trading. Always trade with stops and invest only 1-5% of equity on any one trade. Failure to manage risk is the most common mistake new traders make.
MAIN WAVE COUNT
MONTHLY CHART
Click chart to enlarge.
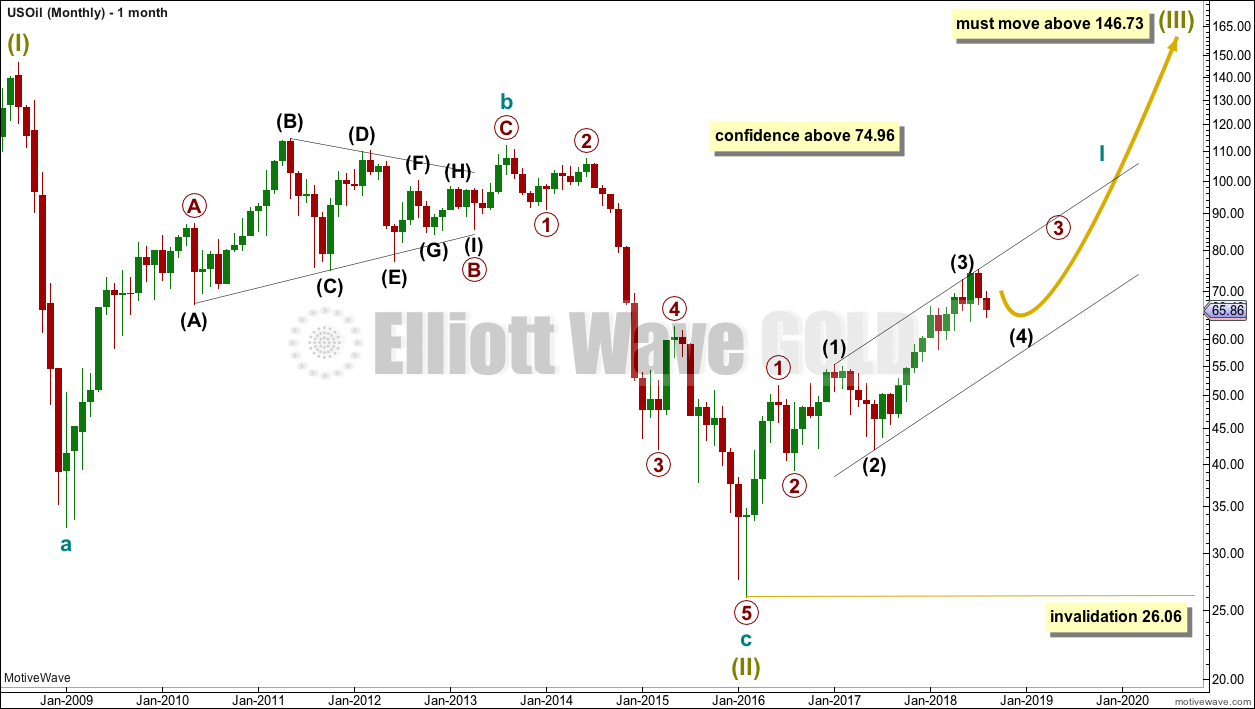
The bear market for US Oil looks to be over and a new bull market looks to be in its very early stages. The prior bearish wave count has been invalidated, leaving only this very bullish wave count.
A huge zigzag down to the last low may be complete and is labelled here Super Cycle wave (II).
Cycle wave b must be seen as complete in August 2013 for this wave count to work. It cannot be seen as complete at the prior major swing high in May 2011.
Cycle wave b is seen as a zigzag, and within it primary wave B is seen as a running contracting triangle. These are fairly common structures, although nine wave triangles are uncommon. All subdivisions fit.
Primary wave C moves beyond the end of primary wave A, so it avoids a truncation. But it does not have to move above the price territory of primary wave B to avoid a truncation, which is an important distinction.
If cycle wave b begins there, then cycle wave c may be seen as a complete five wave impulse.
Super Cycle wave (III) must move beyond the end of Super Cycle wave (I). It must move far enough above that point to allow room for a subsequent Super Cycle wave (IV) to unfold and remain above Super Cycle wave (I) price territory.
Cycle wave I may be incomplete. It may be unfolding as an impulse and may have now moved through the middle portion. Commodities have a tendency to exhibit swift strong fifth waves, and this tendency is especially prevalent for third wave impulses. Intermediate wave (5) to end primary wave 3 may be very swift and strong, ending with a blow off top.
When cycle wave I is complete, then cycle wave II may be a deep correction that may not move beyond the start of cycle wave I below 26.06.
Data from FXCM for USOil does not go back to the beginning of Super Cycle wave (I). Without an accurate known length of Super Cycle wave (I) a target cannot be calculated for Super Cycle wave (III) to end using Fibonacci ratios. The target for Super Cycle wave (III) may be calculated when cycle waves I, II, III and IV within it are complete. That cannot be done for many years.
WEEKLY CHART
Click chart to enlarge.
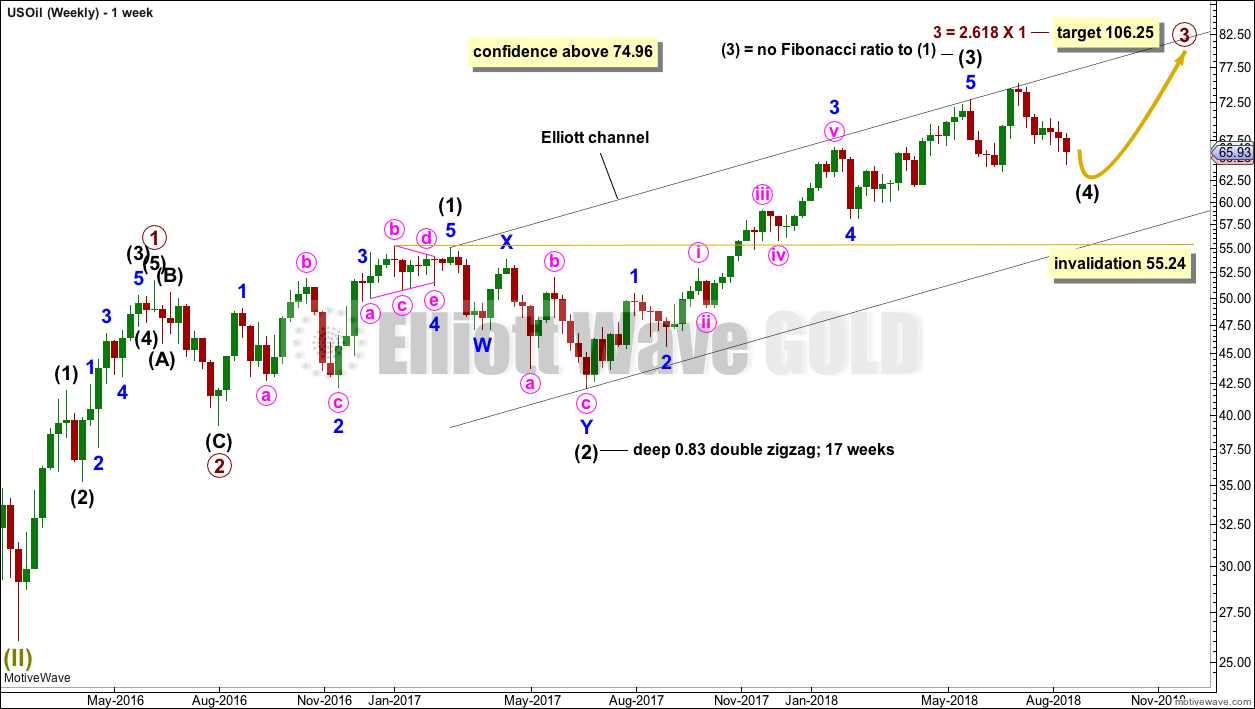
Intermediate wave (3) may now be complete. There is no Fibonacci ratio between intermediate waves (1) and (3), and intermediate wave (3) is longer than 1.618 the length of intermediate wave (1).
This wave count fits with classic technical analysis at the monthly and daily chart levels.
Intermediate wave (2) was a deep double zigzag. Given the guideline of alternation, intermediate wave (4) may be expected to most likely be a shallow flat, triangle or combination. It may be about even in duration with intermediate wave (2), or it may be a little longer because triangles and combinations are more time consuming structures.
In the first instance, a Fibonacci 13 weeks may be expected for intermediate wave (4). So far intermediate wave (4) has lasted 12 weeks, so it could end next week. If it does not end there and continues sideways, then the next Fibonacci ratio in the sequence would be a Fibonacci 21 weeks.
Intermediate wave (4) may find support about the lower edge of the black Elliott channel. It may end within the price territory of the fourth wave of one lesser degree; minor wave 4 has its territory from 66.65 to 59.13.
At this stage, there are still multiple structural options for intermediate wave (4) to complete as. They will be separated out into separate charts.
FLAT
Click chart to enlarge.
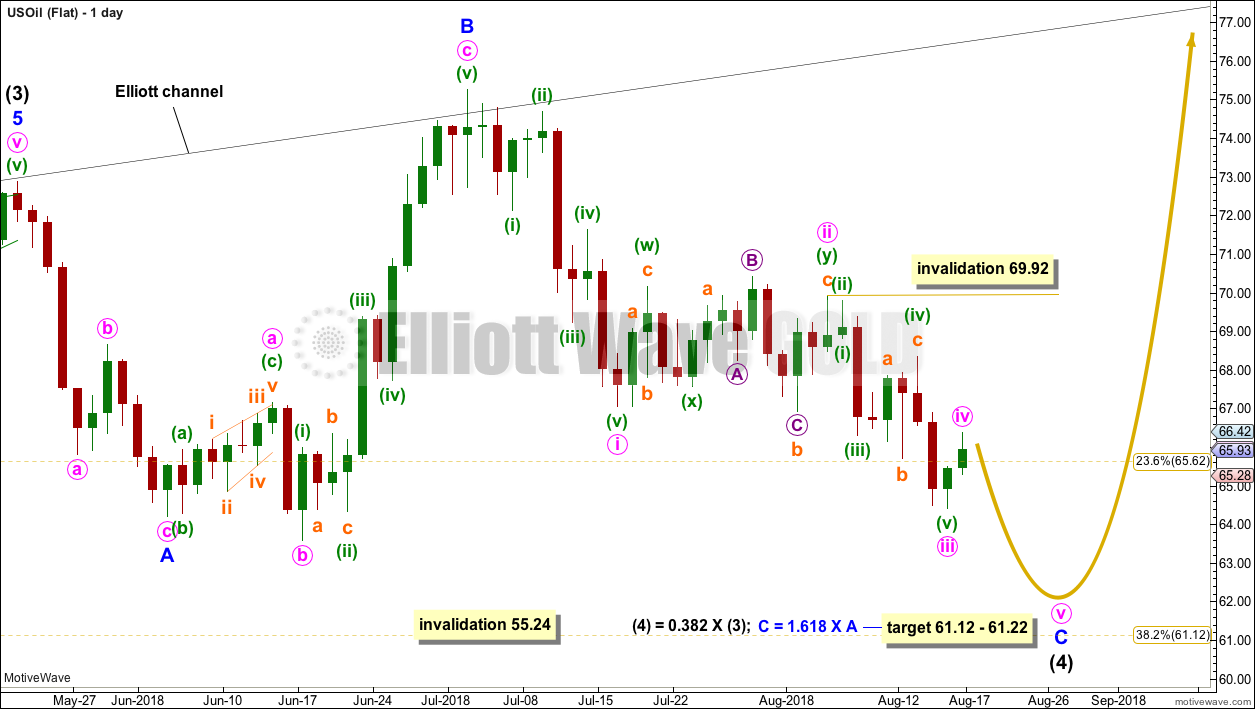
Of all the daily charts, this first chart at this stage has the best look and may have the highest probability.
Intermediate wave (4) may be unfolding as a flat correction. Within the flat correction, minor wave A may be a complete zigzag and minor wave B may be a complete expanded flat correction, a 1.27 length of minor wave A, which is within the most common range of from 1 to 1.38. An expanded flat is indicated.
Expanded flats normally see C waves move substantially beyond the end of their A waves. A target for minor wave C is calculated, which expects it to exhibit a common Fibonacci ratio to minor wave A. This target is very close to the 0.382 Fibonacci ratio of intermediate wave (3).
Minor wave C must subdivide as a five wave structure.
It is possible that minute waves i, ii and now iii may all be complete within minor wave C. Minute wave ii subdivides as a shallow double combination. Minute wave iii may be a complete impulse.
The degree of labelling of minute wave iii will be correct while price remains below the end of minute wave i at 67.05. For the short term, a new high above 67.05 would see the degree of labelling within minute wave iii moved down one degree; if that were to occur, only minuette wave (i) within minute wave iii would be complete and minuette wave (ii) would be limited to no further than the start of minuette wave (i) at 69.92. For this reason the invalidation point is at 69.92 and not 67.05.
Minor wave C may complete within one more week, which would see intermediate wave (4) complete in a total Fibonacci 13 weeks.
At this stage, minor wave C has not moved below the end of minor wave A at 64.22. Minor wave C is extremely likely to make at least a slight new low below the end of minor wave A to avoid a truncation and a very rare running flat. As soon as a new low below 64.22 occurs, it would be possible that minor wave C could be over.
Intermediate wave (4) may not move into intermediate wave (1) price territory below 55.24.
FLAT – ALTERNATE
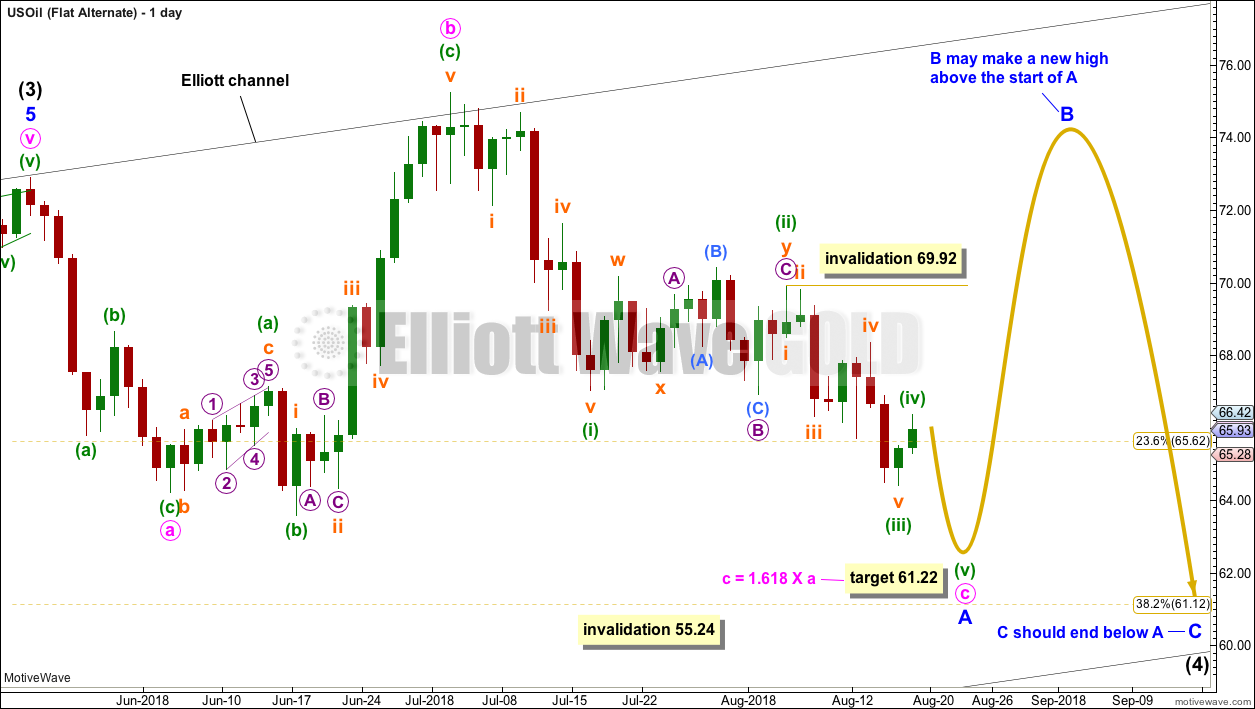
Click chart to enlarge.
This alternate idea is identical to the first flat wave count with the exception of the degree of labelling. Here, the degree of labelling within intermediate wave (4) is moved down one degree. Minor wave A may be an incomplete flat correction.
The target and expected direction is the same. The upper invalidation point is the same for the short to mid term.
This wave count allows for intermediate wave (4) to be longer lasting. At this stage, it is looking less likely than the first wave count.
COMBINATION
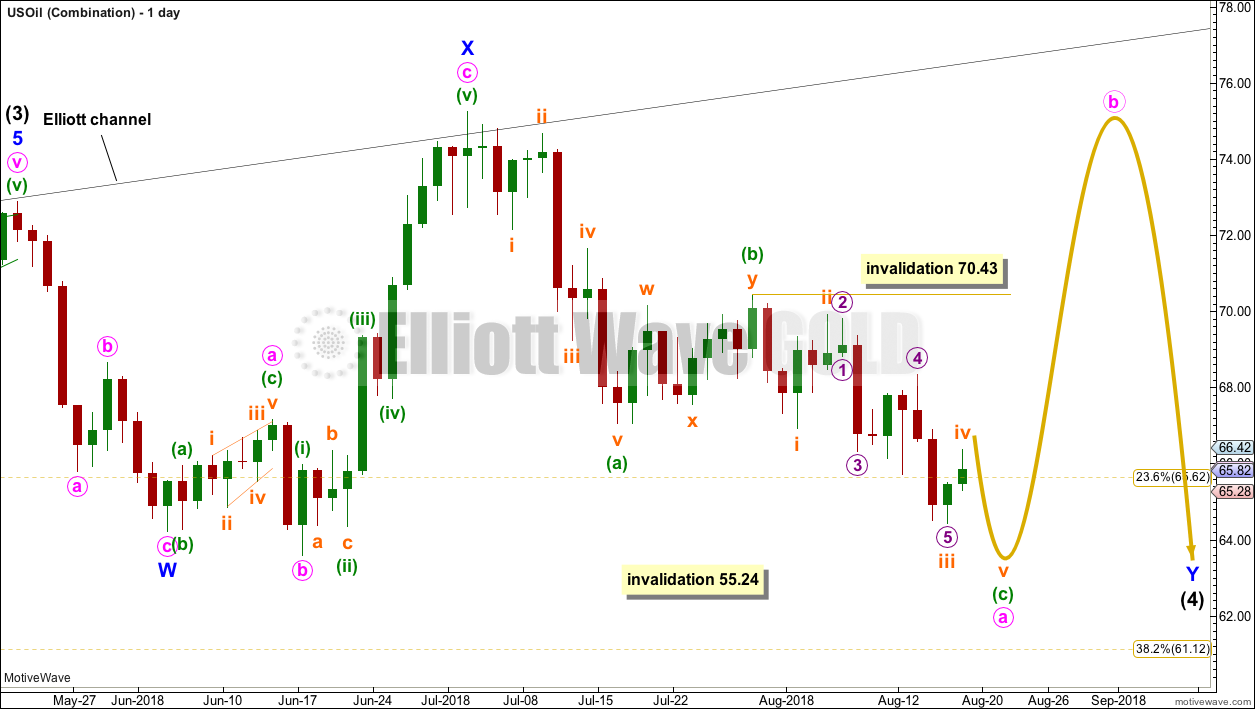
Click chart to enlarge.
Intermediate wave (4) may be unfolding as a double combination.
The first structure in the double may be a completed zigzag labelled minor wave W. The double may be joined by a three in the opposite direction, an expanded flat labelled minor wave X.
The second structure in the double may be either a flat or a triangle, with a flat correction much more likely, so that is what will be expected.
Within the flat correction of minor wave Y, minute wave a must subdivide as a three. An alternate way of seeing this downwards wave for this wave count is considered. Minuette wave (b) may have been over earlier as a shallow double zigzag, and minuette wave (c) may have begun there as an impulse. The impulse of minuette wave (c) may be incomplete and need only one new low to complete it.
Within the flat correction of minor wave Y, when minute wave a is a completed three wave structure, then minute wave b must unfold upwards and must retrace a minimum 0.9 length of minute wave a. Minute wave b at that stage may make a new high above the start of minute wave a at 75.26.
Minor wave Y would most likely end about the same level as minor wave W at 64.22, so that the whole structure takes up time and moves price sideways.
COMBINATION – ALTERNATE
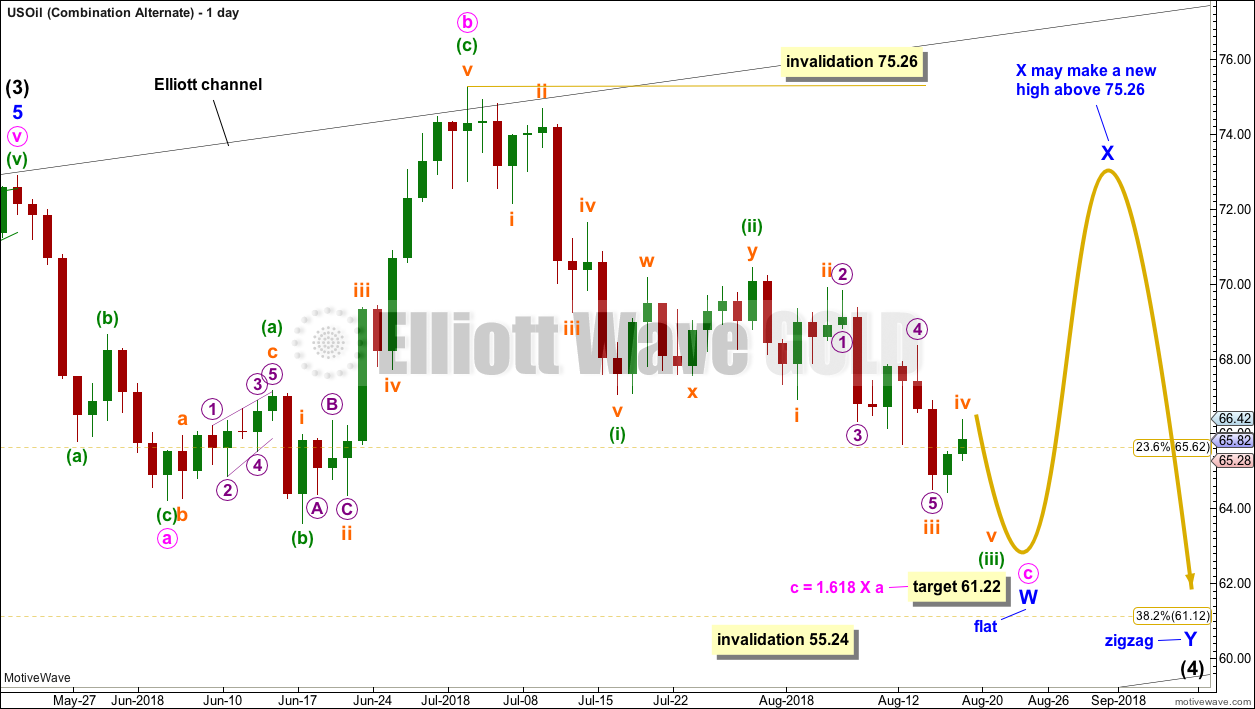
Click chart to enlarge.
This alternate idea for the combination again moves the degree of labelling within intermediate wave (4) all down one degree.
The first structure in a double combination may be an incomplete flat correction labelled minor wave W. Within the flat correction of minor wave W, minute wave c would be extremely likely to make at least one slight new low below the end of minute wave a at 64.22 to avoid a truncation and a very rare running flat.
When minor wave W is complete, then minor wave X should unfold as a three wave structure upwards, most likely a zigzag. Minor wave X has no minimum requirement nor no maximum allowable length.
Thereafter, minor wave Y would most likely be a zigzag and would most likely end about the same level as minor wave W, so that the whole structure takes up time and moves price sideways.
A double combination with this degree of labelling could take several more weeks to unfold. At this stage, this looks to be too time consuming considering the proportion between intermediate waves (2) and (4) on the weekly chart.
TRIANGLE
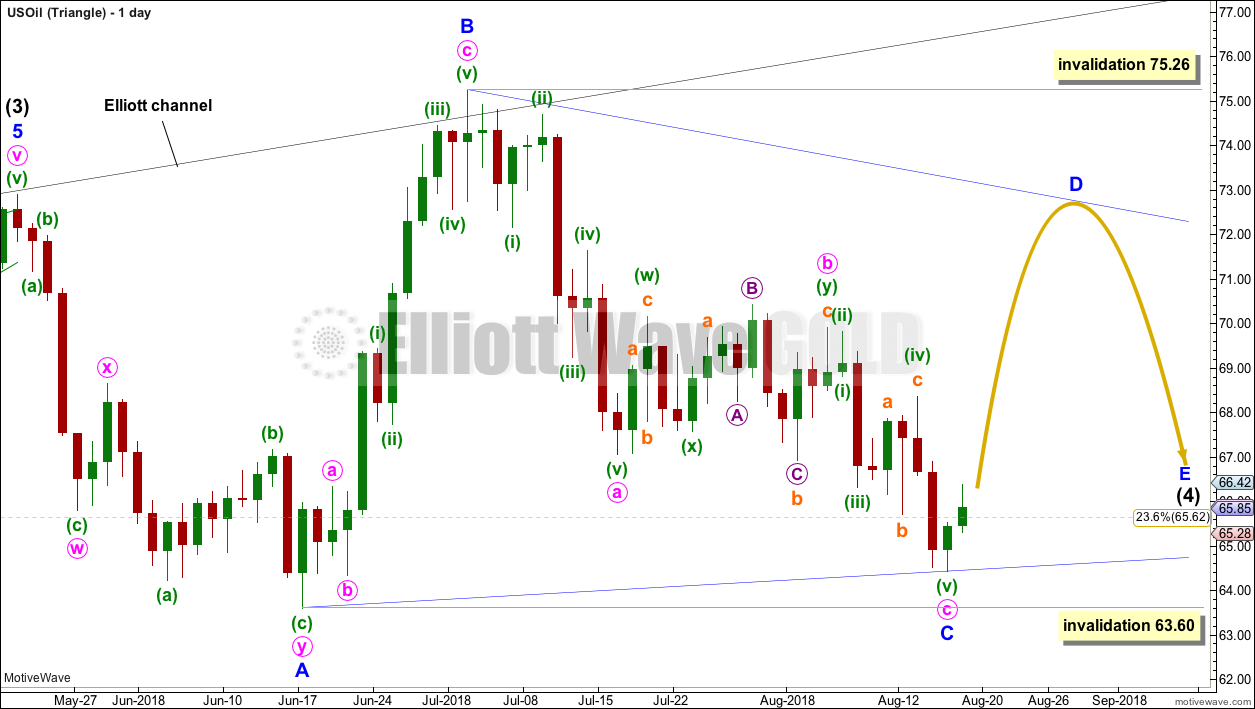
Click chart to enlarge.
Intermediate wave (4) may be unfolding as a triangle.
Within the triangle, minor wave A should be seen as over at the last low. This is problematic because it does not fit as a single zigzag. It can be seen complete as a double zigzag, but this looks forced because minute wave w does not look like a very clear three.
If minor wave A is a double zigzag, then all remaining triangle sub-waves must subdivide as single structures. All but one of them must be zigzags and one triangle sub-wave may be another type of corrective structure.
Within the triangle, minor wave C may be now a complete zigzag. Minor wave D may now be a strong bounce that may not move reasonably beyond 75.26.
If intermediate wave (4) is unfolding as a contracting triangle, then minor wave D may not move beyond the end of minor wave B.
If intermediate wave (4) is unfolding as a barrier triangle, then minor wave D may end about the same level as minor wave C; the triangle wave count would remain valid as long as the B-D trend line remains essentially flat, which is subjective (the upper invalidation point is not black and white).
Minor wave C may not move beyond the end of minor wave A below 63.60.
A triangle may take several more weeks to complete. They are often very time consuming structures.
TECHNICAL ANALYSIS
MONTHLY CHART
Click chart to enlarge. Chart courtesy of StockCharts.com.
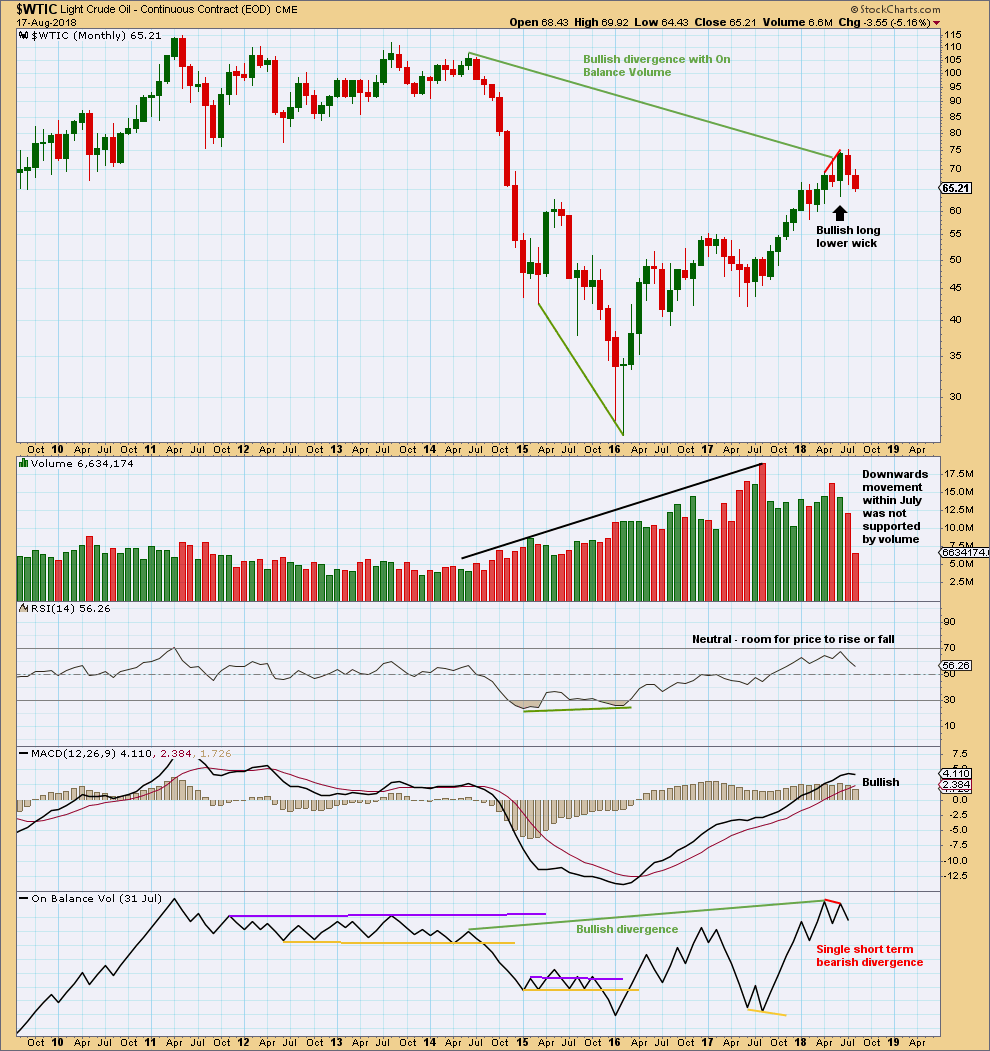
The short term volume profile is bearish: the strongest month in the last few months was the downwards month of May (where the balance of volume was down) and now June shows a decline in volume, so volume has not supported upwards movement here.
July saw another red monthly candlestick with the balance of volume downwards, but the market fell of its own weight; it was not supported by volume. This is not necessarily bullish, but it does point to a consolidation as somewhat more likely here.
For the short term, On Balance Volume is also slightly bearish. This supports the idea that price may be within a correction and not necessarily a continuation of the larger upwards trend.
However, it is entirely possible that this situation could reverse and volume could start to support upwards movement, as has happened back in January 2018.
The larger trend is upwards.
WEEKLY CHART
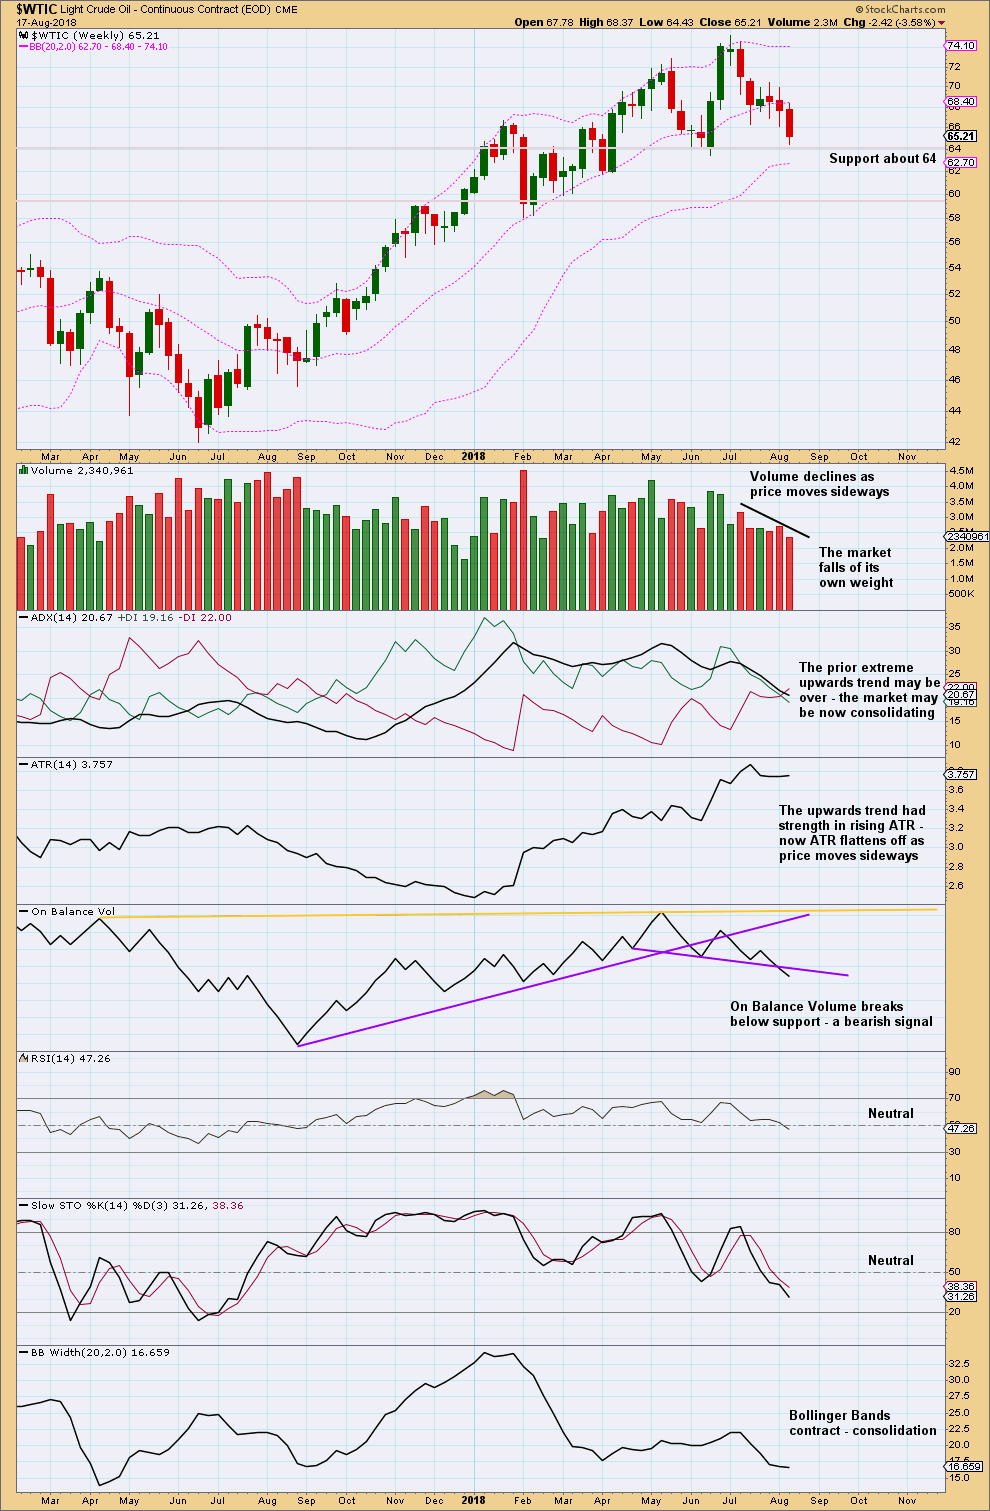
Click chart to enlarge. Chart courtesy of StockCharts.com.
Price needs to break below support, and close below it at about 64.00, for a downwards trend to be considered.
On Balance Volume is very bearish.
DAILY CHART
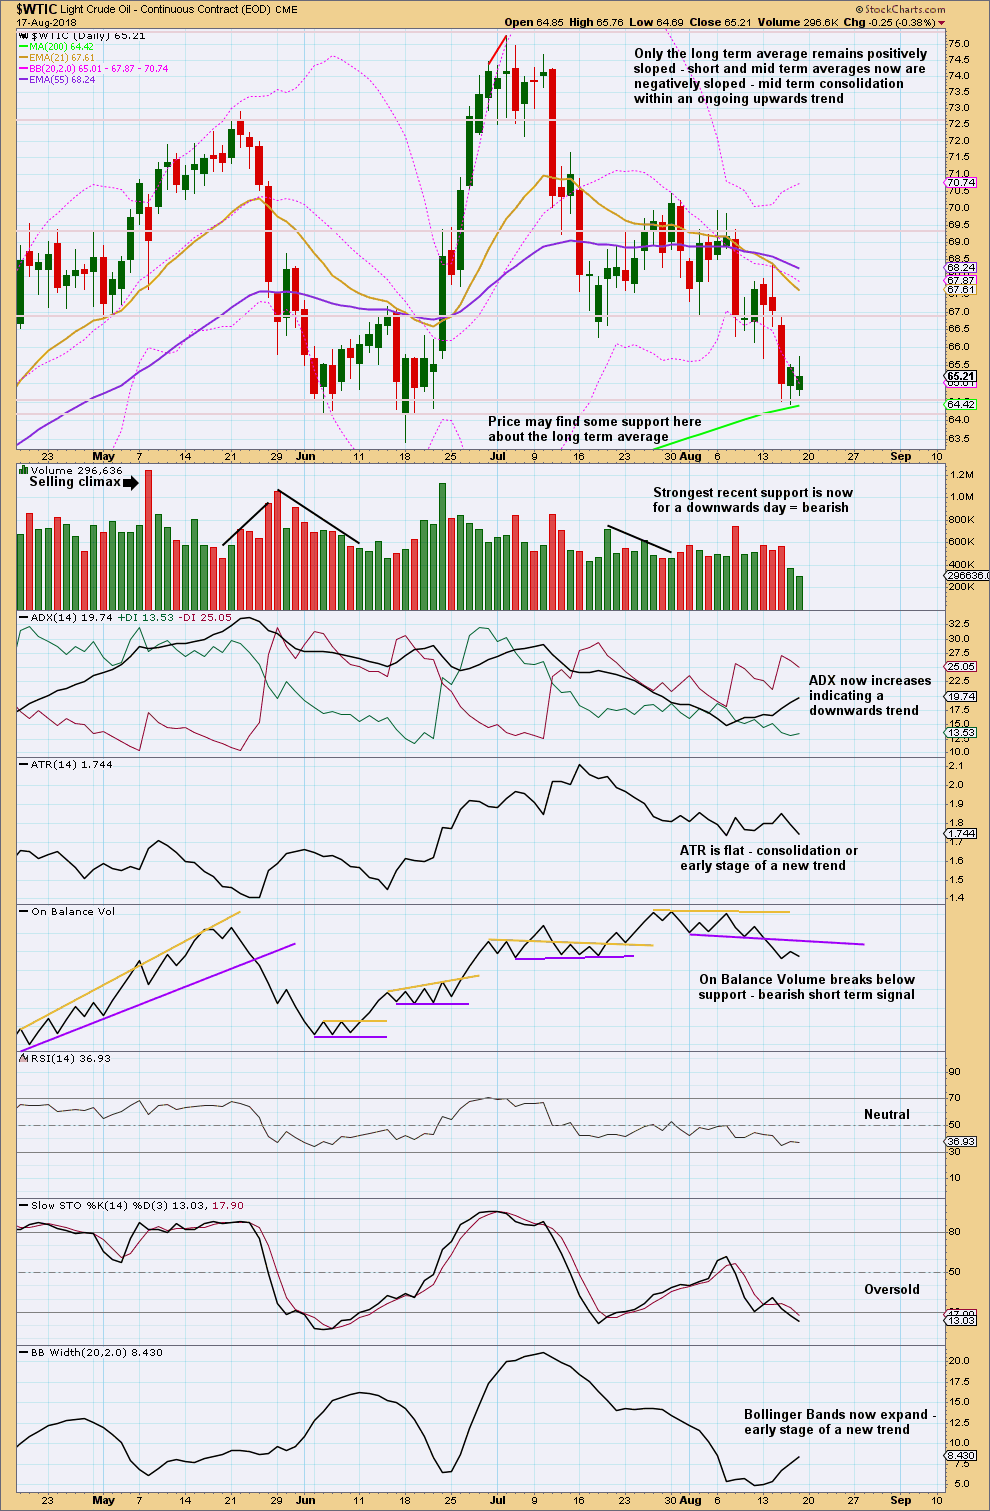
Click chart to enlarge. Chart courtesy of StockCharts.com.
ADX now indicates a downwards trend at the daily chart time frame.
Stochastics is just now oversold; when Oil trends strongly, Stochastics may remain extreme for reasonable periods of time.
RSI is neutral, so there is plenty of room for price to fall.
If price can close below support here, at about 64.00, then consider a new downwards trend.
An update today for the S&P500. I expect minute iv has morphed into a double combination, the triangle as I have it labelled in the published analysis above is now invalidated.
Today there is a Gravestone Doji reversal candlestick. It is for this reason that I expect a pullback now to about 2,800 to last a few days. The Gravestone Doji forte is in calling tops when they appear after a rise.
Thanks for your August 21 post. I sold my long position with the hope that the (e) wave completion explained in your weekly analysis of the DAILY CHART would offer a good reentry point. Yesterday I was questioning the wisdom of that decision. Your post was a welcome indication that it will probably work out for me.
Be aware that I could be wrong. There are alternates.
Long positions opened on the backtest of support after the breakout of the triangle on or shortly after 29th of May may still be held, until primary 3 ends.
The idea of Lara’s Weekly is to focus on the mid to long term picture, to avoid the noise of short term movements, in the hope that members may be able to make longer term trades and avoid jumping in and out of a trend.
Enter early when a new trend is identified, hold the position until it’s proven that the structure is complete and the trend has ended. We may miss the very first and very last portion, but get the meat in the middle. General idea anyway.
Oops! Not your fault in any way. I knew I was taking a risk. In general I have used your guidance in the way you suggested since mid-April. The gains have been good. I was trying to enhance the return from here to 2922. I don’t always get my way but when I do it is lots of fun.
Lara,
I also thought I’d share a bullish twin peaks pattern. Notice the AO divergence at the lows. This doesn’t provide any evidence that the down trend has changed, only that momentum has.
Sorry just put to much time into studying. Looking for that advance warning for next pattern.
I’m enjoying your analysis of the market. I also bought “Technical Analysis: The Complete Resource for Financial Market Technicians” by Charles D. Kirkpatrick II and Julie A. Dahlquist. Years of studying with this book 🙂
An excellent purchase Bill. I refer to this book regularly still. I find it so easy to follow.
A bullish twin peaks pattern is new to me, I can’t find any reference to it in my textbooks. It would be helpful if you could note it on your chart, making it explicit would make it easy to follow.
Lara,
How would advance decline line differ from on balance volume?
Thank you
Bill
They differ substantially.
On Balance Volume is of course a measure of volume. It shows where there is more pressure from volume, up or down.
The Advance Decline Line is a measure of market breadth, so applicable to indices only, not individual equities, currencies or commodities. The AD line rising indicates breadth rising, and the AD line falling indicates breadth falling. I think I did a small series of educational posts a while ago which covered the basics of the major indicators I use. I have two articles on On Balance Volume:
http://elliottwavegold.com/2015/12/on-balance-volume/
http://elliottwavegold.com/2017/06/on-balance-volume-beyond-volume-basics-23rd-june-2017/
I don’t have any articles for the AD line. I should do that.
Perhaps take some time to scroll through the education category (access this via the RH sidebar which you can see when you’re logged in and viewing a post, it’s a drop down menu). There’s some helpful stuff in there.
Great thanks! I’d love to see what you have to say about the AD line. I didn’t know that education part was there. I didn’t do very well on the 5 mistakes in wave labeling, well was trying to over think it. I found a few but I didn’t know how to fix it. I use the 13 ema and 34 ema as waves change degree once the 34 ema is crossed.
If you find the “spot the mistakes” posts a helpful learning tool, then I can do more.
Lara,
I appreciate that offer. I’m so busy I’m having a hard time finding time to put together a successful trading plan. So I might not be able to participate.
Thank you
Bill
Hello Lara! Thanks for your analysis It is quite comprehensive and thorough. As of recently gold price correlates very much with USD index at higher level ( not on daily basis). Could you pls update your USD index wave count so that it more or less corresponds to your gold’s base case( triangle) and alternatives???? It is also helpful to look at EEM etf as it moves opposite to the USD to large extent? Your base case triangle for gold implies bullish case for the USD, but you last base case for USD is very much bearish☝️☝️☝️ Can it be that USD has shown the high just under 97 recently and the only way for it to go down for short and medium term???? Thanks
I know that this is not going to be the answer you wanted, and it’s an enormously unpopular view, but these two markets do not have a reliable correlation, even at the monthly chart level.
With no reliable correlation it would not be a reasonable approach for me to base my Elliott wave count of one upon the other.
Any two markets that have a correlation co-efficient that spends time between -0.5 and +0.5 is not reliably correlated. A correlation co-efficient between these two points has:
1. too weak a correlation to expect they should move together (positive) or opposite (negative
2. any weak correlation may be simply due to chance and not due to a real relationship between the two markets.
The belief that Gold and USD are negatively correlated is not supported by the math.
I will always try to suspend emotion and base my analysis on data.
I will update my USD Index analysis for you today.
Please read this article I have written which goes into a little more depth about the correlation co-efficient.
And here is a current monthly chart of the USD index with the correlation co-efficient to Gold at the bottom.
As you can see, it can fluctuate from negative, through to very weakly positive.
The fact is that it has done so before, so we must allow that it could do so again at any time.
Thanks! That is great to be rigorous with your analysis☝️💪 But, all the latest trend changes of gold happened almost exactly at the same time USD showed tops/bottoms as if it squeezes gold or let it go up or even fly as happened in late 2015 beginning 2016☝️ As we do not have inflation in the US above 2%… the only thing that truly drives gold is USD…. until the US stock market goes up, the Fed will be aggresive with short-term rates and if other CBs do not switch to agression with IR policies the USD will be heading up and the gold, gdx will be under pressure – that is what we see right now and that is what the charts have been showing since Feb 2018… Lets see what happens when US market shows its top (2920-3040) and starts to correct in bigger way… maybe, then Fed Res will put rates rising policy on hold and kick the USD so that it goes down and much deeper giving way to gold/raw materials and EEM…. let’s see… so far, it doesn’t seem that USD has topped and gold’s gdx weakness and behavior confirm this trend …. anyway, thanks for analysis and rigour!
Elliott wave is mutually exclusive to fundamental analysis. Elliott wave turns the commonly held expectation of market relationships upon it’s head.
For example, Elliott wave states that it is the wave structure which determines what the Fed will or will not do, and not that the Fed has any influence on market price.
And so I do not expect that anything the Fed will do is going to affect the Elliott wave count. In fact, I go so far as to take no notice whatsoever to what the Fed or politicians or pundits say.
Finally, I’ve just taken a look at the correlation co-efficient of EEM to $GOLD. There is most certainly no reliable correlation.
StockCharts has this handy tool under indicators.